 Open Access Article
Study on the fouling mechanism and cleaning method in the treatment of polymer flooding produced water with ion exchange membranes†
Qing Xiaa,
Haicheng Guob,
Yubing Yea,
Shuili Yu *a,
Lei Lia,
Qi Lia and
Ruijun Zhangc
aState Key Laboratory of Pollution Control and Resource Reuse, School of Environmental Science and Engineering, Tongji University, Shanghai 200092, China. E-mail: ysl@tongji.edu.cn; Fax: +86 21 65982708; Tel: +86 21 65982708
bShanghai Municipal Engineering Design Institute (Group) Co., Ltd., Shanghai 200092, China
cDepartment of Chemical Engineering, KU Leuven, Celestijnenlaan 200F, B-3001 Heverlee, Belgium
First published on 24th August 2018
Abstract
The complex interactions between organic and inorganic foulants in polymer flooding produced water (PFPW) play a significant role in membrane fouling characteristics during the treatment processes with ion-exchange membranes (IEMs). In order to ensure the desalination capacity of IEMs during electrodialysis, this work systematically investigated the fouling mechanism and cleaning properties with different synthetic solutions as feed water. The results demonstrated that the desalination rates of the IEMs decreased by 39.73%, 43.05%, 45.81% and 52.72% when fouled by HPAM, HPAM-inorganic (i.e., CaCl2 and NaHCO3), oil emulsions and oil–HPAM-inorganic, respectively. The results of membrane resistances and SEM images indicated that organic foulant (i.e., HPAM) and inorganic components have a synergistic effect on the fouling of IEMs. The membrane cleaning method using acid–base-sodium dodecyl benzene sulfonate (SDBS) was proposed here to recover the performance of the IEMs after being fouled by feed solution containing oil–HPAM-inorganic compounds. The desalination rate of the IEMs after membrane cleaning increased from 39.62% to 81.39%. This indicated that the acid–base cleaning alone eliminated the inorganic precipitation and gel layer, and the subsequent SDBS cleaning removed the dominant oil emulsion layer.
1 Introduction
The oil industry plays an important role in the development of economy and society. In order to ensure continuous oil supply, technologies for enhancing oil recovery have received worldwide attention. At present, Daqing oilfield, the largest one in China, has boosted oil recovery by adopting polymer flooding technology due to its low cost and easy operation. Polymer flooding involves injecting water containing polymer into the oil layer to widen the scope of oil exploitation and increase the oil production.1,2 However, this technology has also produced more than 75 million tons of polymer flooding produced water (PFPW) every year.3 PFPW is a complex and multiphase system with solids, liquids, gases, dissolved salts and other types of impurities, and it is harmful to the oil field and the surrounding environment.4–6 Membrane technology, which has gained popularity in water and wastewater treatment, has also been utilized in the treatment of PFPW.7–11 Some studies have indicated that the water quality indexes, including concentration of suspended substances, the oil content and the median particle size can meet the standards of water reinjection after a conventional pretreatment followed by an ultrafiltration (UF) process. Nevertheless, the UF effluent still has a high degree of mineralization. The succedent electrodialysis (ED) process has successfully been used to reduce the salinity of PFPW, and wastewater after treatment can meet the requirements for the preparation of a polymer solution aiming for wastewater zero-emission.12–14The ED process utilizes a potential difference as the driving force, in which the anionic and cationic ions migrate from the dilute compartment across the IEMs to the concentrated compartment under a DC electric field.15–18 ED as an important ion-exchange membrane (IEM) based electrochemical separation process has been extensively in water desalination. Nevertheless, membrane fouling is a main obstruction for the application and development of ED.19,20 Foulants in feed solutions may change the physical and chemical properties of the membranes and deteriorate the membrane performance analyzing the fouling mechanism of IEMs is the foundation of exploring measures for membrane fouling control.
Membrane fouling is mainly divided into organic fouling and inorganic fouling. There exist many studies with respect to organic fouling on IEMs.21–27 Tanaka et al.28 investigated the organic fouling mechanism of anion-exchange membranes (AEMs) and found that electrostatic interactions, affinity interactions and geometrical factors play important roles in the ED process. Ruiz et al.29 studied the influence of a pulsed electric field with a low frequency square-shaped periodic signal during the ED of a casein solution on membrane fouling and indicated that protein fouling might be resulted by the dissociation of water molecules and the heat increase at the anion-exchange membrane (AEM) interface. Some researchers have also focused on the inorganic fouling of IEMs.30,31 Bao et al.32 indicated that the fouling of inorganic salts on IEMs was reversible, generally in the form of direct surface crystallization and/or precipitation. Meital Asraf-Snir et al.33 investigated the formation of gypsum scale in IEMs under a Donnan exchange regime and found that the scaling in the homogeneous membrane was mainly characterized by surface deposits, while the heterogeneous membrane showed a high degree of internal precipitation. All in all, fouling of the IEMs during ED process is related to the functional groups of the membranes, structure of the membrane polymeric matrix and properties of the foulants. The fouling would increase the membrane electric resistance and decrease the selectivity of the IEMs, resulting in a higher power consumption and a lower water quality.34–37 In this regard, effective fouling control techniques are necessary to delay the membrane fouling process, extend the membrane life, and reduce the maintenance cost. At present, regular membrane cleaning is still the most important method for controlling IEM fouling in ED industrial applications.38,39 As the wastewater system is complex and stable, interactions might exist between different components, which makes the fouling layer more complicated and causes difficulties in membrane cleaning. As far as we know, previous researches mainly focused on the fouling of a single component in PFPW treatment.40,41 The interactions between different foulants in ED process were barely discussed. In addition, there are few studies systematically investigated the cleaning of IEMs fouled by different foulants of PFPW.
In this research, membrane fouling mechanisms during PFPW treatment by ED were fully investigated. Moreover, effects of different cleaning agents were explored and appropriate cleaning methods aimed at different foulants were found out. The fouling properties and cleaning efficiency of the cleaning methods were evaluated by membrane resistance, contact angle, SEM and desalination capacity of the IEMs. In addition, zeta potentials and ATR-FTIR spectra were measured to verify the fouling mechanism. This work will provide references for controlling membrane fouling and prolonging the life in treating PFPW by ED process.
2 Materials and methods
2.1 Electrodialysis apparatus and membranes
The ED experiments were performed using a six-cell electrodialysis apparatus made of plexiglass. As shown in Fig. 1, three anion-exchange membranes (AEMs) and two cation exchange membranes (CEMs) were alternately installed in the ED stack. The effective membrane area of the ED cell was 42 cm2. Homogeneous IEMs (Shandong Tianwei Membrane Technology Co., Ltd) made from polyphenylene were applied, and the functional groups of the CEMs and AEMs were sulfonic acid groups and quaternary ammonium groups, respectively. AEMs and CEMs were soaked in deionized water for more than 24 h prior to use.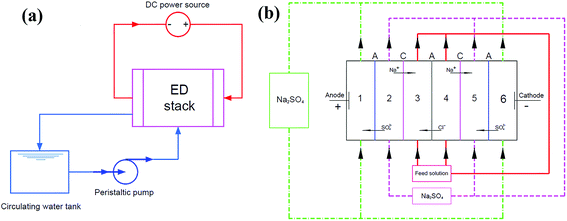 | ||
| Fig. 1 Schematic diagram of the (a) ED set-up, (b) the six-compartment stack for electrodialysis experiments (C: cation; and A: anion exchange membranes). | ||
For the electrode solution, 0.8 L of 0.04 M Na2SO4 was used in chamber 1 and 6. Chambers 2 and 5 were filled with 0.5 L of 0.04 M Na2SO4. Chambers 3 and 4, which were defined as the concentrated and dilute compartments, respectively, were filled with 0.5 L of the feed solutions (0.05 M NaCl solution or 0.05 M NaCl solution containing a variety of fouling components). The solutions were continuously pumped through the compartments from reservoir vessels using a peristaltic pump BT100-L (Longer Pump, China) with a flow rate of 10 mL min−1.
2.2 Fouling experiments
| Experimental number | Components of the feed solution | Fouling type |
|---|---|---|
| M1 | 50 mM NaCl | Virgin IEMs |
| M2 | 1 mM CaCl2 + 50 mM NaHCO3 | Inorganic fouling |
| M3 | 200 mg L−1 HPAM + 50 mM NaCl | HPAM fouling |
| M4 | 200 mg L−1 HPAM + 1 mM CaCl2 +50 mM NaHCO3 | HPAM-inorganic fouling |
| M5 | 100 mg L−1 oil emulsion + 50 mM NaCl | Oil emulsion fouling |
| M6 | 100 mg L−1 oil emulsion + 200 mg L−1 HPAM + 1 mM CaCl2 + 50 mM NaHCO3 | Oil emulsion–HPAM-inorganic fouling |
2.3 Cleaning experiments
To recover the membrane performance, regular cleaning of the fouled IEMs was necessary after a period time of ED process. In situ cleaning experiments were implemented in this study. The solutions in all compartments were switched to the cleaning agent (including 0.1 M HCl, 0.1 M NaOH and 3 wt% SDBS) and all the other conditions of the device unchanged. The cleaning agent, (including 0.1 M HCl, 0.1 M NaOH and/or 3 wt% SDBS), circulated between the ED stack and tank at a maximal flow rate actuated by the peristaltic pump at room temperature (25 ± 1 °C). The cleaned membranes were then stored in a 0.5 M NaCl solution to prepare for subsequent characterization analyses.Table 2 listed the different cleaning methods adopted according to the membrane fouling type. The cleaning experiments also repeated for three times.
| Methods | Agent | Time |
|---|---|---|
| Water cleaning | Distilled water | 30 min |
| Acid cleaning | 0.1 M HCl | 30 min |
| Base cleaning | 0.1 M NaOH | 30 min |
| SDBS cleaning | 0.3 wt% SDBS | 30 min |
| Acid–base cleaning | 0.1 M HCl and 0.1 M NaOH | Cleaning in HCl for 30 min and subsequently in NaOH for 30 min |
| Base–acid cleaning | 0.1 M NaOH and 0.1 M HCl | Cleaning in NaOH for 30 min and subsequently in HCl for 30 min |
| Acid–base-SDBS cleaning | 0.1 M NaOH, 0.1 M HCl and 0.3 wt% SDBS | Cleaning in HCl, NaOH and SDBS for 30 min, successively |
2.4 Analytical methods
| RA = (Rm+s − Rs)A | (1) |
| DR (%) = (C0 − Ct)/C0 | (2) |
3 Results and discussion
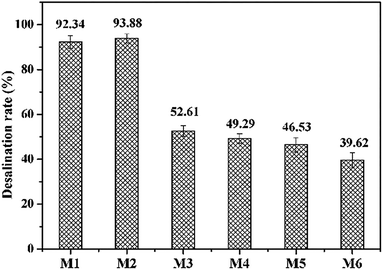
3.1 Organic and inorganic fouling of IEMs
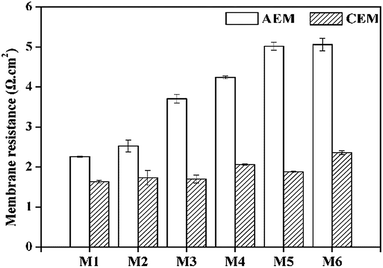
To understand the fouling properties we studied the effects of different foulants in PFPW on the IEMs. A set of fouling experiments (S1–S6, Table 1) were conducted with different feed solutions. Symbol S1–S6 in the figures represented the membranes after different fouling experiments as listed in Table 1. S1 was the virgin membranes without fouling and S2–S6 were inorganic, HPAM, HPAM-inorganic, oil, oil–HPAM-inorganic fouled membranes, respectively.Moreover, the membrane resistances of the AEMs fouled by inorganic solution changed slightly, while the AEMs in the HPAM and HPAM-inorganic system almost doubled the values of the virgin AEM, which was consistent with the analysis of the desalination performance. The results of SEM analysis (see Fig. S4†) also indicated that the membranes were obviously fouled by HPAM and HPAM-inorganic solutions compared with the virgin AEM. The oil–HPAM-inorganic fouling was the most serious as shown in Fig. S4d,† which was in accordance with the measurements of membrane resistance and zeta potentials of membrane surface (see Table S2†). Therefore, the fouling of HPAM-inorganic on the AEM was aggravated by the addition of oil emulsion. The oil emulsion has a strong electrostatic interaction with the AEM owing to its strong electronegativity (see Fig. S2†). In addition, the surfactant SDBS was added in the oil emulsion preparation, which could foul the AEM,44 and some of the SDBS molecules would enter the AEM. As a result, the membrane resistance significantly increased. The membrane resistance of oil emulsion-fouled AEM (M5) was larger than that of HPAM-fouled AEM (M3), indicating that the AEMs were more easily fouled by oil emulsion than HPAM. It can be explained by the results of zeta potentials that oil emulsion was more electronegative than HPAM and the electrostatic attraction was stronger between oil emulsion and the AEMs. Nevertheless, the membrane resistance of the AEM in the oil emulsion–HPAM-inorganic system was almost the same as that in the individual oil emulsion composition, which might be due to the competition between the HPAM and the oil emulsion. We carried the experiments of adsorbing HPAM and oil for further verification. The HPAM molecule and oil emulsion were both electronegative and they would contend for the functional groups on the AEMs. As shown in Fig. S3,† the amount of oil emulsion adsorbing on the AEM decreased after the addition of HPAM and the adsorption quantity of HPAM also decreased slightly when mixed with oil.
The membrane resistances of all the CEMs had no remarkable increase compared to that of the AEMs. The membrane resistances of both the separate inorganic and oil emulsion systems increased less than 15% compared to that of the basic virgin CEM, but after combining with HPAM, the values increased somewhat. That is to say, the CEMs were more resistant to the negatively charged foulants, indicating that electrostatic interaction dominated in the fouling process.
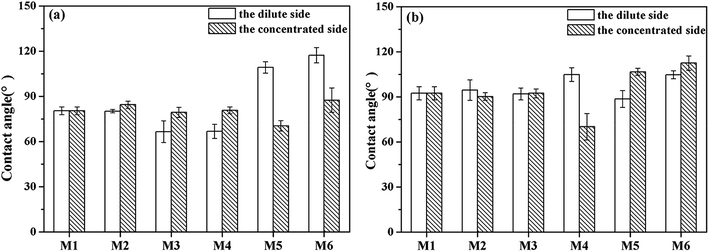
Fig. 4 showed the contact angles of different sides of the fouled membranes. The dilute side of the membrane refers to the side facing the dilute compartments (chamber 4). Similarly, the concentrated side refers to the side facing the concentrated compartment (chamber 3). As seen in Fig. 4a, the contact angle of the dilute side of the AEM decreased after HPAM fouling compared with that of the virgin and inorganic component-fouled AEMs. As the HPAM is electronegative, it would move towards the dilute side of the AEMs under the extra electric field. In addition, the HPAM molecule was larger than the membrane pore. Therefore, the HPAM accumulated and formed a gel layer on the dilute side of the AEM. Moreover, the HPAM molecules were rich in hydrophilic groups, such as carboxyl groups, with smaller contact angles than that of the AEMs, which led to the hydrophilization of the HPAM-fouled AEMs.45
Similarly, negatively charged emulsified oil droplets formed a dense fouling layer on the dilute side of the AEM, but the contact angle of this side increased after the fouling because the oil emulsion was hydrophobic. The contact angle on the dilute side of the AEMs in the oil emulsion–HPAM-inorganic solution significantly increased compared to that on the virgin AEM, but it decreased in the HPAM-inorganic solution, demonstrating that the oil emulsion fouled the dilute side of the AEM. As shown in Fig. 4b, the oil emulsion–HPAM-inorganic composite was basically consistent with the HPAM-inorganic composite in terms of the contact angles on the dilute side of the CEMs. However, the contact angle of the former was much higher than that on the concentrated side of the CEM, which indicated that the dilute side was mainly fouled by inorganic component and oil emulsion dominated in fouling the concentrate sides of the CEM.
3.2 The effect of different cleaning methods
The polymer flooding wastewater has complex components and the fouling on IEMs is complicated. A set of cleaning experiments were firstly carried out to find out the suitable cleaning method aimed at the appointed foulant. Then the most efficient cleaning protocol was explored for oil–HPAM-inorganic fouled membranes. The desalinate rate, area resistance and contact angle of the cleaned were measured to assess the cleaning effects.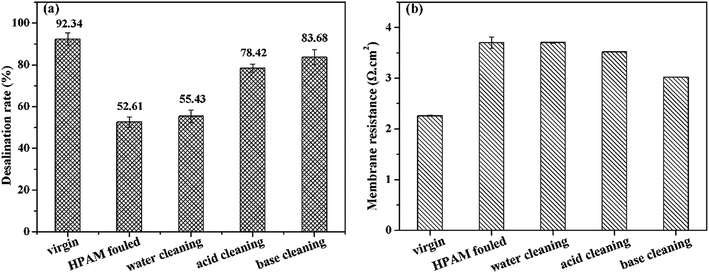 | ||
| Fig. 5 Recovery of (a) desalination performance of ED stack and (b) membrane resistances of the cleaned AEMs fouled by HPAM. | ||
The cleaning effect of SDBS on the oil emulsion fouled membranes was shown in Fig. 6. The SDBS cleaning displayed excellent cleaning performances on the oil emulsion fouled IEMs with an increase of desalination rate of 33.63%. The membrane resistance of the fouled AEM decreased obviously after cleaning and the resistance of CEM restored to the original value, which was in accordance with the result of desalination performance that the SDBS could efficiently clean the oil fouled membranes.
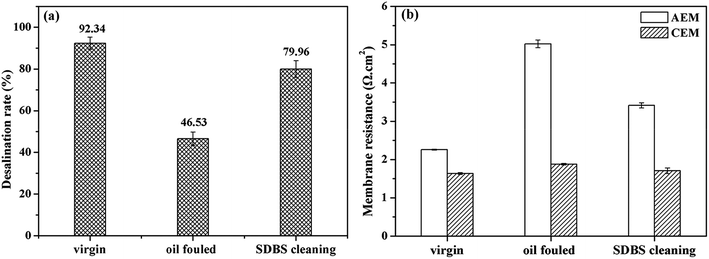 | ||
| Fig. 6 Recovery of (a) desalination performance of ED stack and (b) membrane resistances of the cleaned IEMs fouled by oil emulsion. | ||
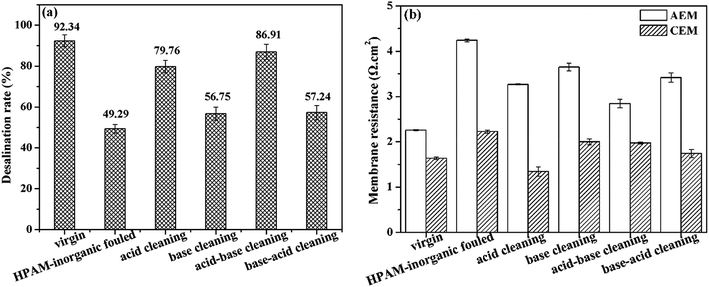
Fig. 7 presented the results of cleaning of HPAM-inorganic fouled IEMs. We have known that both acid and base cleaning presented effects on restoring the performance of the HPAM fouled IEMs. In addition, acid solution can remove the inorganic scale. As for the HPAM-inorganic fouled membranes, the inorganic scale and some HPAM could be cleaned firstly by HCl, and the followed base cleaning removed the remained HPAM. Therefore, the acid–base cleaned membranes showed the best recovery of desalination performance and membrane resistance (see Fig. S5e†).
The decrease in conductivity of the dilute solutions and the desalination rates at 60 min for the cleaned IEMs were presented in Fig. 8.
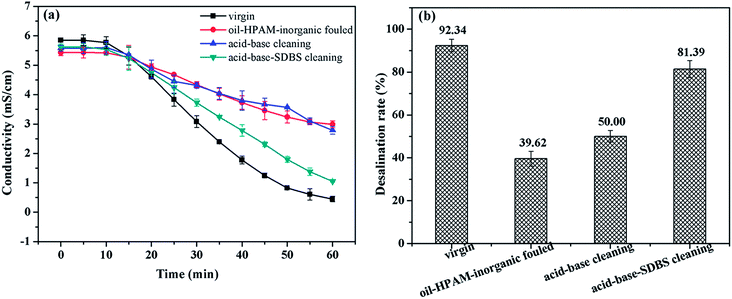 | ||
| Fig. 8 Recovery of the desalination performance of ED after cleaning the oil emulsion–HPAM-inorganic fouling: (a) time dependence of the conductivity in dilute solutions; (b) desalination rate of ED. | ||
As we can see in Fig. 8, the virgin IEMs exhibited the highest desalination capacity with the lowest dilute solution conductivity and highest desalination rate. The oil–HPAM-inorganic-fouled IEMs exhibited the worst desalination performance. The desalination performance recovered to 81.39% from 39.62% in the fouled IEMs after the acid–base-SDBS cleaning (see Fig. S5f†). However, the acid–base cleaning method only had a slight effect on the recovery of the desalination performance with a poor desalination rate of 50.00%.
As shown in Fig. 9, the membrane resistances of the AEMs sharply increased by 124.57% because of the oil–HPAM-inorganic fouling. In addition, after the acid–base-SDBS cleaning, the value decreased to 3.82 Ω cm2, which was only 64.65% higher than that of the virgin AEMs. However, the value only decreased 0.37 Ω cm2 after the acid–base cleaning compared with that of the fouled AEMs and was still 108.62% higher than that of the virgin ones. The results were consistent with the desalination performances and indicated that the acid–base cleaning could only eliminate the HPAM and inorganic fouling layers. The subsequent SDBS cleaning played an important role in removing the dominant oil emulsion layer and recovering the membrane properties.
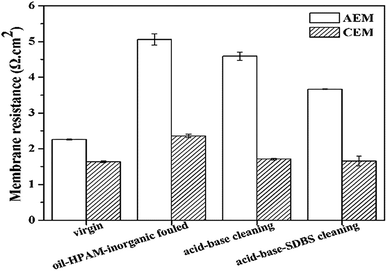 | ||
| Fig. 9 Recovery of the membrane resistances of the IEMs after cleaning the oil emulsion–HPAM-inorganic fouling. | ||
However, for the CEMs, the membrane resistances of the fouled membranes were only 43.29% higher than that of the virgin ones. This indicated that the CEMs were not seriously fouled by the oil–HPAM-inorganic complex. Moreover, the membrane resistance almost recovered to that of the virgin level after the acid–base and acid–base-SDBS cleaning. Therefore, it was concluded that the oil–HPAM-inorganic complex had little effect on the CEMs.
The results of the contact angle measurements were presented in Fig. 10. For the AEMs, the contact angles of the dilute side increased nearly 40°, while those of the concentrate side increased by 10° compared to that of the virgin AEMs (see Fig. 8a and b). In addition, after the chemical cleaning, the contact angles of the concentrated side almost returned to that of the virgin level. However, only the acid–base-SDBS cleaning resulted in the same recovery effect, and the acid–base cleaning had limited effects for the recovery of the contact angle.
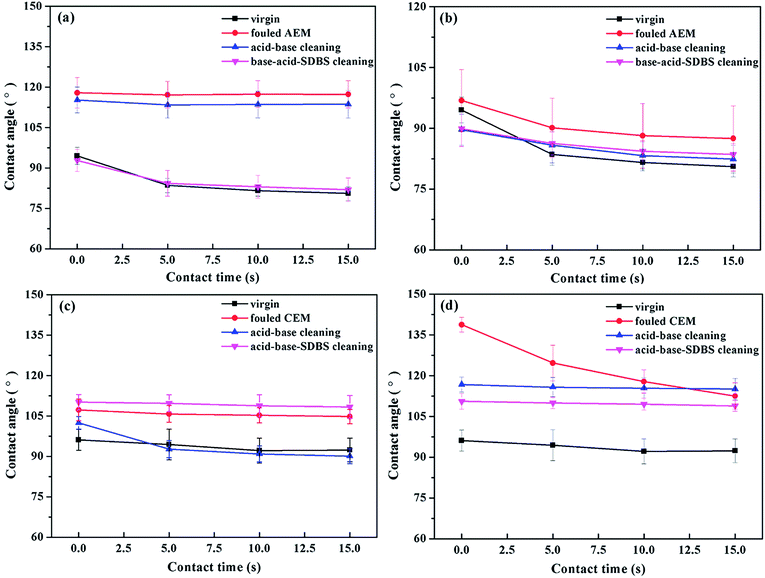 | ||
| Fig. 10 Contact angles of the oil emulsion–HPAM-inorganic-fouled and cleaned IEMs: (a) AEMs, dilute side, (b) AEMs, concentrated side, (c) CEMs, dilute side and (d) CEMs, concentrated side. | ||
We previously knew that the oil–HPAM-inorganic complex would severely foul the dilute side of the AEMs and that the oil emulsion dominated the fouling procedure. As a result, the contact angle of the dilute side obviously recovered after the acid–base-SDBS cleaning, but limited improvement was observed after the acid–base cleaning. In contrast, the concentrated side was not badly fouled by the oil emulsion, and the contact angle was basically recovered after the acid–base cleaning.
For the CEMs, the contact angles on both sides of the fouled CEMs increased significantly, as shown in Fig. 10c and d. As shown in Fig. 4b, the dilute sides of the CEMs were mostly fouled by the HPAM-inorganic ingredient, so the acid–base cleaning could effectively eliminate the gel layer and the inorganic layer. Hence, the contact angle almost recovered to that of the virgin level after the acid–base cleaning. However, with the subsequent SDBS cleaning, the sulfonic groups of the SDBS molecules and the immobilization groups of the CEM formed an affinity effect, and the long chains of the alkyl groups of the SDBS resulted in a larger contact angle on the dilute side.
Similarly, as shown in Fig. 4b, the oil emulsion component was dominant during the fouling process of the CEMs on the concentrated side. Meanwhile, because of the electrostatic repulsion between the oil droplets and the CEM, the oil emulsion fouling layer was relatively loose and randomly distributed, which led to unstable contact angles on the concentrated side. In addition, the values in Fig. 10d also showed that the fouling layer was effectively removed by the acid–base-SDBS cleaning. However, the contact angle was still larger than that of virgin CEM because of the affinity between the sulfonic acid groups of SDBS and the CEM.
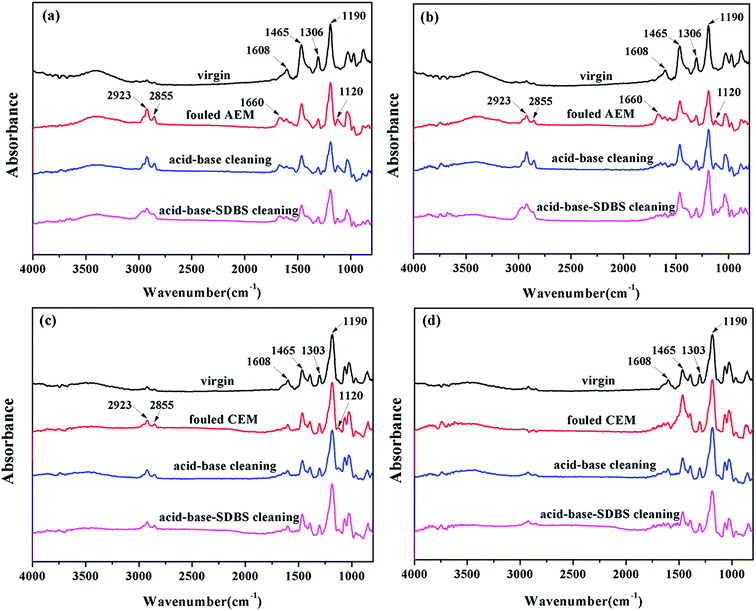 | ||
| Fig. 11 IR spectra of the IEMs after cleaning the oil emulsion–HPAM-inorganic fouling: (a) AEMs, dilute side, (b) AEMs, concentrated side, (c) CEMs, dilute side and (d) CEMs, concentrated side. | ||
As shown in Fig. 11a, all the spectral lines had absorption peaks at 1608 cm−1, 1465 cm−1, 1306 cm−1 and 1190 cm−1, corresponding to the C–C stretching vibration of the aromatic ring, the asymmetric bending vibration of the C–H bond in CH2, the out-of-plane deformation swing of the C–H bond in CH2 and C–O–C stretching vibration of the ethers, respectively, which were from the matrix of the polyphenylene ether IEMs.
Compared to that of the virgin membranes, new group frequency absorption peaks appeared at multiple positions for both the dilute and concentrated sides of the fouled membranes. Characteristic peaks for alkanes from crude oil, such as the C–H asymmetric stretching vibration at 2923 cm−1 and symmetrical stretching vibration at 2855 cm−1, were observed. The asymmetric stretching vibration at 1120 cm−1 of the S![[double bond, length as m-dash]](https://www.rsc.org/images/entities/char_e001.gif) O bond in the sulfonic acid group and the stretching vibration at 1660 cm−1 of the C
O bond in the sulfonic acid group and the stretching vibration at 1660 cm−1 of the C![[double bond, length as m-dash]](https://www.rsc.org/images/entities/char_e001.gif) O bond in the amide group indicated the existence of SDBS and HPAM molecules. The results demonstrated that both sides of the AEM were subjected to oil emulsion and HPAM fouling. The difference was the absorption peak at 1660 cm−1 on the concentrated side disappeared after the chemical cleaning, and the corresponding peak still remained on the dilute side, which illustrated that the dilute side was more severely fouled by the organic component and more difficult to clean by chemical cleaning.
O bond in the amide group indicated the existence of SDBS and HPAM molecules. The results demonstrated that both sides of the AEM were subjected to oil emulsion and HPAM fouling. The difference was the absorption peak at 1660 cm−1 on the concentrated side disappeared after the chemical cleaning, and the corresponding peak still remained on the dilute side, which illustrated that the dilute side was more severely fouled by the organic component and more difficult to clean by chemical cleaning.
Similarly, as shown in Fig. 11c, a new peak did not appear on the dilute side of the oil–HPAM-inorganic-fouled CEMs, and no apparent changes were observed after the chemical cleaning. However, as shown in Fig. 11d, absorption peaks at 2923 cm−1 and 2855 cm−1, corresponding to the C–H stretching vibrations from crude oil, and 1120 cm−1, corresponding to the S![[double bond, length as m-dash]](https://www.rsc.org/images/entities/char_e001.gif) O asymmetric stretching vibration, indicated that oil emulsion fouled the concentrated side of the CEMs. Meanwhile, after the chemical cleaning, the oil emulsion fouling was not completely removed because the new absorption peaks were still present.
O asymmetric stretching vibration, indicated that oil emulsion fouled the concentrated side of the CEMs. Meanwhile, after the chemical cleaning, the oil emulsion fouling was not completely removed because the new absorption peaks were still present.
No obvious difference was observed in the IEMs after the acid–base-SDBS cleaning compared to those after the acid–base cleaning. This was probably because the oil emulsion fouling was not completely removed.
3.3 Fouling route and cleaning theory
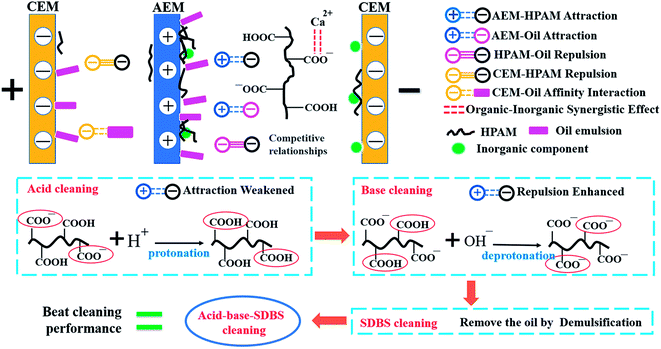
According to all the experimental results, scheme of the fouling route and cleaning mechanism was presented in Fig. 12. The AEMs were mainly fouled by HPAM and oil on the dilute side due to electrostatic attraction. Meanwhile, the inorganic component could synergize the fouling of HAPM because Ca2+ can form coordination bond by means of complexation reaction with the HPAM molecules. The CEMs were more susceptible to inorganic scales. Oil emulsion also fouled the CEMs on the concentrated side. HCl can expedite the protonation of HPAM molecules, i.e., changing more carboxylates into carboxyl groups and reducing the electronegativity of HPAM, which abates the electrostatic interactions between HPAM and the IEMs. Consequently, a portion of the contaminated layer would be eliminated by the acid cleaning. On the other hand, sodium hydroxide can effectively disintegrate the gel layer by reacting with the carboxyl and amide groups of HPAM. Simultaneously, an increase in the electronegativity under alkaline conditions aggravated the intermolecular repulsion between the HPAM molecules, which caused the loose fouling layer to detach from the membrane surface. As a consequence, the acid–base cleaning can eliminate the gel layer and the inorganic fouling layer. However, it had little effect on the oil emulsion layer, which led to the poor recovery of the desalination rate.As shown in Fig. 2, the oil emulsion–fouled IEMs exhibited the lowest desalination compared with that of the inorganic-fouled, HPAM-fouled and HPAM-inorganic-fouled IEMs. The oil emulsion layer was dominant in the oil–HPAM-inorganic-fouled IEMs, which agreed with the poor cleaning effect of the acid–base cleaning. SDBS, an anionic surfactant with excellent demulsification abilities, which can effectively remove the oil emulsion layer, was subsequently adopted to recover the oil–HPAM-inorganic-fouled IEMs after the acid–base cleaning. As a result, the desalination performance of the fouled IEMs significantly recovered.
4 Conclusions
In this study, the fouling of IEMs in flooding wastewater treatments and the effects of different chemical cleaning methods were investigated. The desalination rate, membrane resistance, contact angles and ATR-FTIR were used for the characterization of the fouled and cleaned IEMs.Fouling experiments indicated that inorganic components could combine with HPAM to foul the IEMs, which was demonstrated by lower desalination rates and higher membrane resistances compared with that of the IEMs with inorganic fouling and HPAM fouling. Moreover, the oil emulsion intensified the HPAM-inorganic fouling as the IEMs fouled by the oil emulsion–HPAM-inorganic components showed the lowest desalination performance and the oil emulsion prevailed in fouling the dilute side of the AEM. The inorganic component dominated in fouling the dilute side of the CEM while the concentrated side mostly suffered oil fouling.
Cleaning experiments were conducted to restore the fouled membranes. The desalination rate and other indicators of HPAM fouled IEMs were significantly recovered after acid cleaning and base cleaning. Membranes fouled by the HPAM-inorganic component and oil emulsions were effectively cleaned by the acid–base and SDBS cleaning, respectively. The acid–base-SDBS cleaning method achieved an excellent cleaning effect on the oil–HPAM-inorganic-fouled IEMs with an increase of 36.45% in the desalination performance. The results of ATR-FTIR spectra indicated that the dilute side of the AEM was more severely fouled by the organic component (oil emulsion and/or HPAM) than the concentrated side and difficult to cleaning by chemical cleaning.
Conflicts of interest
There are no conflicts to declare.Acknowledgements
This work was financially supported by the National Science Foundation of China (No. 51578390) and the National Major Project of the Science & Technology Ministry of China (No. 2017ZX07101-002-04).References
- V. Alvarado and E. Manrique, Energies, 2010, 3, 1529 CrossRef.
- S. Thomas, Oil Gas Sci. Technol., 2008, 63, 9 CrossRef.
- R. Zhang, W. Shi, S. Yu, W. Wang, Z. Zhang, B. Zhang, L. Li and X. Bao, Desalination, 2015, 373, 27–37 CrossRef.
- Y. Wang, F. Lu, Y. Li, T. Wu, D. Sun, G. Zhang, X. Huang and G. Wang, Colloids Surf., A, 2012, 410, 125 CrossRef.
- G. Jing, X. Wang and C. Han, Desalination, 2008, 220, 386 CrossRef.
- X. Wang, S. Chen, W. Dong, Z. Wang, L. Yang, X. Xi, Q. Zhang and L. Shi, Sep. Sci. Technol., 2012, 47, 1617 CrossRef.
- B. van der Bruggen, C. Vandecasteele, T. van Gestel, W. Doyen and R. Leysen, Environ. Prog. Sustainable Energy, 2010, 22, 46 Search PubMed.
- J. Xu, C. Ma, B. Cao, J. Bao, Y. Sun, W. Shi and S. Yu, Process Saf. Environ. Prot., 2016, 103, 564 CrossRef.
- K. Kimura, N. Yamato, H. Yamamura and Y. Watanabe, Environ. Sci. Technol., 2005, 39, 6293 CrossRef PubMed.
- P. Janknecht, A. D. Lopes and A. M. Mendes, Environ. Sci. Technol., 2004, 38, 4878 CrossRef PubMed.
- J. Marchese, N. A. Ochoa, C. Pagliero and C. Almandoz, Environ. Sci. Technol., 2000, 34, 2990 CrossRef.
- X. Zuo, L. Wang, J. He, Z. Li and S. Yu, Desalination, 2014, 347, 43 CrossRef.
- X. Qiao, Z. Zhang, J. Yu and X. Ye, Desalination, 2008, 225, 113 CrossRef.
- T. Wang, S. Yu and L. Hou, Desalination, 2017, 404, 50 CrossRef.
- L. Han, S. Galier and H. Roux-de Balmann, Desalination, 2015, 373, 38 CrossRef.
- C. Huang, T. Xu, Y. Zhang, Y. Xue and G. Chen, J. Membr. Sci., 2007, 288, 1 CrossRef.
- M. Fidaleo and M. Moresi, Adv. Food Nutr. Res., 2006, 51, 265 Search PubMed.
- C. Abels, F. Carstensen and M. Wessling, J. Membr. Sci., 2013, 444, 285 CrossRef.
- Y. Zheng, X. Gao, X. Wang, Z. Li, Y. Wang and C. Gao, RSC Adv., 2015, 5, 19807 RSC.
- Y. Zhao, K. Tang, Q. Liu, B. van der Bruggen, A. S. Diaz, J. Pan, C. Gao and J. N. Shen, RSC Adv., 2016, 6, 16548 RSC.
- J. S. Park, H. J. Lee, S. J. Choi, K. E. Geckeler, J. Cho and S. H. Moon, J. Colloid Interface Sci., 2003, 259, 293 CrossRef PubMed.
- M. Vanoppen, A. F. A. M. Bakelants, D. Gaublomme, K. V. K. M. Schoutteten, J. Vanden Bussche, L. Vanhaecke and A. R. D. Verliefde, Environ. Sci. Technol., 2015, 49, 489 CrossRef PubMed.
- N. Tanaka, M. Nagase and M. Higa, Desalin. Water Treat., 2010, 17, 248 CrossRef.
- H. Ren, Q. Wang, X. Wu, P. Yang and W. Cong, J. Chem. Technol. Biotechnol., 2011, 86, 1469 CrossRef.
- V. Lindstrand, A. S. Jönsson and G. Sundström, Desalination, 2000, 130, 73 CrossRef.
- V. Lindstrand, G. Sundström and A. S. Jönsson, Desalination, 2000, 128, 91 CrossRef.
- Z. Zhao, S. Shi, H. Cao and Y. Li, J. Membr. Sci., 2017, 530, 220 CrossRef.
- N. Tanaka, M. Nagase and M. Higa, Desalination, 2012, 296, 81 CrossRef.
- B. Ruiz, P. Sistat, P. Huguet, G. Pourcelly, M. Araya-Farias and L. Bazinet, J. Membr. Sci., 2007, 287, 41 CrossRef.
- M. Asraf-Snir, J. Gilron and Y. Oren, J. Membr. Sci., 2016, 520, 176 CrossRef.
- Q. Wang, P. Yang and W. Cong, Sep. Purif. Technol., 2011, 79, 103 CrossRef.
- S. Bao, Y. Zhang, T. Liu, J. Huang and T. Chen, Desalination, 2010, 256, 94 CrossRef.
- M. Asraf-Snir, J. Gilron and Y. Oren, J. Membr. Sci., 2014, 455, 384 CrossRef.
- W. Wang, R. Fu, Z. Liu and H. Wang, Desalination, 2017, 417, 1 CrossRef.
- D. I. Chang, K. H. Choo, J. H. Jung, L. Jiang, J. H. Ahn, M. Y. Nam, E. S. Kim and S. H. Jeong, Desalination, 2009, 236, 152 CrossRef.
- N. Tanaka, M. Nagase and M. Higa, J. Membr. Sci., 2011, 384, 27 CrossRef.
- S. Mikhaylin and L. Bazinet, Adv. Colloid Interface Sci., 2016, 229, 34 CrossRef PubMed.
- W. Garcia-Vasquez, R. Ghalloussi, L. Dammak, C. Larchet, V. Nikonenko and D. Grande, J. Membr. Sci., 2014, 452, 104 CrossRef.
- W. Garcia-Vasquez, L. Dammak, C. Larchet, V. Nikonenko and D. Grande, J. Membr. Sci., 2016, 507, 12 CrossRef.
- H. Guo, L. Xiao, S. Yu, H. Yang, J. Hun, G. Lui and Y. Tang, Desalination, 2014, 346, 46 CrossRef.
- G. Liu, S. Yu, H. Yang, J. Hu, Y. Zhang, B. He, L. Li and Z. Liu, Environ. Sci. Technol., 2016, 50, 1393 CrossRef PubMed.
- X. Jin, X. Huang and E. M. Hoek, Environ. Sci. Technol., 2009, 43, 3580 CrossRef PubMed.
- P. Sikorski, F. Mo, G. Skjak-Braek and B. T. Stokke, Biomacromolecules, 2007, 8, 2098 CrossRef PubMed.
- H. J. Lee, M. K. Hong, S. D. Han, J. Shim and S. H. Moon, J. Membr. Sci., 2008, 325, 719 CrossRef.
- X. Yi, W. Shi, S. Yu, N. Sun, L. Jin, S. Wang, B. Zhang, C. Ma and L. Sun, Desalination, 2012, 286, 254 CrossRef.
Footnote |
| † Electronic supplementary information (ESI) available. See DOI: 10.1039/c8ra05575k |
| This journal is © The Royal Society of Chemistry 2018 |

