
 Open Access Article
 This Open Access Article is licensed under a Creative Commons Attribution-Non Commercial 3.0 Unported Licence
Biofabricated BiOI with enhanced photocatalytic activity under visible light irradiation†
Seema Garg*a,
Mohit Yadav ab,
Amrish Chandrac,
Sameer Saprad,
Soniya Gahlawatd,
Pravin P. Ingoled,
Zsolt Papef and
Klara Hernadig
ab,
Amrish Chandrac,
Sameer Saprad,
Soniya Gahlawatd,
Pravin P. Ingoled,
Zsolt Papef and
Klara Hernadig
aDepartment of Chemistry, Amity Institute of Applied Sciences, Amity University, Sector-125, Noida 201313, Uttar Pradesh, India. E-mail: sgarg2@amity.edu
bAmity Institute of Nanotechnology, Amity University, Sector-125, Noida 201313, Uttar Pradesh, India
cAmity Institute of Pharmacy, Amity University, Sector-125, Noida 201313, Uttar Pradesh, India
dDepartment of Chemistry, Indian Institute of Technology, Delhi, Hauz Khas, New Delhi 110016, India
eNanostructured Materials and Bio-Nano-Interfaces Center, Interdisciplinary Research Institute on Bio-Nano-Sciences, Babes,-Bolyai University, Cluj-Napoca 400271, Romania
fInstitute of Environmental Science and Technology, University of Szeged, Tisza Lajos krt. 103, H-6720 Szeged, Hungary
gDepartment of Applied and Environmental Chemistry, University of Szeged, Rerrich tér 1, H-6720 Szeged, Hungary
First published on 14th August 2018
Abstract
In the recent past, there has been a large-scale utilization of plant extracts for the synthesis of various photocatalysts. The biofabrication technology eliminates the usage of harmful chemicals and serves as an eco-friendly approach for environmental remediation. Herein, a comparative analysis between bismuth oxyiodide synthesized via Azadirachta indica (neem) leaf extract (BiOI-G) and without leaf extract (BiOI-C) has been envisaged. The BiOI-G and BiOI-C samples were characterized by spectral and microscopic techniques, which revealed that the Azadirachta indica assisted BiOI-G attained enhanced features over BiOI-C such as narrower band gap, large surface area, porosity, increased absorption range of visible light and effectual splitting of the photogenerated e−–h+ pairs. Benefiting from these enhanced features, BiOI-G degraded methyl orange (MO), rhodamine B (RhB), and benzotriazole (BT) at a significantly higher rate in comparison to BiOI-C. The degradation rate of MO, RhB and BT by BiOI-G was observed to be 1.3, 1.25 and 1.29 times higher in comparison to BiOI-C. Moreover, BiOI-G displayed high stability upto five cycles of the photocatalytic activity, which endow its effectiveness as a highly-efficient green photocatalyst.
Introduction
Synthesis of nanostructures via green routes can provide many solutions to ecological issues in the field of water purification and solar energy conversion. The use of plant leaf extract offers an economical, productive and non-toxic approach, which allows a well-organized and regulated preparation of nanostructures of well-defined morphology.1,2 Until now, the use of different leaf extracts such as P. trifoliate fruit extract,3 Ocimum sanctum L (tulsi),4 Ocimum tenuiflorum (black tulsi)5 and Ficus benghalensis (banyan tree)6 etc. has been broadly explored for the biofabrication of various nanostructures. Likewise, Azadirachta indica (neem)7–9 is widely known to possess reducing and stabilizing properties, as it comprises biologically active compounds i.e. phytochemicals. The broad amount of phytochemicals such as flavones, terpenoids, nimbin, quercetin, aldehydes, organic acids, ketones, and amides possess anti-oxidant and stabilizing properties, which are accountable for the regulation of size and providing stability to the nanostructures.10–12In recent times, BiOI has intrigued researchers immensely owing to its unusual character and ability to perform under visible light. It has layered tetragonal matalockite geometry, characterized by [Bi2O2]2+ slabs interleaved by double slabs of iodine atoms, determined its narrow band gap (1.8 eV).13–16 To advance its photocatalytic performance, BiOI has been functionalized with various material like TiO2,17,18 BiVO4,19 BiPO4,20 WO3,21,22 Bi2S3,23 carbon quantum dots,24 Au,25 Ag26 and CdS27 etc. However, these reports are mainly concentrated on the modulation and tuning of the optical and structural properties of BiOI, and some of these methods are not ecofriendly as their synthesis route involves the application of harmful solvents and stabilizers such as ethylene glycol,28 ethanol29 and CTAB30 etc. The consumption of such chemical solvents can even result in residual toxicity or may inflict secondary pollution.
Therefore, for the first time in our approach, BiOI has been synthesized by simple green route without any harmful chemical solvents. Alternatively, Azadirachta indica leaf extract was utilized to provide stabilization and controlling the size of the material. The as-prepared BiOI-G with the addition of leaf extract attained advantageous features such as higher surface area, porosity, adequate active interaction sites and efficacious partition of photogenerated charge carriers. All the features boosted the photocatalytic activity of BiOI-G towards RhB, MO and BT in comparison to BiOI-C. Moreover, this research methodology opens a pioneering design to progress our understanding of how plant extracts can be practically applied in the field of photocatalysis.
Experimental
Materials
All the chemicals and reagents such as bismuth nitrate pentahydrate [Bi(NO3)3·5H2O], potassium iodide (KI), methyl orange, rhodamine B and benzotriazole were of analytical grade and used without any further purification.Synthesis of plant extract
The Azadirachta indica (neem leaves) were collected locally within the Amity University campus, Noida, India. The leaves were washed with double distilled water to wipe out debris and other impurities. Then, the leaves were allowed to dry at room temperature and the plant extract was prepared using distilled water and utilized for experimental purpose.Synthesis of BiOI-G and BiOI-C
BiOI-G was biofabricated by minor modifications in the hydrolysis route i.e. inclusion of aqueous neem leaf extract. Typically, 100 mL of 0.05 M Bi(NO3)3·5H2O aqueous solution was added dropwise to 8 mL plant leaf extract with constant stirring. Then, the obtained solution was added dropwise to a 0.05 M KI solution under continuous stirring for 1 hour at room temperature, and it was kept in an oven for 1 hour at 60 °C. The resulting product was separated via centrifugation followed by washing with ethanol and double distilled water thrice to eliminate the impurities, and finally, it was dried in an oven at 60 °C. BiOI-C was synthesized with same methodology; however, the usage of plant extract was avoided.Characterizations
The X-ray diffraction patterns were measured on a Bruker D2-Phaser Diffractometer with a Cu Kα radiation source (λ = 1.5418 Å). The particle size, morphology and elemental analysis of BiOI-G and BiOI-C were inspected by Zeiss-Sigma VP field emission scanning electron microscope, FEI Technai G2 X-Twin TEM (200 kV) and EDS (Bruker). Specific surface areas were determined by BET method for which nitrogen adsorption–desorption studies were analyzed at 77 K using a Quanta Chrome NOVA 1000. The functional groups were recognized by FTIR (Agilent Cary 630). The optical properties were evaluated by both UV-Vis diffuse reflectance spectra (Shimadzu UV-1800) and photoluminescence spectra (Shimadzu RF-5301).Photocatalytic activity measurements
The photocatalytic activity of the as-prepared BiOI-C and BiOI-G samples was evaluated for the disintegration of MO, RhB and BT. Experimental details were as follows: four compact fluorescent lamps 28 W each were utilized as visible light source for the photocatalyst and 50 g L−1 NaNO2 solution was utilized as a UV cutoff filter. Initially, 50 mg of BiOI-G and BiOI-C were added to 100 mL of 20 mg L−1 MO solution (or 20 mg L−1 RhB or 10 mg L−1 BT) in a 250 mL beaker separately and the pH of the initial solution was about 7. Primarily, the suspension was stirred on a magnetic stirrer in dark for 60 minutes to ensure appropriate adsorption–desorption equilibrium. Then, the suspension was subjected to visible light irradiation under constant stirring. After certain time intervals, 2 mL of the suspension was withdrawn and the photocatalyst particles were separated through centrifugation at 10![[thin space (1/6-em)]](https://www.rsc.org/images/entities/char_2009.gif) 000 rpm. The absorbance of the supernatant was measured by UV-Vis spectrophotometer at 465 nm for MO and at 550 nm for RhB respectively. The photocatalytic concentration was varied from 50–125 mg/100 mL, respectively. The photogenerated intermediates during the disintegration of BT were separated and measured by High performance liquid chromatography (HPLC, Shimadzu). The enable C18G (250 × 4.6 mm i.d., 5 μm) reversed phase column was utilized and a mixture of water and ethanol (40:60 v/v) was used as a mobile phase and the flow rate was kept constant at 1.0 mL min−1.
000 rpm. The absorbance of the supernatant was measured by UV-Vis spectrophotometer at 465 nm for MO and at 550 nm for RhB respectively. The photocatalytic concentration was varied from 50–125 mg/100 mL, respectively. The photogenerated intermediates during the disintegration of BT were separated and measured by High performance liquid chromatography (HPLC, Shimadzu). The enable C18G (250 × 4.6 mm i.d., 5 μm) reversed phase column was utilized and a mixture of water and ethanol (40:60 v/v) was used as a mobile phase and the flow rate was kept constant at 1.0 mL min−1.
Radical trapping study
At the time of photocatalytic reaction, holes (h+), hydroxy radicals (˙OH) and superoxide radicals (˙O2−) were produced and were evaluated by adding 1 mM sodium oxalate (a scavenger of h+), 1 mM isopropanol (a scavenger of ˙OH) and 1 mM benzoquinone (a scavenger of ˙O2−). The same methodology mentioned above was implemented in this activity.Electrochemical studies
The electrochemical experiments were implemented on a CHI 608E electrochemical system using a standard three electrode system i.e. a working electrode, a saturated Hg/HgO reference electrode and a counter electrode (platinum wire). The working electrode was prepared by drop-casting method: briefly, 2 mg of material was ultrasonically dispersed in 100 μL ethanol and 10 μL NAFION, of which 10 μL was then drop-casted on a piece of ITO slice with a fixed area of 1 cm2. The properties were evaluated with a 150 W Xe arc lamp and 0.1 M KOH (pH 12.8) as an electrolyte. The electrochemical impedance spectroscopy (EIS) was recorded at 0 V versus Hg/HgO from 1 MHz to 10 MHz, respectively.Results and discussion
Characterization of BiOI-C & BiOI-G photocatalysts
XRD was employed to identify the phase composition and crystal structure of BiOI-C and BiOI-G samples. As shown in Fig. 1(a), the diffraction patterns of both the samples are quite similar and all the identified peaks corresponding to (002), (102), (110), (112), (004), (200), (114) and (212) planes are in agreement with JCPDS card no. 73-2062 (ref. 31) and can be indexed to the tetragonal phase of BiOI. Interestingly, with the incorporation of Azadirachta indica leaf extract in the host matrix of BiOI, the overall intensity of the XRD peaks decreased, suggesting the degradation of crystallinity for BiOI-G sample. The possible reason for the decrease in crystallinity could be the generation of crystals defects in BiOI-G lattice, which resulted in the charge imbalance and changed stoichiometry of the sample.9,32 Furthermore, in the XRD spectrum of BiOI-G full width at half maximum (FWHM) seems to be widened, indicating a subsequent decrease in the crystallite size of BiOI-G in comparison to BiOI-C. The average crystallite sizes of BiOI-G and BiOI-C were calculated using Debye Scherer's equation (ESI, Section S1†) and they were determined to be 4.7 nm and 12.5 nm, respectively. Moreover, no extra peaks appeared in the XRD pattern of BiOI-G, suggesting that the Azadirachta indica leaf extract was uniformly incorporated in the BiOI-G matrix.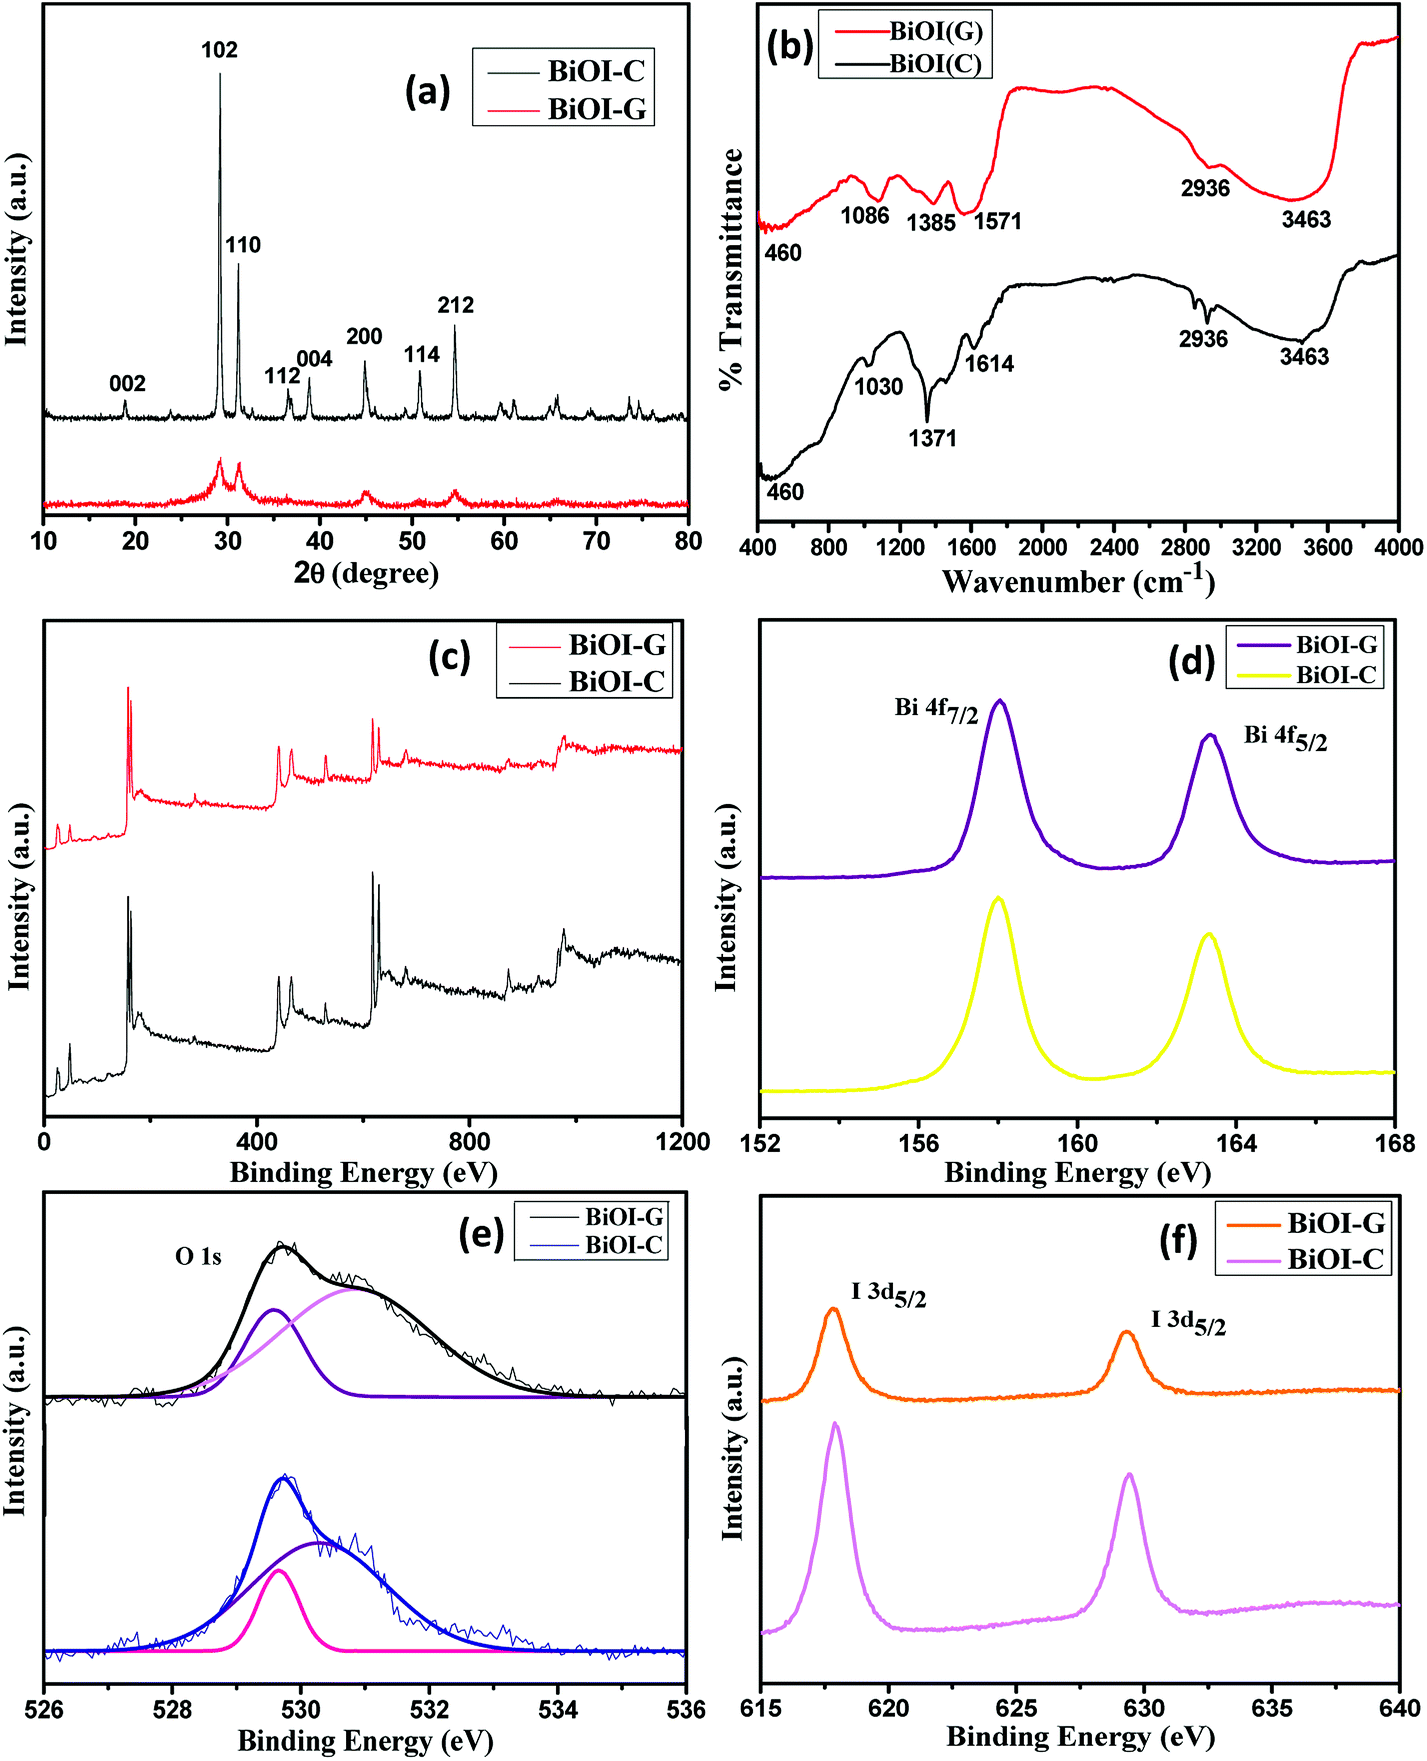 | ||
| Fig. 1 (a) XRD patterns, (b) FTIR spectra, XPS spectra (c) survey of the samples, (d) Bi 4f, (e) O 1s and I 3d, (f) BiOI-C and BiOI-G. | ||
The XPS spectra of BiOI-G and BiOI-C were carried out to inspect the chemical composition and surface chemical states. As depicted in Fig. 1(c), both BiOI-G and BiOI-C were comprised of Bi, O, and I elements which is consistent with their chemical composition. Fig. 1(d) displays the high-resolution Bi 4f spectra of BiOI-G and BiOI-C, the peaks at 158.62 eV and 163.74 eV were attributed to Bi 4f7/2 and Bi 4f5/2, which are characteristic of the Bi3+ in the BiOI samples.33 For BiOI-C, the O 1s profile was resolved into two identical peaks positioned at 529.6 eV and 530.4 eV, indicating the presence of two individual O species in both the samples. The O 1s peak originated at 529.4 eV was ascribed to crystal lattice O atoms (Bi–O); while the peak occurred at 530.4 eV was credited to the Bi–O bonds in the [Bi2O2] slabs of BiOI. For the BiOI-G the O 1s peak at 530.7 eV shifted slightly, which could possibly be as a result of minor change in the O environment due to the usage of plant extract.34 In the XPS spectrum of I 3d [Fig. 1(f)], the two distinguished peaks at 618.09 eV and 630.12 eV accounts for the binding energies of I 3d5/2 and I 3d3/2, confirming the presence of I− in BiOI-C and BiOI-G.35 Hence, the results established the existence of Bi, I and O elements with their most likely oxidation states in the BiOI-G and BiOI-C structures. The results are consistent with the XRD analysis.
To inspect the surface functional groups existing in the as-prepared BiOI-C and BiOI-G, the FTIR spectra were recorded in the range of 400–4000 cm−1. As presented in Fig. 1(b) the peaks originated at 3463 cm−1 and 460 cm−1 are credited to O–H stretching vibration and Bi–O chemical stretching vibration mode in the crystal tetragonal phase of BiOI respectively.12,36
The morphology of BiOI-C and BiOI-G nanostructures was investigated by field emission scanning electron microscopy. As depicted in Fig. 2(a and b), as-prepared samples possessed nanoplate like structure and the size of the BiOI-C nanoplates seem to be significantly bigger in comparison to those of BiOI-G. Furthermore, the incorporation of Azadirachta indica leaf extract in the BiOI-G matrix has resulted in a web-like structure of the nanoplates and simultaneously high porosity can be observed. It suggests that BiOI-G is more likely to attain larger surface area as compared to BiOI-C, which could facilitate the contact area between the reactants and the BiOI-G surface.
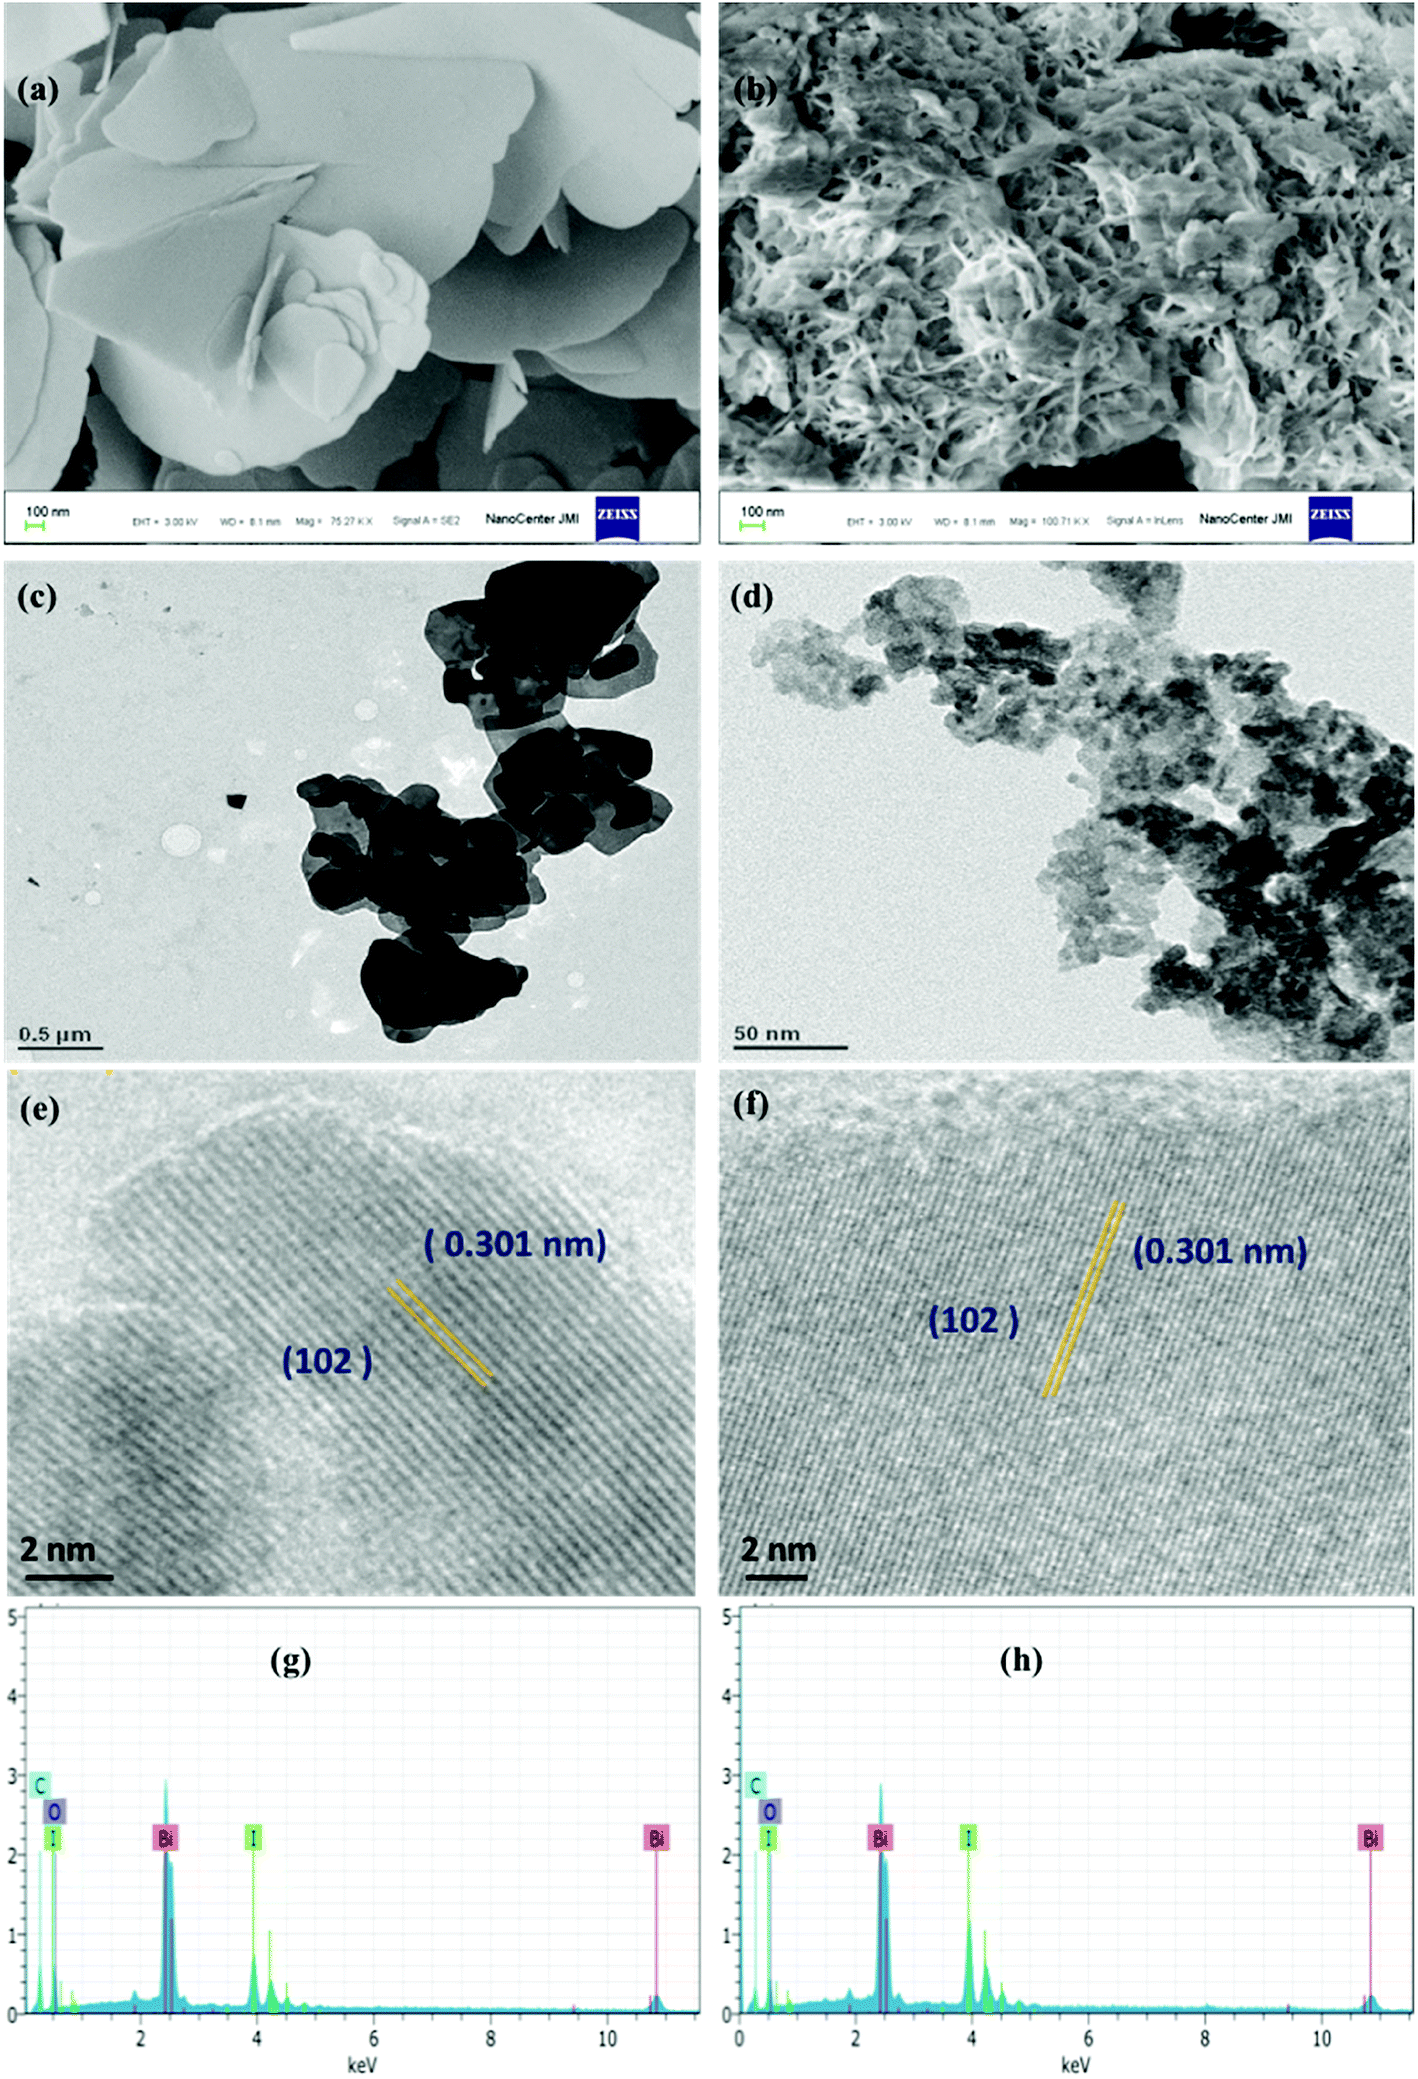 | ||
| Fig. 2 (a and b) FESEM images, (c and d) TEM images, (e and f) HR-TEM images, (g and h) EDS images of BiOI-C (left) and BiOI-G (right). | ||
To explore a better analysis of the BiOI-C and BiOI-G samples, TEM study was carried out as presented in Fig. 2(c and d), respectively. The TEM images further confirm the smaller size of BiOI-G than BiOI-C. To obtain a deeper view, the BiOI-C and BiOI-G samples were further characterized with HR-TEM as presented in Fig. 2(e and f). Clearly, a highly crystalline pattern can be observed with clear lattice fringes in both the samples. The continuous lattice fringes with an interplanar lattice spacing of 0.301 nm matched well with the (102) atomic planes of the samples, respectively.
In addition, the chemical composition of the BiOI-C and BiOI-G samples was analyzed by energy dispersive X-ray spectroscopy as displayed in Fig. 2(g and h), respectively. The results indicate that both BiOI-C and BiOI-G nano-spheres contain Bi, I and O elements, respectively.
The surface area and pore size distribution of the as-prepared BiOI-G and BiOI-C samples were determined by nitrogen adsorption–desorption study as shown in Fig. 3(a and b), respectively. It can been seen, that both the photocatalysts exhibited the type IV isotherm with a distinct H3 hysteresis loop at high relative pressure indicating the mesoporous structure according to the IUPAC classification.37,38 The BET surface area and pore volume for BiOI-C were 2.507 m2 g−1 and 0.005 m3 g−1, and 18.070 m2 g−1 and 0.048 m3 g−1 for BiOI-G, respectively. The average Barrett–Joyner–Halenda (BJH) pore diameter of the BiOI-G and BiOI-C calculated from desorption isotherm study came out to be 3.111 nm and 3.551 nm, respectively. Palatably, Azadirachta indica leaf extract sufficiently enriches the specific surface area of BiOI-G, which is upto nine times to that of the BiOI-C. Moreover, the materials with large surface area tend to possess adequate active sites, which would absorb more active species and allows sufficient contact between the photocatalyst and the pollutants. The increased the contact area can boost the transport of reactant species and subsequently, improve the photocatalytic activity, which is also consistent with FESEM analysis.39
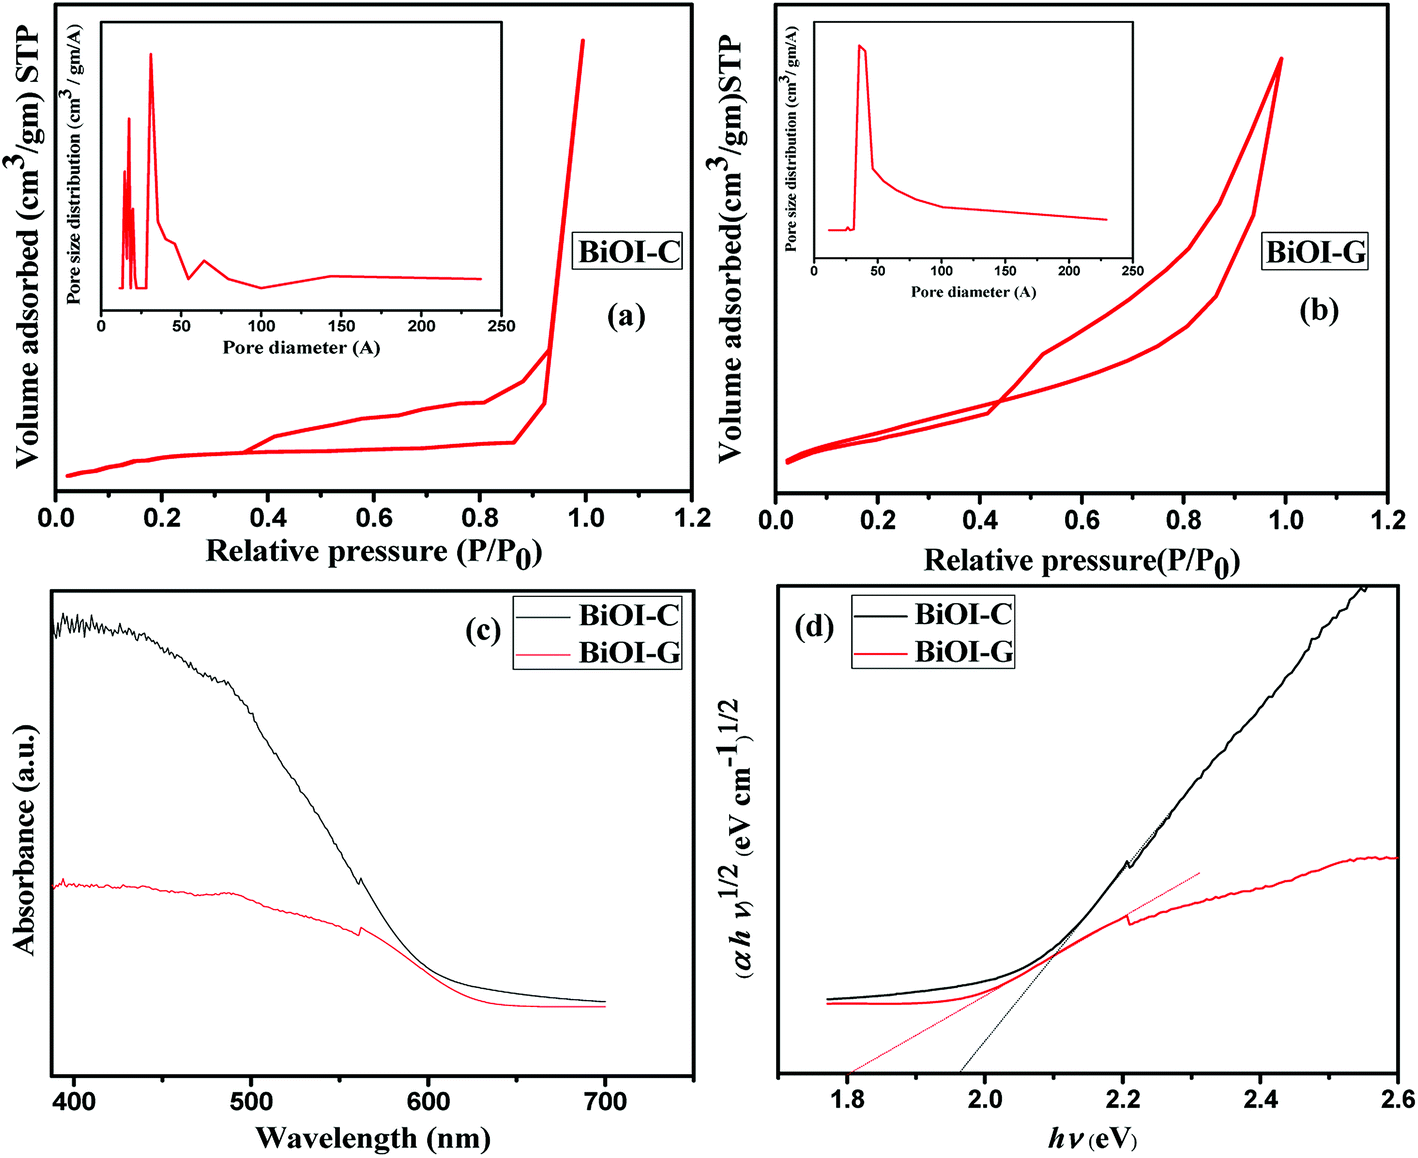 | ||
| Fig. 3 (a and b) N2 adsorption–desorption isotherms and pore size distributions, (c and d) UV-Vis DRS and plot of (αhν)n vs. hν of BiOI-C and BiOI-G. | ||
The optical absorption property of BiOI-G and BiOI-C were evaluated via UV-vis diffuse reflectance spectroscopy (DRS). As presented in Fig. 3(c), BiOI-C exhibited an absorption edge onset at 630 nm, corresponding to a band gap of 1.97 eV as computed by the Kubelka–Munk concept [Fig. 3(d)]. BiOI-G displayed a red-shift towards a deeper visible region exhibiting an absorption onset at around 688 nm and the band gap of BiOI-G was measured to be 1.8 eV. Consequently, BiOI-G under the irradiation of visible light would generate higher number of e−–h+ pairs, ultimately resulting in superior photocatalytic activity.40
Photocatalytic performance
To inspect the photocatalytic performance of the BiOI-C and BiOI-G samples, MO and RhB with initial concentrations of 20 mg L−1 were taken as the dye pollutants. As presented in Fig. 4(a and g), the blank test confirmed that the self-photolysis of MO and RhB was negligible, suggesting that the dyes are chemically stable under visible light irradiation. In the dark experiment, about 8.91% and 12.11% of MO, and 7.11% and 15.23% of RhB was adsorbed on the BiOI-C and BiOI-G surface. However, under visible light irradiation, 63.19% and 81.56% MO degradation, while 74.09% and 91.77% RhB degradation was found by BiOI-C and BiOI-G within 90 minutes. To check the maximum degradation of the dyes was checked and the photocatalytic concentration was varied from 50–125 mg/100 mL. As presented in Fig. 4(b, c, h and i), with increase in photocatalytic concentration the degradation of MO and RhB further increased upto 73.89% and 95.15%, and 79.93% and 99.47% by BiOI-C and BiOI-G, respectively. Clearly, the photocatalytic efficacy of BiOI-G for MO was nearly 21% more in comparison to BiOI-C, while in case of RhB it was around 20%, respectively.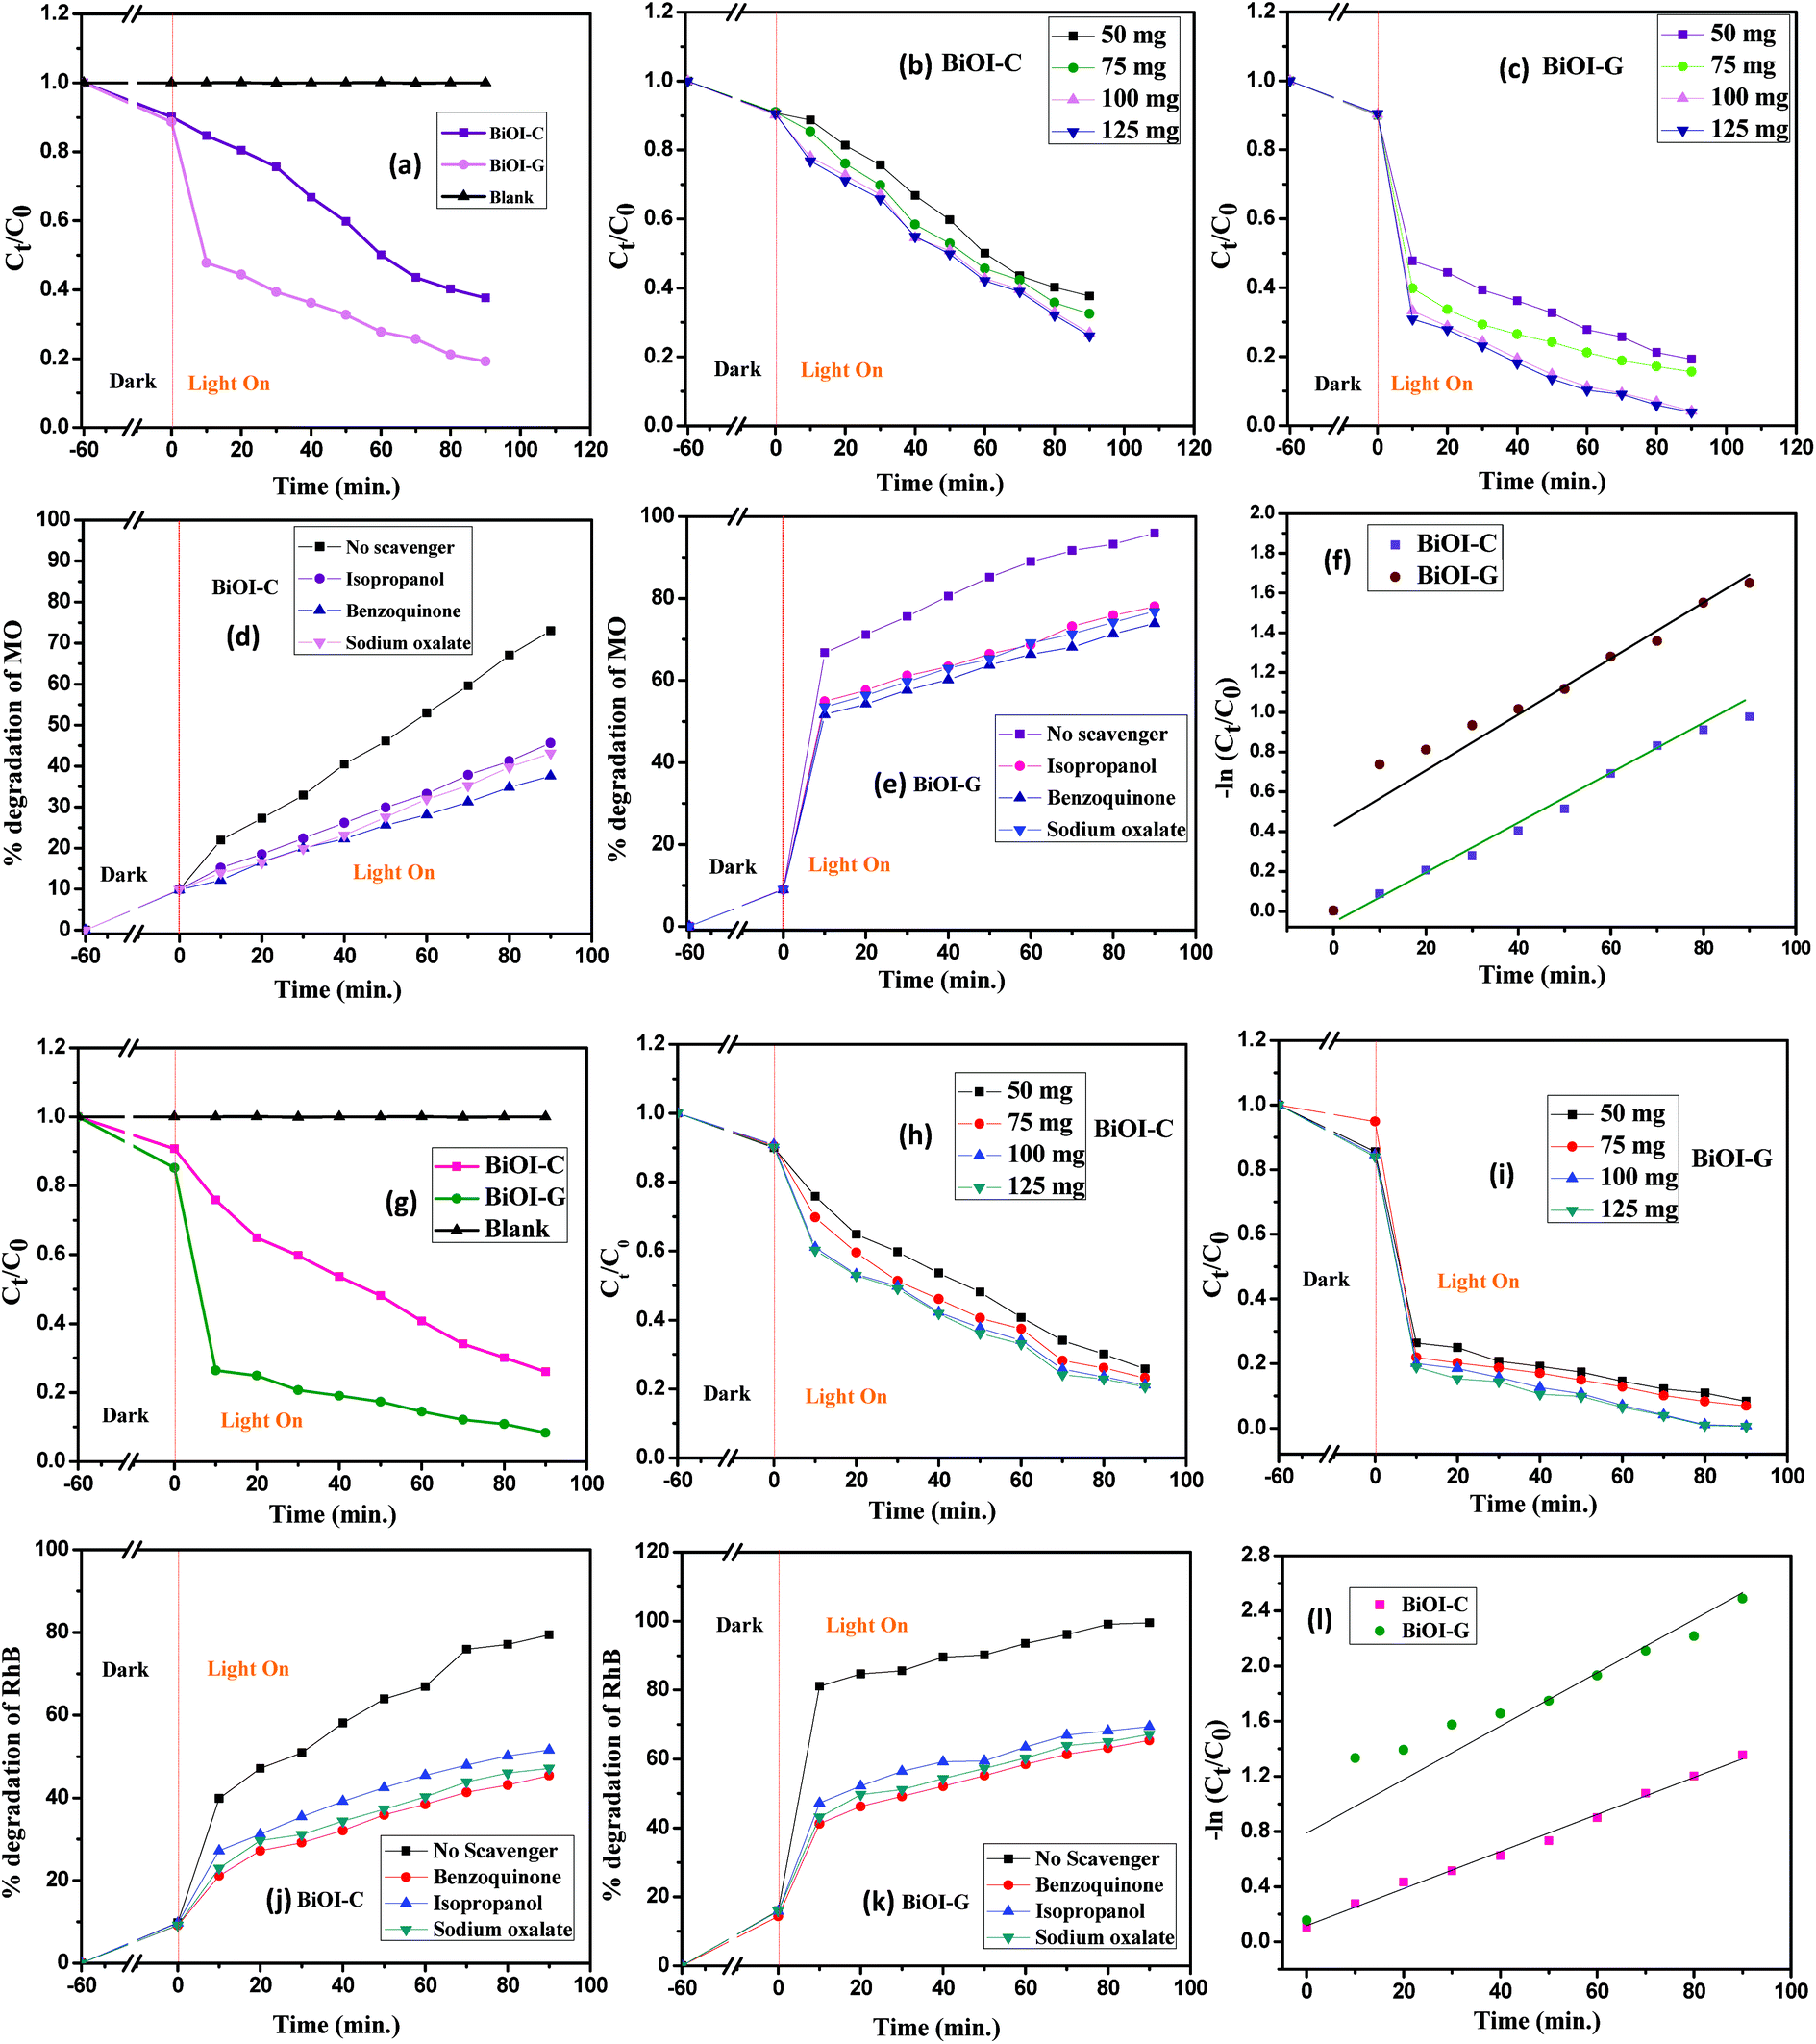 | ||
| Fig. 4 Photodegradation efficacy of MO and RhB by BiOI-C and BiOI-G (a and g) with time, (b and h) with different BiOI-C concentrations, (c and i) with different BiOI-G concentrations, (d and j) impact of scavengers on MO and RhB degradation in presence of BiOI-C (e and k), impact of scavengers on MO and RhB degradation in presence of BiOI-G, (f and l) Kinetic linear simulation curves of RhB and MO over the samples. | ||
A batch of experiments was then conducted to inspect the active species responsible for MO and RhB disintegration under visible light by the addition of three different scavengers (sodium oxalate for h+, isopropanol for ˙OH and benzoquinone for ˙O2−). As presented in Fig. 4(d, e, j and k), an obvious inhibition of the photocatalytic performance was observed, the disintegration rate was evidently decreased in all the cases. It suggests that all the three scavengers are playing a major part in the photo-oxidation process.
The photodisintegration activity was fit with a pseudo-first order kinetics model as presented in Fig. 4(f and l).
| −ln(Ct/C0) = kt | (1) |
To inspect the stability of BiOI-C and BiOI-G, the as-synthesized samples after every 90 minutes of photocatalytic experiment with MO and RhB were collected via centrifugation followed by washing with double distilled water several times. Finally, the samples were reused in the photocatalytic reactions five times under the same optimized conditions (ESI, Section S2†).
In prospect of the dye sensitization, a typical colourless pollutant i.e. benzotriazole was also chosen to further inspect the photocatalytic performance of BiOI-C and BiOI-G (ESI, Section S3†). To explore the degraded products of the benzotriazole, the reaction intermediates were recognized during the photocatalytic process using HPLC. Fig. 5(a and b), display the disintegration proces of benzotriazole, where the decreasing peak of benzotriazole occurred at 5.7 min. It can further be noticed that apart from the prominent peak of BT, no other peak was detected in both the cases, which suggests that benzotriazole is not dissociating into any harmful intermediate, it is rather getting suppressed with every time interval.
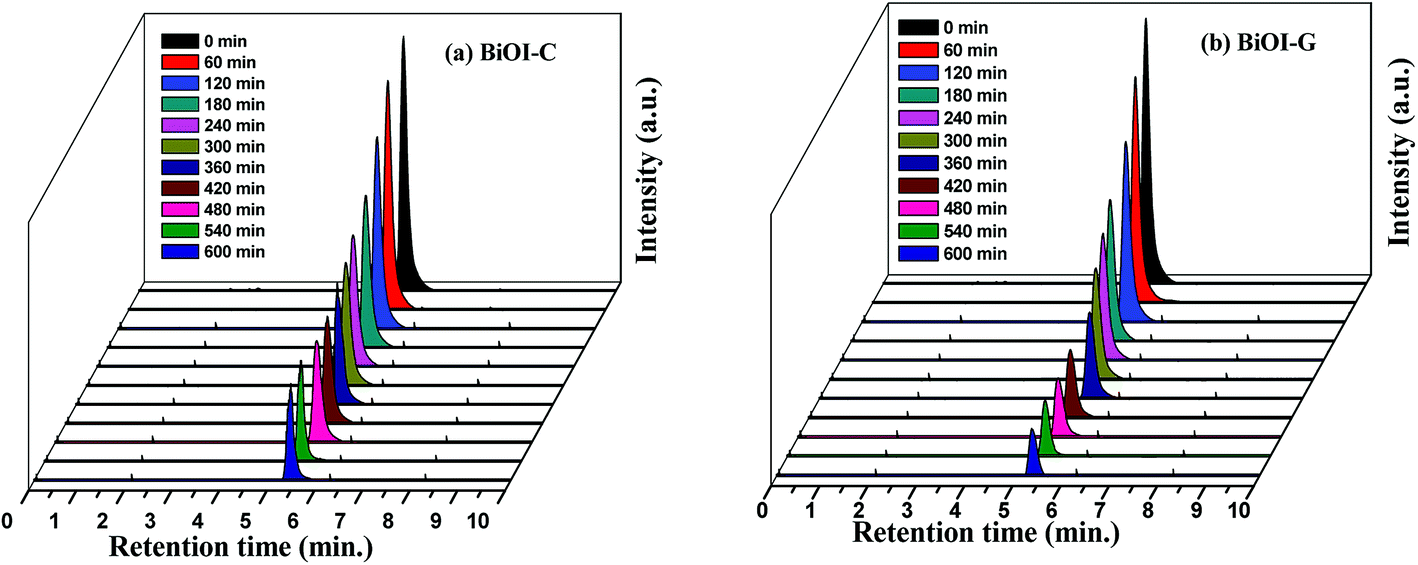 | ||
| Fig. 5 HPLC spectra of benzotriazole degradation by (a) BiOI-C and (b) BiOI-G. | ||
Photocatalytic mechanism
The valence band (VB) and conduction band (CB) of BiOI-G and BiOI-C were calculated using eqn (2)41 and (3)42| EVB = X − Ee + 0.5Eg | (2) |
| ECB = EVB − Eg | (3) |
The EVB and ECB values for BiOI-G and BiOI-C were estimated to be 2.39 eV and 0.59 eV, and 2.475 eV and 0.5 eV, respectively.
To inspect the charge transfer, recombination and migration process in BiOI-C and BiOI-G, the photocurrent response and EIS studies were carried out. As presented in Fig. 6(a), BiOI-G showed considerably greater photocurrent intensity than BiOI-C. It can be interpreted that the BiOI-G favorably allows more effective parting of photogenerated e−–h+ pair in comparison to BiOI-C. To assess more insights about the charge mobility in the BiOI-G and BiOI-C electrodes, EIS analysis was carried out. As presented in Fig. 6(b), the Nyquist circle of BiOI-G is much smaller in diameter in comparison to BiOI-C, indicating a lower resistance and subsequently, much faster carrier mobility from the BiOI-G to the electrode in comparison to BiOI-C.43 As discussed above, the energy band structure of BiOI-G and BiOI-C was accounted for the different separation efficacy of the photogenerated e−–h+ pair. Therefore, BiOI-G displayed a slight downshift in the CB, which resulted in production of photogenerated electrons to react with O2 to form ˙O2−. In contrast, the upshifting in the VB subsequently inhibited the e−–h+ pair recombination by having an intrinsic control over the mobility of the holes and much faster transmission of electrons to the reactants.44,45
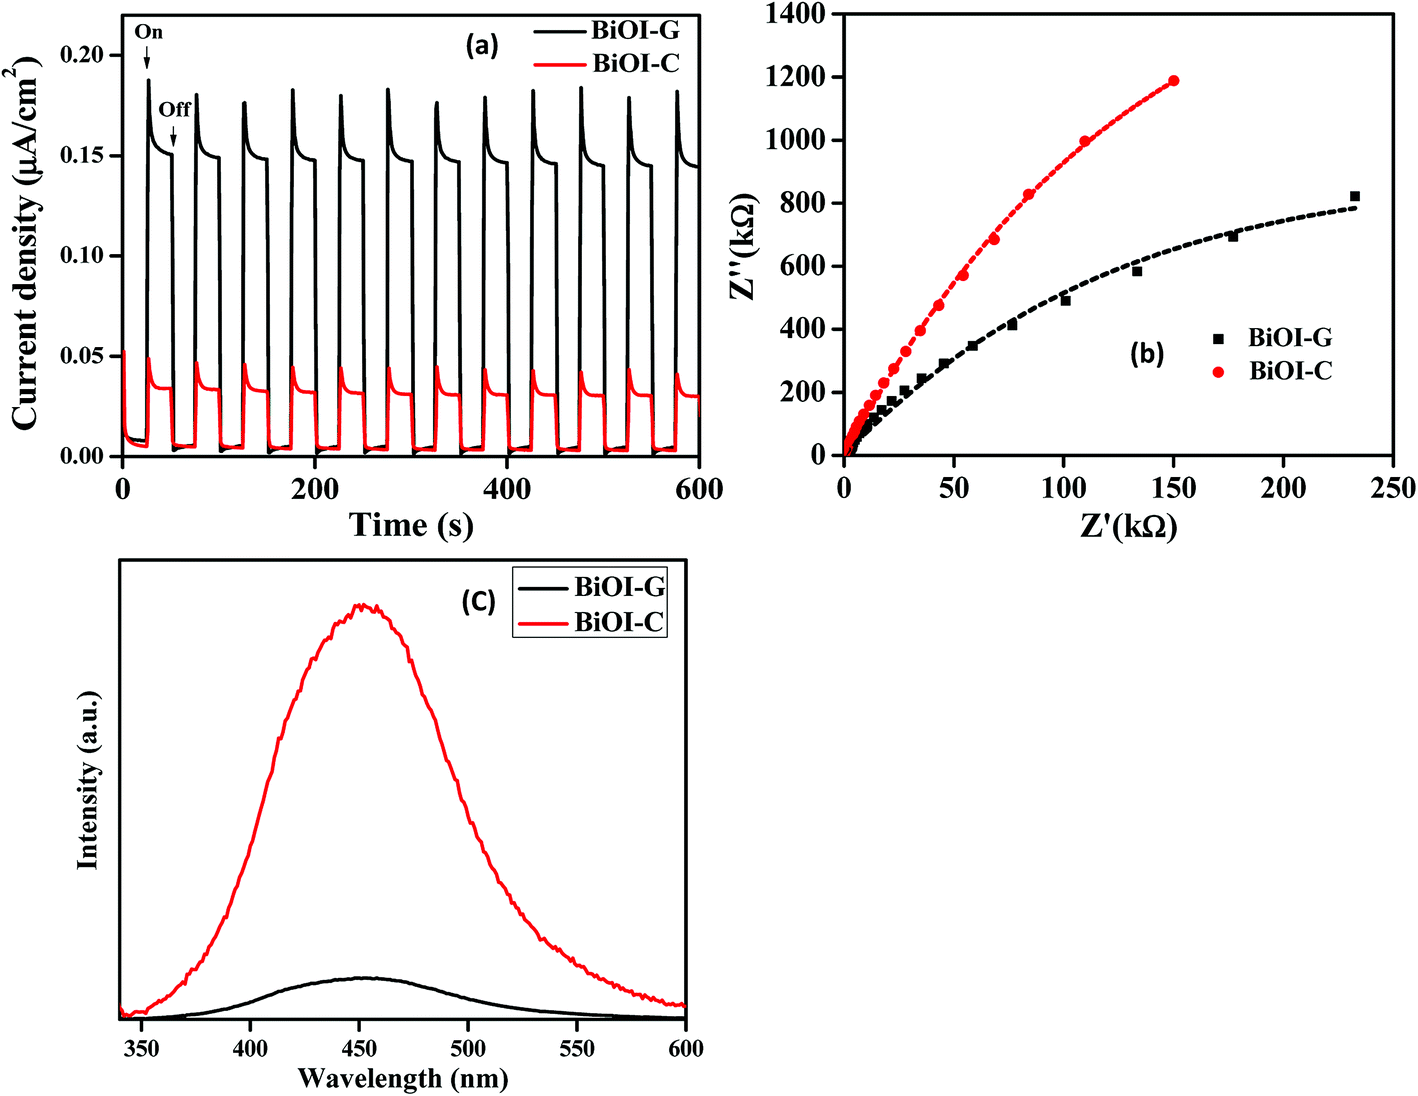 | ||
| Fig. 6 (a) Transient photocurrent response, (b) EIS, and (c) PL spectra of BiOI-C and BiOI-G. | ||
To further justify the above result, photoluminescence (PL) spectra of BiOI-C and BiOI-G are presented in Fig. 6(c), respectively. Clearly, BiOI-G exhibited significantly lower PL intensity compared to BiOI-C, which implies that the photogenerated e−–h+ pair in BiOI-G has been efficiently separated in comparison to BiOI-C.46
To identify the reasons for the much improved photocatalytic performance of BiOI-G, certain factors were addressed such as morphology, energy band diagram, transport of electrons and surface area. Firstly, the photocatalytic capability of a certain photocatalyst is directly associated to its morphology. From the earlier studies, BiOI-G was observed to be highly porous and has significantly higher surface area in comparison to BiOI-C.
Thus, the impact of morphology could be a primary reason for the difference noticed in the photocatalytic ability of the two samples. Now, considering the large surface area and adsorption capacity of BiOI-G, adequate number of photocatalytic reaction sites could have been another factor for the improved performance. Furthermore, the energy band structure of a material is associated to its photocatalytic activity. The BiOI-G displayed a narrower band gap than the BiOI-C sample, which favorably enhanced the electronic transition and boosted the formation of numerous electron–hole pairs. Based on the above analysis, all the factors are collectively playing a major role in the superior photocatalytic activity of BiOI-G.
On the basis of scavenger study and above discussion, a plausible mechanism for the degradation of MO, RhB, and BT was proposed.47,48 As shown in Fig. 7, under dark experiment, the organic pollutants get adsorbed on the surface of the photocatalyst. Upon visible light irradiation, BiOI-G is excited and electronic transition occurs at a rapid rate. The excited electrons in the CB react with the O2 molecules, which are adsorbed on the surface of BiOI-G to produce ˙O2−, leave behind photogenerated h+ in the valence band. The holes remaining in the VB react with the H2O molecules to produce ˙OH radicals. The major active species i.e. ˙OH, ˙O2− and h+ actively participates in the chemical reaction with the MO and RhB molecules to yield the degraded products. The photogenerated h+ were the major active species that solely took part in the disintegration of BT.
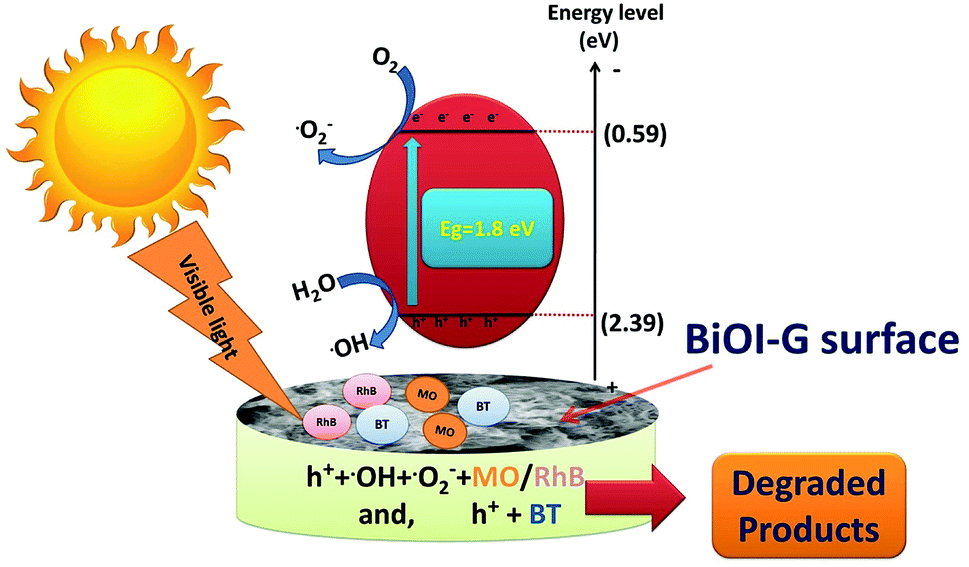 | ||
| Fig. 7 Photocatalytic degradation mechanism for MO, RhB and BT. | ||
Conclusions
In summary, a simple, ecofriendly and economically viable method was introduced to synthesize BiOI-G utilizing Azadirachta indica leaf extract. The phytochemicals present in the leaf extract controlled the size and provided stability to the as-prepared BiOI-G. The absorption edge of BiOI-G shifted substantially towards the longer wavelengths compared to BiOI-C. BiOI-G possessed substantially larger surface area and porosity, which accounted for maximum photocatalytic active sites for the pollutants. Furthermore, the PL spectra, photocurrent response and EIS studies revealed the higher electronic transition and effectual separation of the photogenerated e−–h+ pairs in BiOI-G. BiOI-G displayed superior photocatalytic performance for MO, RhB and BT degradation under visible source of light. This methodology provides a new direction towards an economical and ecofriendly route as an alternative for all chemical routes, which are detrimental to the environment safety.Conflicts of interest
There are no conflicts to declare.Acknowledgements
This work is financially supported by DST, Government of India (INT/HUN/P-06/2016), NRDIO, Hungary (TÉT_15-IN-1-2016-0013) and WOG Technology, New Delhi, India. The authors acknowledge Enikő Bárdos, University of Szeged for assistance in HRTEM studies.Notes and references
- D. K. Tiwari, J. Behari and P. Sen, World Appl. Sci. J., 2008, 3, 417–433 Search PubMed.
- S. Jain and M. S. Mehata, Sci. Rep., 2017, 7, 15867 CrossRef PubMed.
- P. Nagajyothi, T. M. An, T. Sreekanth, J.-i. Lee, D. J. Lee and K. Lee, Mater. Lett., 2013, 108, 160–163 CrossRef.
- B. K. Bindhani and A. K. Panigrahi, J. Nanomed. Nanotechnol., 2015, S6, 008 Search PubMed.
- P. Banerjee, M. Satapathy, A. Mukhopahayay and P. Das, Bioresour. Bioprocess., 2014, 1, 3 CrossRef.
- K. Saware and A. Venkataraman, J. Cluster Sci., 2014, 25, 1157–1171 CrossRef.
- S. Yedurkar, C. Maurya and P. Mahanwar, Open J. Synth. Theory Appl., 2016, 5, 1–14 CrossRef.
- A. Verma and M. S. Mehata, J. Radiat. Res. Appl. Sci., 2016, 9, 109–115 CrossRef.
- S. Garg, M. Yadav, A. Chandra, S. Sapra, S. Gahlawat, P. Ingole, M. Todea, E. Bardos, Z. Pap and K. Hernadi, Materials, 2018, 11, 1273 CrossRef PubMed.
- N. Jones, B. Ray, K. T. Ranjit and A. C. Manna, FEMS Microbiol. Lett., 2008, 279, 71–76 CrossRef PubMed.
- G. Sangeetha, S. Rajeshwari and R. Venckatesh, Mater. Res. Bull., 2011, 46, 2560–2566 CrossRef.
- T. Prathna, L. Mathew, N. Chandrasekaran, A. M. Raichur and A. Mukherjee, in Biomimetics learning from nature, InTech, 2010 Search PubMed.
- S. Li, S. Hu, K. Xu, W. Jiang, J. Liu and Z. Wang, Nanomaterials, 2017, 7, 22 CrossRef PubMed.
- Y. Xiang, P. Ju, Y. Wang, Y. Sun, D. Zhang and J. Yu, Chem. Eng. J., 2016, 288, 264–275 CrossRef.
- L. Chen, R. Huang, M. Xiong, Q. Yuan, J. He, J. Jia, M.-Y. Yao, S.-L. Luo, C.-T. Au and S.-F. Yin, Inorg. Chem., 2013, 52, 11118–11125 CrossRef PubMed.
- Z. Jiang, X. Liang, Y. Liu, T. Jing, Z. Wang, X. Zhang, X. Qin, Y. Dai and B. Huang, Appl. Catal., B, 2017, 211, 252–257 CrossRef.
- G. Dai, J. Yu and G. Liu, J. Phys. Chem. C, 2011, 115, 7339–7346 CrossRef.
- Q. Teng, X. Zhou, B. Jin, J. Luo, X. Xu, H. Guan, W. Wang and F. Yang, RSC Adv., 2016, 6, 36881–36887 RSC.
- H. Huang, Y. He, X. Du, P. K. Chu and Y. Zhang, ACS Sustainable Chem. Eng., 2015, 3, 3262–3273 CrossRef.
- Y. Liu, W. Yao, D. Liu, R. Zong, M. Zhang, X. Ma and Y. Zhu, Appl. Catal., B, 2015, 163, 547–553 CrossRef.
- Y. Feng, C. Liu, H. Che, J. Chen, K. Huang, C. Huang and W. Shi, CrystEngComm, 2016, 18, 1790–1799 RSC.
- J. Luo, X. Zhou, L. Ma and X. Xu, J. Mol. Catal. A: Chem., 2015, 410, 168–176 CrossRef.
- J. Cao, B. Xu, H. Lin, B. Luo and S. Chen, Dalton Trans., 2012, 41, 11482–11490 RSC.
- J. Di, J. Xia, M. Ji, B. Wang, S. Yin, H. Xu, Z. Chen and H. Li, Langmuir, 2016, 32, 2075–2084 CrossRef PubMed.
- R. Dong, Y. Hu, Y. Wu, W. Gao, B. Ren, Q. Wang and Y. Cai, J. Am. Chem. Soc., 2017, 139, 1722–1725 CrossRef PubMed.
- L. Liu, Z. Liu, H. Bai and D. D. Sun, Water Res., 2012, 46, 1101–1112 CrossRef PubMed.
- D. Hou, W. Luo, Y. Huang, C. Y. Jimmy and X. Hu, Nanoscale, 2013, 5, 2028–2035 RSC.
- F. Duo, Y. Wang, C. Fan, X. Zhang and Y. Wang, J. Alloys Compd., 2016, 685, 34–41 CrossRef.
- I. Sharma, G. K. Tripathi, V. K. Sharma, S. N. Tripathi, R. Kurchania, C. Kant, A. K. Sharma and K. Saini, Cogent Chem., 2015, 1, 1076371 Search PubMed.
- Y. Huo, Z. Xie, X. Wang, H. Li, M. Hoang and R. A. Caruso, Dyes Pigm., 2013, 98, 106–112 CrossRef.
- X. Xiao and W.-D. Zhang, J. Mater. Chem., 2010, 20, 5866–5870 RSC.
- M. Stan, A. Popa, D. Toloman, A. Dehelean, I. Lung and G. Katona, Mater. Sci. Semicond. Process., 2015, 39, 23–29 CrossRef.
- J. Di, J. Xia, Y. Ge, L. Xu, H. Xu, J. Chen, M. He and H. Li, Dalton Trans., 2014, 43, 15429–15438 RSC.
- W.-T. Sun, Y. Yu, H.-Y. Pan, X.-F. Gao, Q. Chen and L.-M. Peng, J. Am. Chem. Soc., 2008, 130, 1124–1125 CrossRef PubMed.
- Y. Wang, K. Deng and L. Zhang, J. Phys. Chem. C, 2011, 115, 14300–14308 CrossRef.
- J. Di, J. Xia, M. Ji, L. Xu, S. Yin, Q. Zhang, Z. Chen and H. Li, Carbon, 2016, 98, 613–623 CrossRef.
- G. I. Waterhouse, G. A. Bowmaker and J. B. Metson, Phys. Chem. Chem. Phys., 2001, 3, 3838–3845 RSC.
- H. Yu, R. Liu, X. Wang, P. Wang and J. Yu, Appl. Catal., B, 2012, 111, 326–333 CrossRef.
- J. Di, J. Xia, Y. Ge, H. Li, H. Ji, H. Xu, Q. Zhang, H. Li and M. Li, Appl. Catal., B, 2015, 168, 51–61 CrossRef.
- X. Gao, H. B. Wu, L. Zheng, Y. Zhong, Y. Hu and X. W. D. Lou, Angew. Chem., 2014, 126, 6027–6031 CrossRef.
- Y. Xu and M. A. Schoonen, Am. Mineral., 2000, 85, 543–556 CrossRef.
- H. Huang, Y. He, R. He, X. Jiang, Z. Lin, Y. Zhang and S. Wang, Inorg. Chem. Commun., 2014, 40, 215–219 CrossRef.
- L. Zhang, H. B. Wu, Y. Yan, X. Wang and X. W. D. Lou, Energy Environ. Sci., 2014, 7, 3302–3306 RSC.
- G. Liu, P. Niu, C. Sun, S. C. Smith, Z. Chen, G. Q. Lu and H.-M. Cheng, J. Am. Chem. Soc., 2010, 132, 11642–11648 CrossRef PubMed.
- M. Guan, C. Xiao, J. Zhang, S. Fan, R. An, Q. Cheng, J. Xie, M. Zhou, B. Ye and Y. Xie, J. Am. Chem. Soc., 2013, 135, 10411–10417 CrossRef PubMed.
- S.-W. Cao, X.-F. Liu, Y.-P. Yuan, Z.-Y. Zhang, Y.-S. Liao, J. Fang, S. C. J. Loo, T. C. Sum and C. Xue, Appl. Catal., B, 2014, 147, 940–946 CrossRef.
- L. Ye, L. Zan, L. Tian, T. Peng and J. Zhang, Chem. Commun., 2011, 47, 6951–6953 RSC.
- X. Zhang, C.-Y. Wang, L.-W. Wang, G.-X. Huang, W.-K. Wang and H.-Q. Yu, Sci. Rep., 2016, 6, 22800 CrossRef PubMed.
Footnote |
| † Electronic supplementary information (ESI) available: Calculation of average crystallite sizes of the samples, detailed photocatalytic degradation of benzotriazole, reusability and stability study of the samples etc. See DOI: 10.1039/c8ra05661g |
| This journal is © The Royal Society of Chemistry 2018 |