 Open Access Article
Creative Commons Attribution 3.0 Unported Licence
Inkjet printing and UV-LED curing of photochromic dyes for functional and smart textile applications†
Sina Seipel *a,
Junchun Yu
 a,
Aravin P. Periyasamy
 b,
Martina Viková
 b,
Michal Vik
 b and
Vincent A. Nierstrasz
 a
a
aTextile Materials Technology, Department of Textile Technology, Faculty of Textiles, Engineering and Business, University of Borås, 501 90 Borås, Sweden. E-mail: sina.seipel@hb.se
bDepartment of Material Engineering, Faculty of Textile Engineering, Technical University of Liberec, 461 17 Liberec, Czech Republic
First published on 8th August 2018
Abstract
Health concerns as a result of harmful UV-rays drive the development of UV-sensors of different kinds. In this research, a UV-responsive smart textile is produced by inkjet printing and UV-LED curing of a specifically designed photochromic ink on PET fabric. This paper focuses on tuning and characterizing the colour performance of a photochromic dye embedded in a UV-curable ink resin. The influence of industrial fabrication parameters on the crosslinking density of the UV-resin and hence on the colour kinetics is investigated. A lower crosslinking density of the UV-resin increases the kinetic switching speed of the photochromic dye molecules upon isomerization. By introducing an extended kinetic model, which defines rate constants kcolouration, kdecay and kdecolouration, the colour performance of photochromic textiles can be predicted. Fabrication parameters present a flexible and fast alternative to polymer conjugation to control kinetics of photochromic dyes in a resin. In particular, industrial fabrication parameters during printing and curing of the photochromic ink are used to set the colour yield, colouration/decolouration rates and the durability, which are important characteristics towards the development of a UV-sensor for smart textile applications.
Introduction
The main drivers and motivation behind the sensor technology of smart textiles are the changing environment, an increasing need for protection mechanisms and a demand for lightweight products with highly integrated functions. Smart textiles help the user to sense and respond to external stimuli, and ideally adapt to them.1 The need for UV-sensors to detect UV rays from sunlight is demonstrated using a variety of materials like hydrated tungsten oxide nanosheets,2 conductive polymer and CNT composites,3 fluorescent polyoxometalate and viologen,4 multifunctional ZnO-based biofilms5 and various photochromic compounds6 in recent research studies. For smart textile applications, photochromic materials provide excellent properties to function as flexible sensors, which display a reversible colour change and therewith warn the user of the presence of harmful UV-radiation in everyday situations where UV-light is not an obvious threat, i.e. windy and partially cloudy weather conditions.Upon UV-irradiation photochromic dyes such as organic spiro-compounds reversibly change colour, from colourless to a colour. Elevated photoelectric energy rearranges the molecular structure of the dye, which is reversible either through visible light or heat. The isomers A and B of the dye have different absorption spectra.7
In recent literature, the development of UV-sensing textiles using photochromic dyes has been paid much attention. The integration of photochromic dyes into textile structures has been proven successful with traditional textile production techniques such as screen-printing,8–10 dyeing11,12 and mass dyeing.10,13,14 Moreover, the application of photochromic dyes using novel production techniques has emerged. Whereas, Aldib15 investigated the potential of digital inkjet printing of solvent-based ink to produce photochromic textiles, Fu et al.16 studied photonic curing to produce a photochromic cross-linked polymer. In other areas of textile colouration such as pigment printing, the advantages of inkjet printing in combination with photo-curing of an aqueous polyurethane acrylate system17 or by mini-emulsion encapsulation18 were explored. To the best of our knowledge, the combination of digital inkjet printing and UV-LED curing has not yet been studied in the industrially applicable fabrication of a UV-sensing smart textile using photochromic dye.
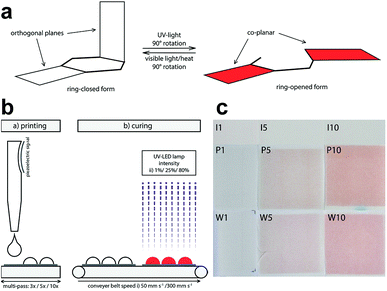
UV-curable coatings distinguish themselves from thermally dried coating or binder systems, such as water-based acrylate binders typically used in screen-printing, by their high rigidity and three-dimensional cross-linked structure.19 According to Schwalm et al.20 and Agarwal,21 depending on the chemistry, i.e. the choice of oligomers and monomers in the formulation, the coating's flexibility, adhesion and hardness can be controlled. Substrate-ink adhesion and flexibility are particularly important when printing on flexible substrates like textiles. In general, UV-curable inkjet inks exhibit good adhesion to porous substrates as compared to solvent-based alternatives.22 Inkjet printing and UV-curing also provide a controllable process, where the thickness of the printed ink and the cross-linked network can be controlled. Eventually, a high degree of crosslinking is desired to achieve good adhesion of dyes in a solid ink matrix onto the textile surface and to ensure a durable functional surface treatment. The degree of polymer crosslinking of the carrying ink also affects the rate of the switching reaction of photochromic dyes such as spirooxazines or naphthopyrans between their ring-closed colourless and ring-opened coloured state (Fig. 1(a)). A 90° rotation in the molecular structure between non-planar and planar isomers requires space.7,23,24 Hence, the structural molecular changes of the dyes upon isomerization are largely affected by the properties of the host matrix. Whereas, Ercole et al.25 and Malic et al.26 studied the placement of naphthopyran dye in host polymers, Mutoh et al.27 investigated block copolymers as host matrix. Other factors, which influence the photochromic response are chain length, free volume and rigidity of the host matrix.24,27,28 In particular, the higher the crosslinking density of the ink, the lower the degree of freedom in the matrix and hence the slower the switching reaction of the photochromic dye is.25,26,29
In this paper, we explore and tune the colour performance of a novel UV-responsive textile using fabrication parameters of an industrially applicable process. Altering the curing intensity of the photochromic ink on the textile during fabrication, influences the rigidity of the UV-resin, the dye-polymer matrix interaction and hence the degree of freedom of the dye to switch between isomers in the matrix. In particular, the photo-switching of the photochromic textiles is influenced by the combination of two challenging functions of electromagnetic radiation during production and characterization. The photochromic textile, which is fabricated by inkjet printing and UV-LED curing is activated by UV-light once in use. The impact of UV-rays during curing and activation requires the introduction of an extended kinetic model to describe the kinetics of UV-curable photochromic materials. The lowest curing intensity achieves highest colour yields and fastest switching behaviour between the coloured and colourless state of the photochromic dye Ruby Red in a UV-curable resin. The proposed kinetic model is an important step towards the development of a smart textile UV-sensor and allows the prediction of the colour performance based on fabrication parameters.
Materials and methods
Materials
A commercial heterocyclic spiro-compound (Reversacol Ruby Red) from Vivimed Labs, UK was used as photochromic dye in a UV-curable inkjet ink formulation to produce a textile UV-sensor. The photochromic ink contains a dye concentration of 2.5 g L−1. The UV-curable carrier consists of dipropylene glycole diacrylate monomers (DPGDA), amine modified polyetheracrylate oligomers (Ebecryl 81) supplied by Allnex SA/NV, Belgium and a UV-LED photo-initiator (Genocure TPO-L) supplied by Rahn AG, Switzerland. Ethyl acetate, 99.9% (Chromasolv Plus), purchased from Sigma-Aldrich was used as media to disperse the photochromic dye in the ink formulation, but was removed afterwards by vacuum pumping. Plain-woven polyester (PET) fabric with a weight of 147 g m−2 and 20 and 23 threads cm−1 in warp and weft direction, respectively, received from FOV Fabrics, Sweden was used as the substrate for digital inkjet printing.Production of photochromic prints
Photochromic prints were produced using a Sapphire QS 10 print head from Fujifilm Dimatix, USA. Printing was carried out in multi-pass mode with a resolution of 300 dpi and at a print head temperature of 35 °C. To determine the effect of the amount of ink deposition on the crosslinking density and colour behaviour, different amounts of ink were deposited during printing. 1, 3, 5, 7 and 10 passes of ink were printed on PET, which correspond to ink amounts of 3, 8, 10, 13 and 19 g m−2, respectively. Subsequently, the prints were cured using a UV-LED lamp FireJet from Phoseon Technology, USA with emission wavelengths of 380 to 420 nm and a maximum emission power of 6 W cm−2 (the UV-LED lamp is part of a continuous pilot-scale inkjet printing system with a conveyer belt for substrate transportation). To determine the optimal curing efficiency and colour performance, curing conditions were varied. Hence, two different conveyer belt speeds, 50 mm s−1 and 300 mm s−1, and three different lamp intensities, 1%, 25% and 80%, were used (Fig. 1(b)). To determine the effect of a cleaning step, one set of samples was washed once after printing and curing. Washing was done using procedure 4 N and reference detergent 3 according to ISO 6330:2012. The samples were dried using drip flat drying.UV-Vis spectroscopy
UV-Vis spectra were collected using a Libra S60 double beam spectrophotometer from Biochrom, UK and a UV-3101PC from Shimadzu, Japan double beam spectrophotometer with integrated sphere accessory to affirm fit of the photo-initiator for the UV-LED lamp of the pilot-scale inkjet printing system and to determine the influence of UV-varnish on the absorption spectra of the dye.Colour analysis
The colour behaviour of the photochromic prints was measured using an LCAM Photochrom 3 spectrophotometer, which allows continuous colour measurement upon cycles of UV-exposure and relaxation30 (Fig. 2).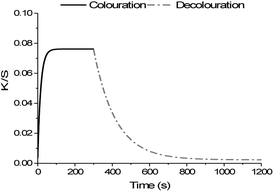 | ||
| Fig. 2 Scheme of colour measurement cycle with 300 s of UV-exposure for colouration and 900 s of relaxation for decolouration. | ||
The activation light source was an Edixon UV-LED lamp (EDEV-3LA1) with a radiometric power ΦV of 350 mW and an emission peak with wavelengths between 395 nm and 410 nm. The measuring light source was a dual light source system of combined high power white LEDs with CCTs of 4000, 5000 and 7000 K. The measuring light source system illuminates samples with illuminance of 60 klx. This illuminance is a compromise between brightest sunlight intensity (120 klx) and daylight intensity without direct sunlight at noon (20 klx). In addition, the measuring light source is equipped with a set of high-pass filters preserving light transmission bellow 420 nm, which decrease possible activation of photochromic composition. Colour values K/S were measured from reflectance values R using the Kubelka–Munk function:
 | (1) |
The kinetic model shown in eqn (2) follows first-order kinetics and is generally used to describe photochromic colour behaviour for both the colouration and decolouration reaction as seen in Fig. 2.31
 | (2) |
Based on the kinetic model, the sensor functionality was specified by its achieved colour intensity ΔK/S upon activation with UV-light, its rate constant of colour increase kcolouration to achieve maximum colouration K/S∞, and its rate constant of colour decrease kdecolouration to revert to the initial colourless state K/S0.
DSC analysis
The influence of deposited ink amount and curing conditions on the curing efficiency was determined indirectly by analysing the shift of the melting peak Tm of PET using a Q1000 DSC from TA Instruments, USA. The DSC samples sealed in aluminum pans were weighted. The balance (Kern) has 99.96% accuracy when calibrated against a standard weight of 100 mg. The heat flow of samples of about 5.0 mg was measured during a heating and cooling cycle from 25 °C to 290 °C and back to 25 °C with a rate of 10 °C min−1. The released energy ΔH of the endothermic reaction during melting of the material gives indirect information on the degree of polymer crosslinking at the interface between the PET fabric and the photochromic UV-cured ink. The shift of the melting peak Tm towards higher temperatures compared to the Tm of pure PET fabric indicates that an insulating layer is built surrounding the textile yarn/fiber. Depending on the curing intensity, the insulation effect of the print varies. The adhesion of the ink on the PET surface is indicated by the difference in melting peak temperature ΔTwashed of the photochromic prints before and after washing. Washing hence gives information about the durability of the photochromic, UV-cured surface treatment on PET.Statistical analysis
Statistical analysis of colour measurement and DSC data was conducted in Origin 2017 from OriginLab Corporation, USA at a confidence interval of 95%. One-way ANOVAs were used to determine the effect of washing on the crosslinking density of the ink, colour yields and rate constants of the dye. Two-way ANOVAs were used to determine the effect of the production parameters belt speed and lamp intensity, as well as the significance of their interaction.Results and discussion
Design of the UV-curable ink
UV-Vis spectra confirm the fit of photo-initiator (absorption peak between 340 and 410 nm) used in the ink formulation with the UV-LED light source (emission band of 380 to 420 nm) to initiate polymer crosslinking. The normalized absorption peaks of the photochromic dye in solvent and UV-resin conform to each other. Ruby Red has an absorption peak of 500 nm in ethyl acetate and 490 nm in the UV-curable resin (Fig. S1 in ESI†). Analysis of the measured colour values, rate constants for colour development and reversion are hence made at a wavelength of 500 nm.DSC analysis of crosslinks in the UV-curable ink
| Belt speed (mm s−1) | Lamp intensity (%) | Tm (°C) printed | Twashed (°C) washed | ΔTm (°C) Tm – UV-treated PET | ΔTwashed (°C) |
|---|---|---|---|---|---|
| Untreated PET | 252.9 ± 0.2 | — | |||
| 300 | 1 | 254.4 ± 0.5 | 254.3 ± 0.1 | 0.4 | 0.1 |
| 25 | 255.0 ± 0.1 | 254.6 ± 0.3 | 1.0 | 0.4 | |
| 80 | 255.4 ± 0.1 | 254.8 ± 0.2 | 1.4 | 0.6 | |
| 50 | 1 | 255.2 ± 0.3 | 254.7 ± 0.4 | 1.2 | 0.5 |
| 25 | 255.3 ± 0.2 | 254.7 ± 0.2 | 1.3 | 0.6 | |
| 80 | 255.4 ± 0.2 | 255.2 ± 0.3 | 1.4 | 0.2 |
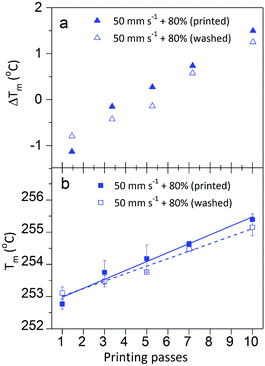
Moreover, fitting and extrapolation of the data (Fig. S2 in ESI†) suggested that the Tm increased exponentially as a function of printing passes, which saturates at around 50 printed passes and a Tm of 257.1 °C. This indicates that measuring Tm with DSC can approximate the amount of cross-linked UV-ink at a certain curing condition on the PET fabric.
Colour performance of the photochromic textile
300 mm s−1/1% > 300 mm s−1/25% > 50 mm s−1/1% > 50 mm s−1/25% > 300 mm s−1/80% > 50 mm s−1/80%
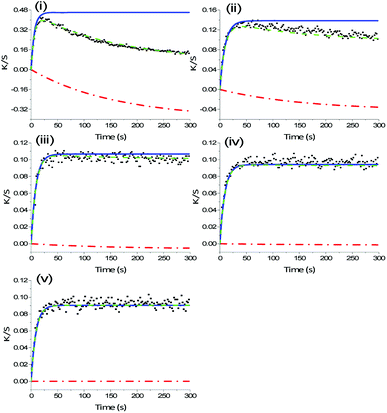
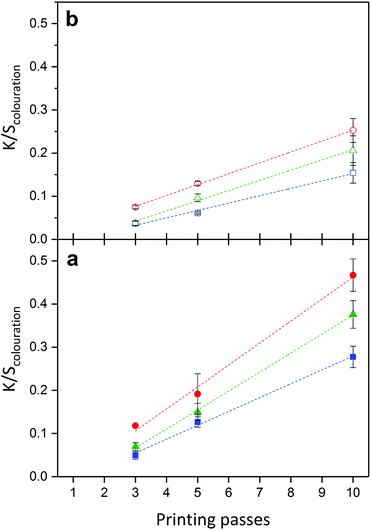
The combination of highest belt speed and lowest lamp intensity, 300 mm s−1 and 1%, has the highest deviation from the kinetic model in the first colouration cycle as a result of lowest polymer crosslinking density. This conforms to the colour data, which shows that UV-light exposure during colour measurement of samples with low crosslinking density decreased ΔK/Scolouration in the subsequent colouration cycles 2, 3, 4 and 5 (Fig. 5). This can be a result of continuous curing and simultaneous dye degradation. High UV-radiation improves the cure speed of the resin32,33 and longer irradiance increases the degree of polymer crosslinking.21 Meanwhile, photo-degradation of photochromic dyes is commonly observed under prolonged UV-irradiance.34–36
Therefore, for prints with lower polymer crosslinking density, we introduce a model that defines the kinetics of a decay mechanism as a result of continuous curing while colour measurement and reconstructs the actual colouration curve (Fig. 5). For ink systems, where UV-light is used to cure the photochromic prints with the aim to optimize curing conditions, the following extended kinetic model is proposed.
 | (3) |
Under the boundary condition that the processes of colouration and decay start simultaneously and at ΔK/S = 0, which means that K/S0col = 0 and K/S0dec = 0, eqn (3) reduces to
 | (4) |
Via continuous UV-exposure over 1500 s it could be excluded that the decolouration reaction interferes with the observed decay mechanism during the colouration reaction (Fig. S5 in ESI†). Rate constants of the decay mechanism kdecay were fitted as exponential decay during UV-exposure, i.e. to the decrease in K/Scolouration throughout the five UV-exposure cycles during the colouration reaction, which add up to 1500 s.
The extended kinetic model, eqn (4), has been applied to the colour data of inkjet-printed samples with a deviation from eqn (2), i.e. R2 < 0.95, to reconstruct the K/Scolouration values and kcolouration, as well as to determine the extent of decay depending on the curing setting and applied amount of ink. An increasing amount of ink influences the secondary decay of the dye throughout colour measurement. It is a common trend for all curing settings that the lower the amount of applied ink, the higher is kdecay. Prints cured at a belt speed of 50 mm s−1 and 1% lamp power show decreasing kdecay from 0.017 s−1 to 0.014 s−1 to 0.004 s−1 for 3, 5 and 10 printing passes, respectively. With increasing layer thickness oxygen diffusion is aggravated and the primarily affected surface area is proportionally reduced. As presented in Table 2, the secondary decay decreases with stronger curing conditions from kdecay = 0.006 s−1 for 300 mm s−1 and 1% to 0.002 s−1 for 50 mm s−1 and 25%. Also, variation in kdecay is higher when transported at 300 mm s−1. Hence, the decreasing trend of variation in kdecay and rates with increasing crosslinking density of prints directly correlates with the trend of deviation from eqn (2).
| Belt speed (mm s−1) | Lamp intensity (%) | Printed | |||
|---|---|---|---|---|---|
| ΔK/Scolouration | kcolouration (s−1) | kdecolouration (s−1) | kdecay (s−1) | ||
| 300 | 1 | 0.467 ± 0.038 | 0.157 ± 0.018 | 0.011 ± 0.001 | 0.006 ± 0.003 |
| 25 | 0.550 ± 0.049 | 0.128 ± 0.019 | 0.011 ± 0.001 | 0.004 ± 0.002 | |
| 80 | 0.434 ± 0.036 | 0.114 ± 0.018 | 0.010 ± 0.000 | 0.004 ± 0.002 | |
| 50 | 1 | 0.376 ± 0.032 | 0.145 ± 0.019 | 0.010 ± 0.001 | 0.004 ± 0.001 |
| 25 | 0.370 ± 0.012 | 0.123 ± 0.015 | 0.010 ± 0.000 | 0.002 ± 0.001 | |
| 80 | 0.278 ± 0.025 | 0.070 ± 0.008 | 0.008 ± 0.001 | — | |
| Belt speed (mm s -1) | Lamp intensity (%) | Washed | Remained ΔK/S (%) | ||
|---|---|---|---|---|---|
| ΔK/Scolouration | kcolouration (s−1) | kdecolouration (s−1) | |||
| 300 | 1 | 0.253 ± 0.028 | 0.109 ± 0.014 | 0.010 ± 0.001 | 54.1 |
| 25 | 0.266 ± 0.007 | 0.086 ± 0.014 | 0.010 ± 0.001 | 48.3 | |
| 80 | 0.213 ± 0.020 | 0.066 ± 0.013 | 0.009 ± 0.001 | 49.0 | |
| 50 | 1 | 0.206 ± 0.034 | 0.077 ± 0.020 | 0.009 ± 0.001 | 54.8 |
| 25 | 0.185 ± 0.016 | 0.061 ± 0.011 | 0.009 ± 0.001 | 50.1 | |
| 80 | 0.154 ± 0.024 | 0.047 ± 0.006 | 0.007 ± 0.001 | 55.5 | |
The intensity of the light source used for exposure in the LCAM Photochrom 3 spectrophotometer with 8 mW cm−2 at sample position is 750-times lower than the UV-LED lamp intensity, i.e. approx. 10-times lower than 1% intensity of the curing lamp. Also, exposure of the prints to UV-light stretches over 300 s during colour measurement instead of approx. 1 s during the curing process. Both low irradiation intensity and long exposure time of the photochromic dye in a liquid resin cause rapid degradation as a result of photo-oxidation. A partially liquid resin has a lower viscosity, which facilitates oxygen diffusion.33 It can be assumed that dye degradation as a result of photo-oxidation occurs in the soft component of the resin, which is more prominent compared to when the dye is fixed in a solid matrix. However, cut-off effects of the dye-carrying medium, i.e. shift in reflectance properties as a result of changed degree of cure and media thickness have also been investigated.10,37 We therefore consider the observed decrease a secondary decay, which obviously reduces ΔK/S and colour reaction kinetics.
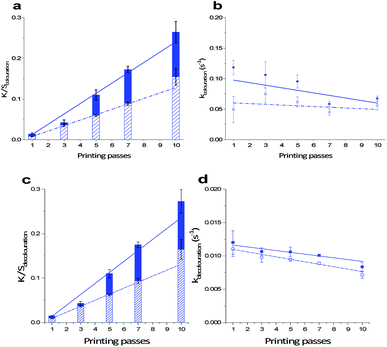
The amount of printed photochromic ink on PET influences the kinetics of the colouration reaction. Similar to the trend in decrease in kdecay, an increasing amount of applied material lowers kcolouration as seen in Fig. 6(b) for prints cured at a belt speed of 50 mm s−1 and 80% of lamp intensity. A decrease in kcolouration as function of printing passes can be explained by weakened activation of the photochromic dye with increased layer thickness.10 Washing has a significant effect on the colouration behaviour of the photochromic prints. Both ΔK/Scolouration and kcolouration significantly decrease as a result of a washing cycle. The reduced colour yield ΔK/Scolouration approximates 40% of the initial value for all printing passes from 1 to 10. With a decrease of approx. 20% at 10 passes compared to 40% at 1 pass, kcolouration is less affected with increasing layer thickness.
A high crosslinking density provides good ink-substrate adhesion, which is seen in high remaining ΔK/Scolouration values after washing. The remaining ΔK/S of 10-pass prints after a washing process is highest for strongest curing conditions, i.e. 55.5% for 50 mm s−1 and 80%. Washing decreases ΔK/Scolouration significantly for all curing conditions, with maximum remaining 55.5% to minimum 48.3% for 10-pass prints. It can be concluded that stronger curing conditions result in low absolute ΔK/Scolouration and low kcolouration and kdecolouration. A low polymer crosslinking density of the carrier matrix exhibits a higher amount of soft component in the photopolymer, which enables more flexibility and free volume for faster switching of the photochromic dye molecule.24,27 A comparison of colour intensities and colouration rates between the six combinations of curing settings reveals that the setting with the lowest curing intensity, i.e. belt speed of 300 mm s−1 and lamp intensity of 1%, is the most favourable. High ΔK/S and fast kinetic switching with kcolouration of 0.157 s−1 after printing and 0.109 s−1 after washing between the uncoloured and coloured state of the textile UV-sensor is achieved. A higher cross-linked resin results in lowered rates of colouration with i.e. kcolouration of 0.070 s−1 before and 0.047 s−1 after washing for 10-pass prints cured at 50 mm s−1 and 80%.
Viková10 applied naphthopyran dyes on textiles in a screen-printing paste and achieved colouration rates of 0.09 s−1 and 0.25 s−1 with a concentration of 0.25 wt% at lamp intensity of 800 μW cm−2. The same dyes applied with a concentration of 1 wt% in a spin dope, which was melt-blown to a non-woven achieved colouration rates between 0.01 s−1 and 0.03 s−1.10 With respect to different concentrations and activation powers it can be assumed that similar dye types to Reversacol Ruby Red applied via a UV-cured matrix obtain kcolouration, which are higher than in a fibre structure but lower than in a water-based and thermally cured acrylate paste.
With an increasing amount of printed ink, kdecolouration to revert the photochromic dye back to its uncoloured state are successively lowered by ca. 30% when cured with low speed and high lamp intensity, i.e. 50 mm s−1 and 80%. kdecolouration decreases from 0.012 s−1 for 1-pass prints to 0.008 s−1 for 10-pass prints. A washing process has a significant effect and lowers the decolouration rates by 10–15% for all printing passes (Fig. 6(d)). Same as for kcolouration, kdecolouration is influenced by the thickness of the applied ink on the textile surface. An increase in layer thickness decreases the reaction rate.
Durability and adhesion of the photochromic ink
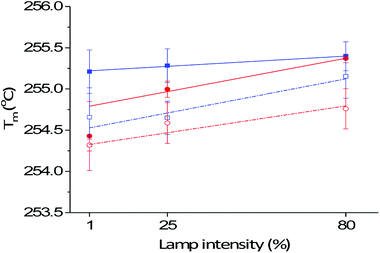
Washed samples exhibit a statistically significantly lowered melting temperature Twashed regardless of the curing condition, as shown in Fig. 4. The decreased Twashed, as listed in Table 1, is a measure for durability in terms of adhesion of the cured photochromic print to the PET fabric surface. While the ΔTwashed for prints cured at 300 mm s−1 with 1% lamp power remains nearly unchanged with a decrease of 0.1 °C, for prints transported at a belt speed of 50 mm s−1, the trend of the Tm as a function of lamp intensity changes after washing. Photochromic prints that underwent strongest curing at 80% of the maximum lamp power had almost no change in ΔTwashed (0.2 °C within the measurement error). Prints that have been cured at both 25% and 1% lamp intensity have a Twashed of 254.7 °C. This gives a ΔTwashed of 0.6 °C and 0.5 °C for lamp powers 25% and 1%, respectively. The result for the samples processed with 50 mm s−1 suggested that higher lamp power could increase the crosslinking density in the printed UV-ink.
Furthermore, the combination of Twashed and ΔTwashed assesses the durability of the functional layer with different crosslinking densities, e.g., the combination of high Twashed and small ΔTwashed gives an indication for a durable photochromic layer with high crosslinking density in the prints. Prints cured at 50 mm s−1 and 80% have the highest Twashed of 255.2 °C and a ΔTwashed of 0.2 °C. It implies that a higher polymer crosslinking density is achieved as the print creates a strong insulation layer on the PET surface. Prints cured with the lowest curing intensity, i.e. 300 mm s−1 and 1%, exhibit a lower polymer crosslinking density, but are durable and flexible as the Twashed is the lowest with 254.3 °C (with ΔTwashed of 0.1 °C).
As shown in Fig. 3(b), washing has an effect on the inkjet-printed samples cured at a belt speed of 50 mm s−1 and 80% lamp intensity from 1 to 10 printing passes. The slope of the linear fit of Twashed as a function of printing passes is slightly lower than the fit of Tm. However, changes in Twashed from 253.8 °C to 253.5 °C (ΔTwashed of 0.3 °C) for 3 passes and from 255.4 °C to 255.2 °C (ΔTwashed of 0.2 °C) for 10 passes are small (Fig. 3(b)).
The durability of the functional layer (ΔTwashed) related to process parameters can be confirmed by the difference in ΔK/S from colour measurements after washing. The samples produced at 300 mm s−1 and 1% exhibit 54.1% of the initial colour yield, whereas the sample produced at 50 mm s−1 and 80% preserves 55.5% of its initial colour after one wash. Both curing conditions show decent durability assuming that the colour performance is in linear relationship with the amount of UV-ink printed (remained) on the PET fabric surface. Furthermore, the weight of printed and washed functional layers is complimentary to DSC and colour measurements (ESI†). As shown in Fig. S5,† the samples produced with various amounts of ink deposition cured at 50 mm s−1 and 80% were weighed after printing and washing. The weight of the functional layer, with the exception of 1-pass prints (measured weight loss of 100%), decreased by an average of 23 ± 12%. The weight decrease is due to a loss of the photochromic print during washing, which correlates with the decreasing trends in Tm and ΔK/S.
The result confirms that a belt speed of 50 mm s−1 and lamp intensity of 80% are valid process parameters to obtain a durable functional layer with high crosslinking density in prints. In summary, both a belt speed of 300 mm s−1 and lamp intensity of 1% and a belt speed of 50 mm s−1 and lamp intensity of 80% can produce a durable functional layer but the latter results in a higher crosslinking density in prints. The Twashed of the photochromic prints on PET after one washing cycle reaches a mean value of 254.7 °C for all curing settings. Here, statistical analysis shows that differences in belt speed and lamp intensity are insignificant in regards to Tm and Twashed. Despite an increasing trend in crosslinking density with lower belt speeds and higher lamp powers, it can be assumed that stronger curing intensities than 300 mm s−1 and 1% are not more beneficial for the durability of the print.
Conclusions
The colour performance of a novel UV-curable and UV-responsive smart textile is optimized using the combination of two challenging functions of electromagnetic radiation, where high energy UV-rays both cure and activate UV-sensitive naphthopyran dye Ruby Red. Tuning of the crosslinking density of the photochromic ink and hence the dye kinetics using fabrication parameters is an important step towards the design of a textile UV-sensor. Irrespective of the deposited ink amount on the PET surface between 1 and 10 printing passes, curing with the highest belt speed of 300 mm s−1 combined with the lowest lamp intensity 1% of the pilot-scale inkjet printing system achieves high colour yields ΔK/S with 0.47 after printing and 0.25 after washing, fastest isomerization with kcolouration of 0.16 s−1 after printing and 0.11 s−1 after washing and good durability after washing with 54.1% of the initial ΔK/S, despite lowest polymer crosslinking density. The effect of the solid photopolymer resin compared to waterborne or solvent-based carriers for a photochromic dye, similar to Reversacol Ruby Red, applied on textiles results in slower switching rates between the coloured and uncoloured states, but faster than in mass-dyed and melt-spun fabrics. Our findings add to the general trend of enhancing switching rates between the different isomers of photochromic dyes, as well as the overall colour yield as a result of reduced rigidity of the polymer matrix. Via a new kinetic model, which takes a decay mechanism of the dye upon colour measurement into account, the colour performance can be predicted and tuned based on fabrication parameters. Beyond tuning of colour kinetics, the novel and industrially applicable approach of UV-LED curing of photochromic inkjet ink is favourable in regards to the flexibility, resource-efficiency and cost-effectiveness of the production process. Inkjet printing combined with UV-LED curing has large potential to trigger innovative products and to promote the small-batch production of functional high-end and smart textiles.Conflicts of interest
There are no conflicts to declare.Acknowledgements
This work was supported by Borås Stad, Sparbankstifelsen Sjuhärad, TEKO (The Swedish Textile and Clothing Industries Association) and SST (Stiftelsen Svensk Textilforskning).References
- A. Schwarz, L. Van Langenhove, P. Guermonprez and D. Deguillemont, Text. Prog., 2010, 42, 99–180 CrossRef.
- J. Wei, X. Jiao, T. Wang and D. Chen, J. Mater. Chem. C, 2015, 3, 7597–7603 RSC.
- D. Wen, Y. Liu, C. Yue, J. Li, W. Cai, H. Liu, X. Li, F. Bai, H. Zhang and L. Lin, RSC Adv., 2017, 7, 54741–54746 RSC.
- H. Liu, Y. Lv, S. Li, F. Yang, S. Liu, C. Wang, J.-Q. Sun, H. Meng and G.-G. Gao, J. Mater. Chem. C, 2017, 5, 9383–9388 RSC.
- D. Kathiravan, B.-R. Huang and A. Saravanan, J. Mater. Chem. C, 2017, 5, 5239–5247 RSC.
- M. Qin, Y. Huang, F. Li and Y. Song, J. Mater. Chem. C, 2015, 3, 9265–9275 RSC.
- J. C. Crano and R. J. Guglielmetti, Organic Photochromic and Thermochromic Compounds, Springer, New York, 2006 Search PubMed.
- A. F. Little and R. M. Christie, Color. Technol., 2011, 127, 275–281 Search PubMed.
- T. Feczkó, K. Samu, K. Wenzel, B. Neral and B. Voncina, Color. Technol., 2013, 129, 18–23 Search PubMed.
- M. Viková, PhD thesis, Heriot-Watt University, 2011.
- M. Aldib and R. M. Christie, Color. Technol., 2013, 129, 131–143 Search PubMed.
- M. Aldib and R. M. Christie, Color. Technol., 2011, 127, 282–287 Search PubMed.
- M. Viková, A. P. Periyasamy, M. Vik and A. Ujhelyiová, J. Text. Inst., 2016, 1–6, DOI:10.1080/00405000.2016.1251290.
- H. N. Doan, H. Tsuchida, T. Iwata, K. Kinashi, W. Sakai, N. Tsutsumi and D. P. Huynh, RSC Adv., 2017, 7, 33061–33067 RSC.
- M. Aldib, Color. Technol., 2015, 131, 172–182 Search PubMed.
- R. Fu, J. Shi, E. Forsythe and M. Srour, Opt. Eng., 2016, 55, 124105 CrossRef.
- M. M. El-Molla, Dyes Pigm., 2007, 74, 371–379 CrossRef.
- O. A. Hakeim, A. A. Arafa, M. K. Zahran and L. A. W. Abdou, Colloids Surf., A, 2014, 447, 172–182 CrossRef.
- M. B. V. Shukla, D. K. Singh and R. Shukla, Pigm. Resin Technol., 2004, 33, 272–279 CrossRef.
- R. Schwalm, L. Häußling, W. Reich, E. Beck, P. Enenkel and K. Menzel, Prog. Org. Coat., 1997, 32, 191–196 CrossRef.
- S. Agarwal, PhD thesis, Technical University Darmstadt, 2011.
- A. H. L. Lin, Pigm. Resin Technol., 2004, 33, 280–286 CrossRef.
- H. Bouas-Laurent and H. Dürr, Pure Appl. Chem., 2001, 73, 639 Search PubMed.
- G. Such, R. A. Evans, L. H. Yee and T. P. Davis, J. Macromol. Sci., Polym. Rev., 2003, 43, 547–579 CrossRef.
- F. Ercole, N. Malic, S. Harrisson, T. P. Davis and R. A. Evans, Macromolecules, 2010, 43, 249–261 CrossRef.
- N. Malic, J. A. Campbell and R. A. Evans, Macromolecules, 2008, 41, 1206–1214 CrossRef.
- K. Mutoh, Y. Kobayashi and J. Abe, Dyes Pigm., 2017, 137, 307–311 CrossRef.
- F. Ercole, T. P. Davis and R. A. Evans, Macromolecules, 2009, 42, 1500–1511 CrossRef.
- R. A. Evans, T. L. Hanley, M. A. Skidmore, T. P. Davis, G. K. Such, L. H. Yee, G. E. Ball and D. A. Lewis, Nat. Mater., 2005, 4, 249–253 CrossRef PubMed.
- M. Vik and M. Viková, A method and device for fatigue testing of photochromic, fluorescent or phosphorescent dyes, EP3077811A1, October 2016.
- M. Viková and M. Vik, Adv. Chem. Eng. Sci., 2011, 1, 224–230 CrossRef.
- P. Glöckner, Radiation Curing: Coatings and Printing Inks; Technical Basics, Applications and Trouble Shooting, Vincentz Network, Hannover, 2008 Search PubMed.
- C. Decker, Macromol. Rapid Commun., 2002, 23, 1067–1093 CrossRef.
- L. H. Peng, R. H. Guo, S. X. Jiang, J. W. Lan, Y. F. He and X. M. Huang, Fibers Polym., 2015, 16, 1312–1318 CrossRef.
- T. Feczkó, M. Kovács and B. Voncina, J. Photochem. Photobiol., A, 2012, 247, 1–7 CrossRef.
- M.-Q. Zhu, L. Zhu, J. J. Han, W. Wu, J. K. Hurst and A. D. Q. Li, J. Am. Chem. Soc., 2006, 128, 4303–4309 CrossRef PubMed.
- D. Mulligan, Cure Monitoring for Composites and Adhesives, Smithers Rapra Publishing, Shrewsbury, 2003 Search PubMed.
- A. P. Periyasamy, M. Vikova and M. Vik, Text. Prog., 2017, 49, 53–136 CrossRef.
- C. M. Sousa, J. Berthet, S. Delbaere, A. Polónia and P. J. Coelho, J. Org. Chem., 2015, 80, 12177–12181 CrossRef PubMed.
Footnote |
| † Electronic supplementary information (ESI) available. See DOI: 10.1039/c8ra05856c |
| This journal is © The Royal Society of Chemistry 2018 |

