 Open Access Article
Synthesis and photoluminescence characteristics of high color purity Ba3Y4O9:Eu3+ red-emitting phosphors with excellent thermal stability for warm W-LED application
Jia Liang,
Liangling Sun,
G. Annadurai,
Balaji Devakumar,
Shaoying Wang,
Qi Sun,
Jialei Qiao,
Heng Guo,
Bin Li and
Xiaoyong Huang *
*
College of Physics and Optoelectronics, Taiyuan University of Technology, Taiyuan 030024, P. R. China. E-mail: huangxy04@126.com
First published on 17th September 2018
Abstract
Single phase Eu3+-activated Ba3Y4O9 (Ba3(Y1−xEux)4O9) red-emitting phosphors with different Eu3+ doping concentrations were synthesized by a high temperature solid-state reaction method. The phase purity, crystal structure, photoluminescence properties, internal quantum efficiency, decay lifetimes, and thermal stability were investigated. Upon excitation at 396 nm near-ultraviolet light and 469 nm blue light, the Ba3(Y1−xEux)4O9 phosphors exhibited a strong red emission at 614 nm due to the 5D0 → 7F2 transition of Eu3+ ions. The optimal doping concentration of Eu3+ ions in Ba3(Y1−xEux)4O9 was found to be x = 0.25. Furthermore, the critical distance was calculated to be 12.78 Å and the energy transfer mechanism for the concentration quenching effect was determined to be quadrupole–quadrupole interaction. In addition, the Commission Internationale de I'Eclairage (CIE) chromaticity coordinates of Ba3(Y0.75Eu0.25)4O9 phosphors were measured to be (0.6695, 0.3302) which located at the red region, and significantly, the high color purity was about 97.9%. The as-synthesized phosphors also possessed excellent thermal stability and the activation energy was determined to be 0.29 eV. Therefore, the investigated results indicated that the Ba3Y4O9:Eu3+ phosphor may be a suitable candidate as a red phosphor for white light-emitting diodes under effective excitation at near-ultraviolet and blue light.
1. Introduction
During the past decades, frequency conversion using luminescent materials, which can convert incident radiation into desired wavelengths, has been widely applied in various fields, such as lighting, displays, bioimaging, sensors, and solar cells.1–6 In recent years, white light-emitting diodes (W-LEDs) have gradually replaced traditional incandescent and fluorescent lamps owing to their obvious advantages, such as high efficiency, low energy cost, environmental friendliness, and long lifetime.7–15 They are widely applied in residential lighting, automotive lighting, displays, and so on.16,17 For indoor illumination, the typical commercial W-LED is a combination of a blue InGaN LED chip with a yellow-emitting Y3Al5O12:Ce3+ phosphor. But the deficiency in the red region brings about a low color rendering index (CRI) and high correlated color temperature (CCT).18,19 In order to overcome the above defects, alternative W-LEDs have been developed using tricolor (red, green, and blue) phosphors pumped by near-ultraviolet (near-UV) LED chips.20,21 However, the current red phosphors like sulfides and oxysulfides (SrY2S4:Eu2+ (ref. 22) and Y2O2S:Eu3+ (ref. 23)) have poor chemical stability and are moisture insensitive. Recently, Eu2+-activated nitrides compounds (Ba2Si5N8:Eu2+ (ref. 24) and CaAlSiN3:Eu2+ (ref. 25)) have been synthesized as red-emitting phosphors to overcome the above mentioned problems,26 but the rigorous synthesis conditions such as high pressure, certain atmosphere, and high temperature restrict the practical applications. Therefore, it is significant to search novel red phosphors with excellent chemical stability, high-efficiency, good color purity, and especially high absorption in near-UV or blue wavelength region for W-LED application.Rare-earth ions activated inorganic materials have been investigated extensively on account of their narrow emission bands and excellent luminescent properties.27 Among them, the trivalent europium (Eu3+) ion is a significant activator. In many inorganic compounds, Eu3+ ion mainly shows an efficient bright red emission around 615 nm attributing to intra 4f forbidden 5D0 → 7F2 transition.28–30 Meanwhile, the oxide phosphors are more stable in comparison with sulfide phosphors. In the past few years, oxide based phosphors have been widely investigated as potential candidates for W-LEDs applications.31 Li et al. have studied the color-tunable Bi3+/Eu3+ co-doped Ba3Y4O9 phosphors; however, to our best knowledge, the Eu3+ single-doped BYO phosphors have not been reported and they may have better luminescence properties for further research. In this paper, we reported Ba3Y4O9:Eu3+ (BYO:Eu3+) red-emitting phosphors with superior thermal stability, internal quantum efficiency (IQE), and high color purity, which satisfied the potential application in fabrication of W-LEDs based on the near-UV/blue LED chip.
2. Experimental
2.1 Sample synthesis
The Ba3(Y1−xEux)4O9 (abbreviated as BYO:xEu3+; x = 0.10, 0.15, 0.20, 0.25, 0.30, 0.35, and 0.40) phosphors with different Eu3+ concentrations were synthesized via a conventional solid-state reaction route in an air atmosphere. Starting materials of BaCO3 (analytical reagent), Y2O3 (99.99%), and Eu2O3 (99.99%) were weighed according to stoichiometric ratio and then mixed thoroughly in an agate mortar. Subsequently, the obtained mixtures were transferred into the alumina crucibles and sintered at 1400 °C for 5 h in a furnace. Finally, when the samples cooled down slowly to room temperature, the obtained products were ground again into powders for further characterizations.2.2 Characterization
The X-ray diffraction (XRD) patterns of the as-prepared phosphors were recorded on Bruker D8 Advance diffractometer with Cu-Kα radiation (λ = 1.54056 Å). The morphology was analyzed by using a field-emission scanning electron microscope (FE-SEM; TESCAN MAIA3). The photoluminescence (PL) and photoluminescence excitation (PLE) spectra were examined by the Edinburgh FS5 spectrometer equipped with a 150 W continuous-wave xenon lamp. The IQE, decay curves, and temperature-dependent emission spectra of the samples were also measured by using the Edinburgh FS5 spectrometer equipped with an integrating sphere coated with barium sulfate, a pulsed xenon lamp, and a temperature controller.2.3 Fabrication of the W-LED device
The commercial blue phosphor BaMgAl10O17:Eu2+ (BAM:Eu2+), commercial green phosphor (Ba,Sr)2SiO4:Eu2+ and our red phosphor BYO:0.25Eu3+ were mixed thoroughly with silicone firstly, and then the obtained phosphor-silicone mixtures were coated on the surface of a 395 nm LED chip to fabricate a W-LED device. The fabricated device was driven by 3 V voltage and 60 mA current and the photoelectric properties of the device were measured by using an integrating sphere spectroradiometer system (HAAS2000, Everfine).3. Results and discussion
The XRD patterns of BYO:xEu3+ (x = 0.10, 0.15, 0.20, 0.25, 0.30, 0.35, and 0.40) phosphors were displayed in Fig. 1. It can be observed that all of the diffraction peaks were well-matched with the standard PDF#89-5891 card of Ba3Y4O9, and there was no other impurity phase. In addition, due to the similar ionic radii between Y3+ (r = 0.900 Å, CN = 6; CN is the coordination number) and Eu3+ (r = 0.947 Å, CN = 6) ions,32 there was no obvious shift in the diffraction peaks. The radius percentage difference between the dopants (Eu3+) and substituted ions (Y3+) can be calculated by the following equation:33
 | (1) |
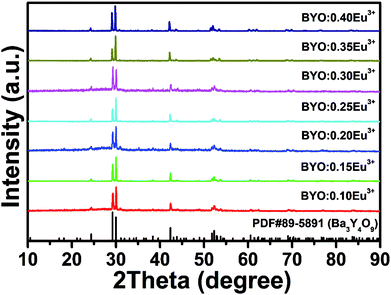 | ||
| Fig. 1 XRD patterns of BYO:xEu3+ (x = 0.10, 0.15, 0.20, 0.25, 0.30, 0.35, and 0.40) phosphors. The standard data of Ba3Y4O9 (PDF#89-5891) was shown as reference. | ||
Fig. 2(a) represents the Rietveld XRD refinement of Eu3+-activated BYO phosphors and the refined crystallographic parameters were summarized in Table 1. As shown, the experimental and calculated spectra were accordant with each other, indicating that the BYO compound belonged to trigonal system with R3 space group. Meanwhile, the cell parameters were a = b = 6.12099 Å, c = 25.2800(8) Å, and V = 820.258(35) Å3. Fig. 2(b) shows the crystal structure of BYO, it can be seen that there were four types of Y atom sites, named as Yn (n = 1, 2, 3, 4). All of the Y atoms were surrounded by 6 oxygen atoms to form octahedrons. In addition, there were three types of Ba atom sites in this crystal structure, defined as Ba1, Ba2, and Ba3, which were coordinated with 6, 6, and 3 oxygen atoms, respectively.34 Considering the same valence state, Eu3+ ions preferred to occupy Y3+ sites rather than Ba2+ sites, which were consistent with the previous results.
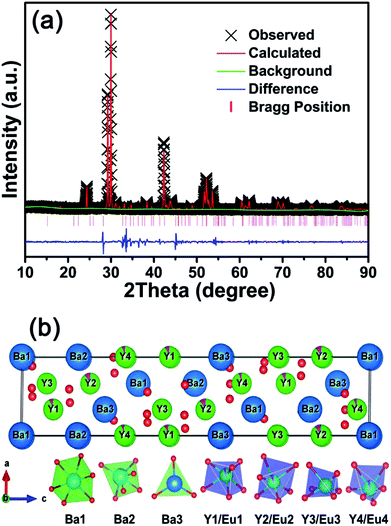 | ||
| Fig. 2 (a) Rietveld refinement of BYO:0.25Eu3+ phosphors. (b) Crystal structure of BYO:0.25Eu3+ phosphors. | ||
| Formula | BYO:0.25Eu3+ |
| Space group | R3 – trigonal |
| a | 6.12099 Å |
| b | 6.12099 Å |
| c | 25.2800(8) Å |
| α | 90° |
| β | 90° |
| γ | 120° |
| V | 820.258(35) Å3 |
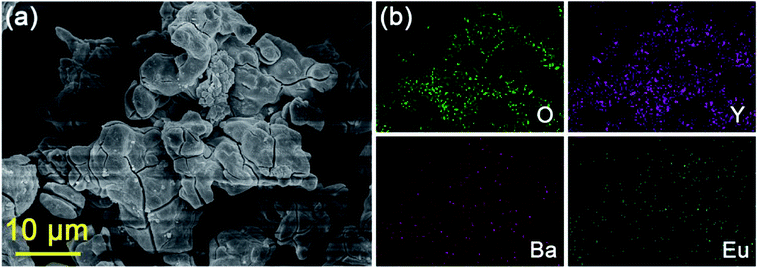
The representative FE-SEM image of BYO:0.25Eu3+ phosphors was shown in Fig. 3(a). The obtained compounds consisted of aggregated and irregular particles with the size of several micrometers. Moreover, as displayed in Fig. 3(b), elements of O, Y, Ba, and Eu were observed, and the elemental mapping results implied that the elements in BYO were evenly distributed over the whole particles.
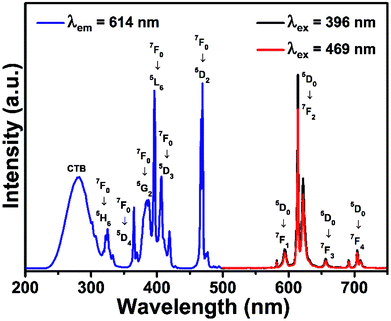
Since the optimal doping concentration was 0.25 mol, the representative PLE and PL spectra of BYO:0.25Eu3+ phosphors were shown in Fig. 4. The PLE spectrum contained a broad band and several sharp peaks when monitored at 614 nm. The broad band ranging from 250 to 300 nm was attributed to O2− → Eu3+ charge transfer band, which represented the electronic transition from 2p orbital of O2− to empty 4f orbital of Eu3+. Meanwhile, several sharp excitation peaks located at 325, 366, 387, 396, 407, and 469 nm were assigned to 7F0 → 5H6, 7F0 → 5D4, 7F0 → 5G2, 7F0 → 5L6, 7F0 → 5D3, and 7F0 → 5D2 transitions, respectively.35–37 Particularly, the excitation intensities of 7F0 → 5L6 (396 nm) and 7F0 → 5D2 (469 nm) transitions were almost equivalent. Because the energy of near-UV light was larger than that of blue light, under the same situation, the PL intensity of BYO:0.25Eu3+ phosphors upon 396 nm excitation was stronger than that upon 469 nm, as shown in the PL spectra. The emission bands peaking at 594, 614, 656, and 704 nm were ascribed to 5D0 → 7FJ (J = 1, 2, 3, and 4) transitions of Eu3+ ions.38–40 Besides, the shape profiles of peaks had no variation except a slight change in PL intensity under the excitation of 396 and 469 nm, and also the strongest peak at 614 nm was ascribed to the 5D0 → 7F2 transition.
The magnetic dipole (MD) 5D0 → 7F1 transition (594 nm) is insensitive to the distortion of the inversion symmetry, and inversely the electric dipole (ED) 5D0 → 7F2 transition (614 nm) is hypersensitive.41 To evaluate the site symmetry of Eu3+ ions, the integrated PL intensity ratio (asymmetry ratio) (5D0 → 7F2)/(5D0 → 7F1) suggests the degree of distortion.42 In our case, the ED (614 nm) 5D0 → 7F2 transition was stronger than the MD (594 nm) 5D0 → 7F1 transition. The asymmetry ratio value of BYO:0.25Eu3+ was calculated to be 3.54, and others with different doping concentrations were listed in Table 2. This result revealed that the Eu3+ ions primarily occupied the non-inversion symmetry lattice sites in BYO host material.
| Eu3+ concentration | Asymmetry ratio | CIE coordinates (x, y) | Color purity |
|---|---|---|---|
| 0.10 | 3.36 | (0.6662, 0.3335) | 97.0% |
| 0.15 | 3.50 | (0.6682, 0.3316) | 97.5% |
| 0.20 | 3.48 | (0.6689, 0.3308) | 97.7% |
| 0.25 | 3.54 | (0.6695, 0.3302) | 97.9% |
| 0.30 | 3.41 | (0.6685, 0.3312) | 97.6% |
| 0.35 | 3.40 | (0.6678, 0.3320) | 97.4% |
| 0.40 | 3.24 | (0.6662, 0.3335) | 97.0% |
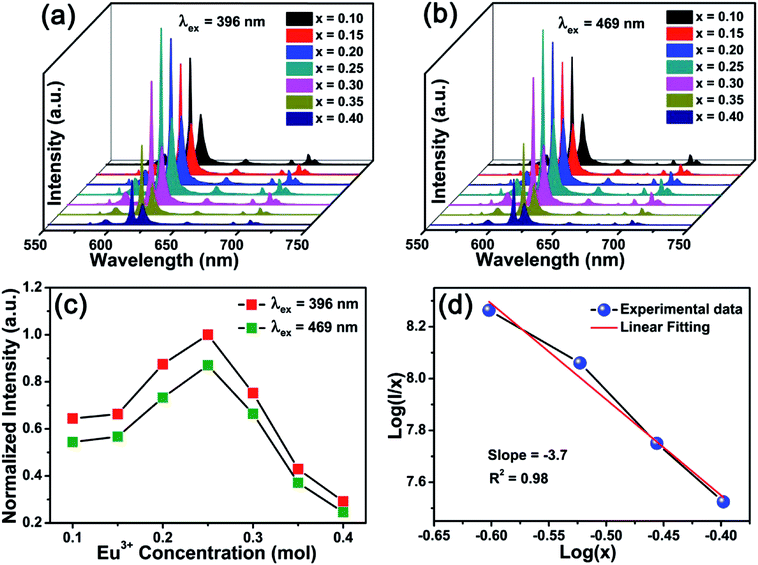
Fig. 5(a) and (b) present the PL spectra of BYO:xEu3+ phosphors with different doping concentrations under the excitation of 396 and 469 nm, respectively. It can be seen that the contours of the PL spectra hardly varied with the increase of the Eu3+ concentration. The normalized PL intensities of BYO:xEu3+ phosphors as functions of Eu3+ concentrations under the excitation of 396 and 469 nm were displayed in Fig. 5(c). It was clearly found that the overall intensities under 469 nm excitation were slightly weaker than that under 396 nm excitation. These results indicated that the BYO:xEu3+ phosphors can be effectively pumped with near-UV and blue LED chips. Moreover, the PL intensity gradually enhanced when Eu3+ ions concentration increased, then it reached a maximum at x = 0.25. Subsequently, when x was further increased, the PL intensity decreased due to the concentration quenching effect, which was triggered by the nonradiative energy transfer among the nearest Eu3+ ions.43 According to the theory proposed by Blasse,44 the concentration quenching mechanism can be determined by the critical distance (Rc) of Eu3+ ions. If Rc is larger than 5 Å, the electric multipolar interaction will lead to the concentration quenching phenomenon, otherwise it will be the exchange interaction. Therefore, it's necessary to calculate Rc via the following formula:44
 | (2) |
 | (3) |
The energy level diagram of Eu3+ ions was presented in Fig. 6(a) to demonstrate the energy transfer process. Upon the excitation of near-UV (396 nm) and blue (469 nm) light, the electrons at ground state (7F0) transited to the higher excited states 5L6 and 5D2, then relaxed to lower excited state (5D0) level through nonradiative transition. Subsequently, the lower excited state electrons returned to 7FJ (J = 1, 2, 3, and 4) levels, resulting in four characteristic emissions due to the 5D0 → 7FJ transitions, as shown in Fig. 6(a).
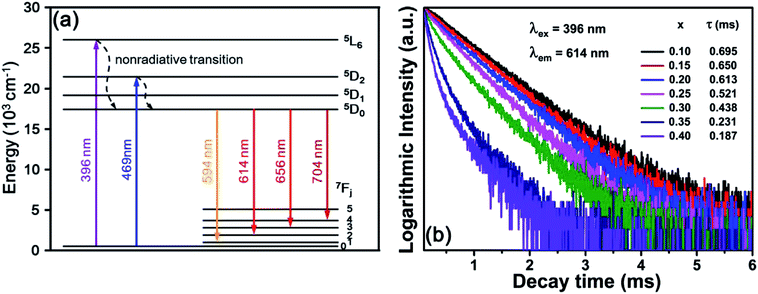 | ||
| Fig. 6 (a) Energy level diagram of Eu3+ ions. (b) Decay curves of BYO:xEu3+ phosphors excited at 396 nm and monitored at 614 nm. | ||
Fig. 6(b) shows the room-temperature decay curves of 614 nm red emission in BYO:xEu3+ phosphors with different Eu3+ concentrations under the excitation of 396 nm. It's necessary to calculate the decay lifetimes and all the decay curves can be well fitted with the double-exponential equation:47
I(t) = A1![[thin space (1/6-em)]](https://www.rsc.org/images/entities/char_2009.gif) exp(−t/τ1) + A2 exp(−t/τ1) + A2![[thin space (1/6-em)]](https://www.rsc.org/images/entities/char_2009.gif) exp(−t/τ2) exp(−t/τ2)
| (4) |
| τs = (A1τ12 + A2τ22)/(A1τ1 + A2τ2) | (5) |
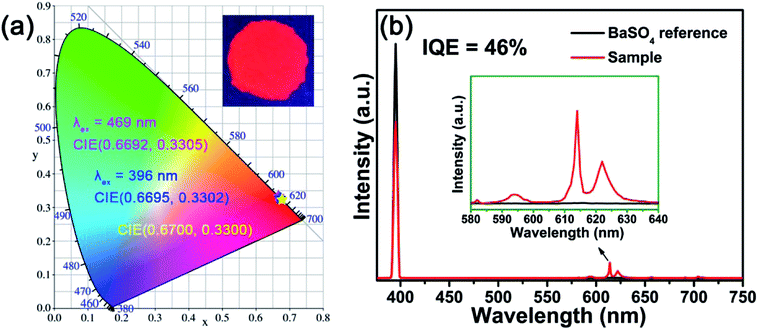
The CIE chromaticity coordinates are crucial factors to evaluate the luminescent properties of phosphors. Fig. 7(a) illustrates the CIE chromaticity diagram of BYO:0.25Eu3+ phosphors. According to the PL spectra, the CIE chromaticity coordinates of BYO:xEu3+ phosphors (λex = 396 nm) with various Eu3+ concentrations were summarized in Table 2. The green and blue asterisks in Fig. 7(a) represented the locations of CIE chromaticity coordinates of BYO:0.25Eu3+ phosphors under the excitation of 396 and 469 nm, respectively. The corresponding chromaticity coordinates were calculated to be (0.6695, 0.3302) and (0.6692, 0.3305), which were very close to that of the standard red light (0.6700, 0.3300).42 Furthermore, it can be clearly seen from Fig. 7(a) that the both points basically coincided with each other, indicating that the phosphors can be excited efficiently by both near-UV and blue light from another point of view. The color purity was further investigated as follows:
 | (6) |
Another key factor to assess the application of the phosphors is IQE. Fig. 7(b) depicts the IQE of the BYO:0.25Eu3+ red-emitting phosphors and the value of IQE can be obtained by the following equation:45
 | (7) |
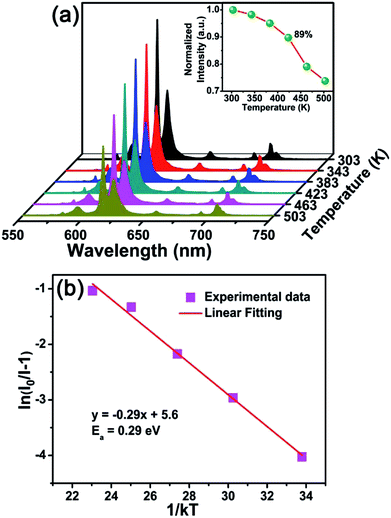
Fig. 8(a) shows the temperature-dependent PL spectra of BYO:0.25Eu3+ phosphors excited at 396 nm. As the temperature increased from 303 K to 503 K, the PL intensity decreased gradually due to the thermal quenching effect. The normalized PL intensity of BYO:0.25Eu3+ phosphors as a function of temperature was depicted in the inset of Fig. 8(a). As shown, the PL intensity at 423 K remained about 89% relative to its initial value at 303 K, which was higher than that of other reported Eu3+ doped phosphors, such as Ca3Gd(AlO)3(BO3)4:Eu3+ (84%) and Na3Sc2(PO4)3:Eu3+ (73.4%),33,52 indicating that the phosphors had a splendid thermal stability. Moreover, another parameter, activation energy was used to evaluate the thermal property according to the Arrhenius equation:53
 | (8) |
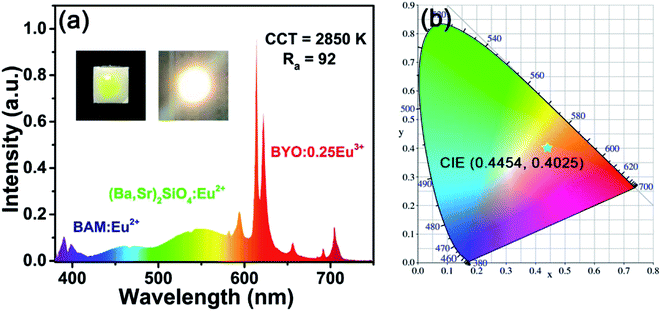
For further testing the application of BYO phosphors in W-LEDs, a W-LED device was fabricated based on 395 nm near-UV chip, commercial (Ba,Sr)2SiO4:Eu2+ green-emitting phosphors, commercial BAM:Eu2+ blue-emitting phosphors, and as-prepared BYO:0.25Eu3+ red-emitting phosphors. As disclosed in Fig. 9, under 60 mA current and 3 V voltage, the device gave bright warm white light with high CRI (92) and low CCT (2850 K). The CIE chromaticity coordinates of the W-LED device were (0.4454, 0.4025), which located at warm white range. The above results further demonstrated that the Eu3+-activated BYO phosphors had potential application for warm W-LEDs.
4. Conclusion
In summary, the BYO:xEu3+ red phosphors were synthesized via a conventional solid-state reaction. The BYO:xEu3+ phosphors which can be effectively excited at 396 nm (near-UV) and 469 nm (blue) exhibited an intense red emission around 614 nm. The optimal concentration of Eu3+ was x = 0.25. Furthermore, the CIE chromaticity coordinates of BYO:0.25Eu3+ phosphors were (0.6695, 0.3302) and the value of IQE reached up to 46%. Meanwhile, the BYO:0.25Eu3+ phosphors also exhibited high thermal stability due to the fact that their PL intensity at 423 K maintained 89% of its starting value at 303 K and the activation energy was up to 0.29 eV. And in addition, a warm W-LED device with excellent properties was fabricated with the help of a 395 nm chip, as-prepared BYO:0.25Eu3+ red phosphors, commercial (Ba,Sr)2SiO4:Eu2+ green-emitting phosphors, and commercial BAM:Eu2+ blue-emitting phosphors. All of the obtained results suggested that our BYO:xEu3+ phosphors were promising candidates for warm W-LEDs application pumped by both near-UV and blue light.Conflicts of interest
There are no conflicts to declare.Acknowledgements
This work was supported by the National Natural Science Foundation of China (No. 51502190), the Program for the Outstanding Innovative Teams of Higher Learning Institutions of Shanxi, and the Open Fund of the State Key Laboratory of Luminescent Materials and Devices (South China University of Technology, No. 2017-skllmd-01).References
- L. Xi, Y. Pan, S. Huang and G. Liu, RSC Adv., 2016, 6, 76251–76258 RSC.
- M. Jiao, Q. Xu, C. Yang and H. You, RSC Adv., 2017, 7, 28647–28654 RSC.
- Y. Hua, D. Zhang, H. Ma, D. Deng and S. Xu, RSC Adv., 2016, 6, 113249–113259 RSC.
- V. Kumar, S. Som, S. Dutta, S. Das and H. C. Swart, RSC Adv., 2016, 6, 84914–84925 RSC.
- X. Huang, J. Liang, B. Li, L. Sun and J. Lin, Opt. Lett., 2018, 43, 3305–3308 CrossRef PubMed.
- L. Li, Y. Pan, Z. Chen, S. Huang and M. Wu, RSC Adv., 2017, 7, 14868–14875 RSC.
- W. Ran, H. M. Noh, B. K. Moon, S. H. Park, J. H. Jeong, J. H. Kim, G. Liu and J. Shi, J. Lumin., 2018, 197, 270–276 CrossRef.
- X. Huang, Nat. Photonics, 2014, 8, 748–749 CrossRef.
- B. Wang, H. Lin, J. Xu, H. Chen and Y. Wang, ACS Appl. Mater. Interfaces, 2014, 6, 22905–22913 CrossRef PubMed.
- W. Wang, Y. Jin, S. Yan, Y. Yang, Y. Liu and G. Xiang, Ceram. Int., 2017, 43, 16323–16330 CrossRef.
- D. Chen, Y. Zhou and J. Zhong, RSC Adv., 2016, 6, 86285–86296 RSC.
- J. Zhang, X. Zhang, J. Zhang, W. Ma, X. Ji, S. Liao, Z. Qiu, W. Zhou, L. Yu and S. Lian, J. Mater. Chem. C, 2017, 5, 12069–12076 RSC.
- J. Li, Q. Liang, J. Y. Hong, J. Yan, L. Dolgov, Y. Meng, Y. Xu, J. Shi and M. Wu, ACS Appl. Mater. Interfaces, 2018, 10, 18066–18072 CrossRef PubMed.
- J. Li, J. Yan, D. Wen, W. U. Khan, J. Shi, M. Wu, Q. Su and P. A. Tanner, J. Mater. Chem. C, 2016, 4, 8611–8623 RSC.
- Y. Guo, B. K. Moon, B. C. Choi, J. H. Jeong and J. H. Kim, RSC Adv., 2017, 7, 23083–23092 RSC.
- Z. Cheng, J. Yu, Y. Zhang and N. Zou, J. Lumin., 2017, 192, 1004–1009 CrossRef.
- K. Park, H. Kim and D. A. Hakeem, Dyes Pigm., 2017, 136, 70–77 CrossRef.
- X. Ding, G. Zhu, W. Geng, Q. Wang and Y. Wang, Inorg. Chem., 2016, 55, 154–162 CrossRef PubMed.
- Y. Feng, J. Huang, C. Li, G. Hu, J. Liu and X. Yu, J. Alloys Compd., 2017, 706, 478–484 CrossRef.
- X. Fu, W. Lu, M. Jiao and H. You, Inorg. Chem., 2016, 55, 6107–6113 CrossRef PubMed.
- Y. Li, Z. Zhao, Z. Song, R. Wan, J. Qiu, Z. Yang, Z. Yin, X. Liu, Q. Liu and Y. Zhou, J. Am. Ceram. Soc., 2015, 98, 2170–2176 CrossRef.
- K. Tian, S. Lian, D. Yin, C. Li, A. Zhu and H. Zhang, Rare Met., 2006, 30, 639–644 Search PubMed.
- C. Guo, L. Luan, C. Chen, D. Huang and Q. Su, Mater. Lett., 2008, 62, 600–602 CrossRef.
- S. A. Khan, N. Z. Khan, Z. Hao, W. W. Ji, H. Abadikhah, L. Hao, X. Xu and S. Agathopoulos, J. Alloys Compd., 2018, 730, 249–254 CrossRef.
- K. Uheda, N. Hirosaki, Y. Yamamoto, A. Naito, T. Nakajima and H. Yamamoto, Electrochem. Solid-State Lett., 2006, 9, H22–H25 CrossRef.
- Y. Jin, Y. Fu, Y. Hu, L. Chen, H. Wu, G. Ju, M. He and T. Wang, Powder Technol., 2016, 292, 74–79 CrossRef.
- F. B. Dejene, J. Lumin., 2018, 199, 433–441 CrossRef.
- Y. Zhang, Y. Li and Y. Yin, J. Alloys Compd., 2005, 400, 222–226 CrossRef.
- X. Huang, H. Guo and B. Li, J. Alloys Compd., 2017, 720, 29–38 CrossRef.
- B. Li, X. Huang, H. Guo and Y. Zeng, Dyes Pigm., 2018, 150, 67–72 CrossRef.
- X. Huang, B. Li and H. Guo, J. Alloys Compd., 2017, 695, 2773–2780 CrossRef.
- Q. Zeng, H. Liang, M. Gong and Q. Su, J. Electrochem. Soc., 2008, 155, H730–H733 CrossRef.
- H. Guo, X. Huang and Y. Zeng, J. Alloys Compd., 2018, 741, 300–306 CrossRef.
- H. Wu, Z. Hao, L. Zhang, X. Zhang, Y. Xiao, G. Pan, H. Wu, Y. Luo, L. Zhang and J. Zhang, J. Mater. Chem. C, 2018, 6, 3459–3467 RSC.
- X. Zhang, M. Chen, J. Zhang, X. Qin and M. Gong, Mater. Res. Bull., 2016, 73, 219–225 CrossRef.
- L. Li, W. Chang, W. Chen, Z. Feng, C. Zhao, P. Jiang, Y. Wang, X. Zhou and A. Suchocki, Ceram. Int., 2017, 43, 2720–2729 CrossRef.
- Q. Liu, L. Wang, W. Huang, L. Zhang, M. Yu and Q. Zhang, J. Alloys Compd., 2017, 717, 156–163 CrossRef.
- J. Hou, X. Yin, F. Huang and W. Jiang, Mater. Res. Bull., 2012, 47, 1295–1300 CrossRef.
- Q. Liu, L. Wang, W. Huang, X. Li, M. Yu and Q. Zhang, Ceram. Int., 2017, 43, 16292–16299 CrossRef.
- X. Lu, H. Liu, X. Yang, Y. Tian, X. Gao, L. Han and Q. Xu, Ceram. Int., 2017, 43, 11686–11691 CrossRef.
- T.-C. Chien, C.-S. Hwang, Y.-T. Nien and M. Yoshimura, Ceram. Int., 2017, 43, 9437–9442 CrossRef.
- A. K. Vishwakarma, K. Jha, M. Jayasimhadri, A. S. Rao, K. Jang, B. Sivaiah and D. Haranath, J. Alloys Compd., 2015, 622, 97–101 CrossRef.
- Z. Zhou, J. Zheng, R. Shi, N. Zhang, J. Chen, R. Zhang, H. Suo, E. M. Goldys and C. Guo, ACS Appl. Mater. Interfaces, 2017, 9, 6177–6185 CrossRef PubMed.
- G. Blasse, Phys. Lett. A, 1968, 28, 444–445 CrossRef.
- K. Li, H. Z. Lian, M. M. Shang and J. Lin, Dalton Trans., 2015, 44, 20542–20550 RSC.
- D. L. Dexter, J. Chem. Phys., 1953, 21, 836–850 CrossRef.
- X. Wu, Y. Jiao, O. Hai, Q. Ren, F. Lin and H. Li, J. Alloys Compd., 2018, 730, 521–527 CrossRef.
- A. Fu, L. Zhou, S. Wang and Y. Li, Dyes Pigm., 2018, 148, 9–15 CrossRef.
- L. Lakshmi Devi and C. K. Jayasankar, Ceram. Int., 2018, 44, 14063–14069 CrossRef.
- P. Du, X. Huang and J. S. Yu, Chem. Eng. J., 2018, 337, 91–100 CrossRef.
- X. Huang, B. Li, H. Guo and D. Chen, Dyes Pigm., 2017, 143, 86–94 CrossRef.
- B. Li, S. Wang, Q. Sun, C. Lu, H. Guo and X. Huang, Dyes Pigm., 2018, 154, 252–256 CrossRef.
- S. A. Arrhenius, Z. Phys. Chem., 1889, 4, 96–116 Search PubMed.
| This journal is © The Royal Society of Chemistry 2018 |

