 Open Access Article
A ZnO/rice husk-based hollow carbonaceous nanosphere composite as an anode for high-performance lithium-ion batteries
Yi Lia,
Yan Gaoa,
Hui Qib,
Kaifeng Yu *a and
Ce Liang
 *a
*a
aKey Laboratory of Automobile Materials, Ministry of Education, College of Materials Science and Engineering, Jilin University, Changchun 130025, PR China. E-mail: yukf@jlu.edu.cn; liangce@jlu.edu.cn
bThe Second Hospital of Jilin University, Changchun 130041, PR China
First published on 25th September 2018
Abstract
ZnO is considered as a substitute for the next generation of lithium ion battery anode materials because of its high volumetric energy density and abundant resources. In this work, we fabricate a new material that has nanorod-like ZnO distributed in a disorderly fashion on the surface of a rice husk-derived carbon skeleton. Rice husk as a carbon source is suitable for easing the pressure on the environment and improving the utilization of agricultural residues. Its unique interconnected hollow nanosphere structured skeleton provides better support for ZnO loading and electron transport. The ZnO/rice husk-based carbonaceous nanosphere composite samples were characterised by XRD, Raman, SEM and TEM. When used as an anode for lithium-ion batteries, the material exhibited promising Li storage properties and a high specific charge capacity of 920 mA h g−1 at 0.2C after 100 cycles.
1. Introduction
Lithium-ion batteries (LIBs) have gradually replaced the traditional battery because of their unique advantages such as high specific capacity, high operating voltage and environmentally friendly properties. With the extensive application of electric vehicles and the rapid development of high-tech, traditional energy storage devices have been unable to meet the requirements of the market. In order to develop new high-performance LIB anodes, transition metal oxide (TMO) materials based on alloying reactions, with high theoretical capacity, have been studied extensively in the past few years. Among the TMO anodes, ZnO has received much attention as it possesses a theoretical capacity as high as 978 mA h g−1. ZnO will transform to Zn upon redox reaction with Li+ (ZnO + 2Li+ + 2e− ↔ Zn + Li2O),1 and the following LixZn is formed by the alloying reaction (Zn + xLi+ + xe− ↔ LixZn (x ≤ 1)).1 However, because of its high working potential, the structure of ZnO is easily broken down when a large volume change happens in the Li+ insertion/extraction process. Moreover, the destruction of the electrode structure results in relatively fast capacity attenuation. To overcome this problem, ZnO has been made with different morphologies with nanocrystallization and unique structures such as hierarchical flower-like ZnO nanospheres, a dumbbell like well-defined ZnO mesostructure, ultrathin ZnO nanotubes with well-organized hexagonal nanowalls and ZnO yolk–shell nanospheres have been established.2–5 These morphologies improve the electrochemical active area and guarantee good stability. In addition, another well-accepted method is to use fine assemblies of ZnO and carbon as LIB anodes, which obtain synergistic effects by combining the excellent conductivity of carbon and the high theoretical capacity of TMOs.6 Song et al. successfully synthesized hollow metal–organic framework-derived porous ZnO/C nanocages as anode materials for LIBs, which retained a high reversible capacity of 750 mA h g−1 after 100 cycles.7 S. M. Abbas et al. prepared a hexagonal disk-shaped ZnO/CNT composite as an anode material for LIBs and the reversible capacity stabilized at 602 mA h g−1 after 50 cycles.8 Shen et al. synthesized ZnO-loaded/porous carbon composites that displayed an outstanding reversible capacity of 653.7 mA h g−1 after 100 cycles.9Carbon is one of the most representative LIB anode materials. Nowadays, much effort is devoted to the study of biomass carbon materials, such as peanut shell,10 starch and oak,11 lignin, cotton,12 wool,13 rice husk and sugar.14 The development of new renewable energy sources is an effective way to solve environmental problems instead of burning agricultural waste in fields leading to air and soil pollution. The interiors of biomass materials, through activation, can be used to produce a large amount of microporous and mesoporous structures owing to their natural pores and activity. Of the various kinds of biomass materials, rice husk (RH) is one of the major by-products of the agricultural industry with an amazing amount of ∼2.9 × 10⁷ t produced per year all over the globe.15 RH is light, bulky, and highly porous and is mainly composed of cellulose (38%), lignin (22%), hemicellulose (18%) and SiO2.16 This unique structure results in a distinct skeleton and pores in the conversion of organic matter to polymer compounds.17 Porous carbon prepared from rice husk has been gradually applied to industrial production. Y. Gao et al. employed porous carbon made from rice husk as an electrode material for an electrochemical double layer capacitor. The material showed high-power handling ability and electrochemical cycle performance, and after 30![[thin space (1/6-em)]](https://www.rsc.org/images/entities/char_2009.gif) 000 cycles the capacitive value remained almost unchanged.18 A biomass carbon material prepared with RH has been successfully used for the anode electrode of LIBs. Yu et al.19 synthesized a novel carbonaceous material with an interconnected hollow nanospheres structure, and the reversible specific capacity stabilized at 489 mA h g−1 after 100 cycles at a rate of 0.2C (1C refers to the current of the rated capacity of the battery).
000 cycles the capacitive value remained almost unchanged.18 A biomass carbon material prepared with RH has been successfully used for the anode electrode of LIBs. Yu et al.19 synthesized a novel carbonaceous material with an interconnected hollow nanospheres structure, and the reversible specific capacity stabilized at 489 mA h g−1 after 100 cycles at a rate of 0.2C (1C refers to the current of the rated capacity of the battery).
In recent years, hollow structures have received great attention in the general synthesis of active materials because of their unique properties in LIBs such as high surface-to-volume ratios, and excellent thermal and chemical stabilities.20–23 Inspired by this proposal, we herein report a facile and convenient way to fabricate ZnO nanorods connected to the surface of an amorphous carbon skeleton prepared from RH-cellulose (RHC). In pretreatment, the silica and lignin were removed by alkali treatment and acid treatment, and the as-prepared cellulose had a large number of functional groups on its surface, which were connected to ZnO nanorods by electrostatic interactions under hydrothermal conditions. This material was expected to have a large surface and high capacity. This work may provide a general approach for preparing TMOs and RHC composites.
2. Experimental
2.1. Material preparation
The reagents, zinc acetate (Zn(OAc)2), cetyltrimethylammonium (CTAB), sodium hydroxide (NaOH), ethylenediamine (EDA), and ethanol used in the experiments were of analytical grade. Rice husks (RH) were obtained as a by-product of rice harvested from Changchun, Jilin province, China.2.2. Preparation of ZnO
First, 0.11 g Zn(OAc)2, 0.18 g CTAB, 0.04 g NaOH, and 0.07 ml EDA were dissolved in 10 ml of ethanol respectively with constant magnetic stirring for 10 min, and then the CTAB, NaOH and EDA solutions were added to the stirred Zn(OAc)2 solution sequentially, and the solution was continuously stirred for 30 min and hydrothermally treated at 180 °C for 6 h. The white product was collected and washed with deionized water several times. After this, it was finally dried at 60 °C for 12 h, and ZnO was obtained.2.3. Preparation of RHC/ZnO
2 g RH was washed with deionized water and dried. Then, it was transferred into a 50 ml Teflon-lined stainless steel autoclave with 2 M NaOH and kept at 180 °C for 12 h. After cooling, the precipitates were taken out and washed with deionized water to ensure a neutral pH, and then refluxed with 2 M HCl at 80 °C for 2 h. When the pH of the solution was adjusted to neutral with deionized water, the solution (RHC and ZnO) was transferred to a Teflon-lined stainless steel autoclave, and maintained at 200 °C for 24 h. After cooling down to room temperature, the precipitates were collected by centrifugation, washed with ethanol, and dried at 60 °C for 6 h. Finally the composite was calcinated in an Ar atmosphere at 500 °C with a heating rate of 5 °C min−1 for 3 h. The as-obtained product was denoted RHC/ZnO.2.4. Characterization and electrochemical properties
The crystal structure of the samples was determined using XRD with a Siemens D5000 X-ray Diffractometer with nickel-filtered Cu Kα radiation. The structure and morphology of RHC/ZnO were observed by energy dispersive spectrometry (EDS) and field emission scanning electron microscopy (JEOL JSM-6700F). The microstructures and morphologies of the samples were investigated with transmission electron microscopy (TEM). Raman spectra were recorded on a Renishaw inVia instrument.2.5. Electrochemical characterization
The working electrode was prepared by mixing 80 wt% active material with 10 wt% acetylene black and 10 wt% polyvinylidene difluoride (PVDF) to form a homogenous slurry. The slurry was coated on copper foil disks and dried 12 h in a vacuum oven at 120 °C. The CR2025 coin cells were assembled in an Ar-filled glovebox with Celgard polypropylene as a separator. Galvanostatic charge and discharge tests were performed at room temperature on a LAND CT-2001 battery tester, while extraction tests were carried out between 0.01 V and 3 V. Cyclic voltammetry (CV) and electrochemical impedance spectroscopy (EIS) tests were performed on a CH650D electrochemical workstation. CV tests were carried out at a scan rate of 0.1 mV s−1 within a test voltage range of 0–3 V. EIS measurements were performed over a frequency range between 100 kHz and 0.1 Hz with an applied voltage of 5 mV.3. Results and discussion
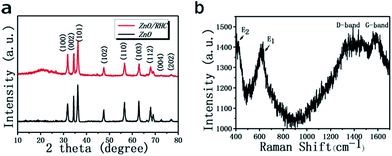
Fig. 1a shows XRD patterns of the ZnO and the ZnO/RHC composite. The diffraction peaks appearing at 31.80°, 34.48°, 36.21°, 47.64°, 56.60°, 62.86°, 66.45°, 68.00°, 69.04°, 72.70° and 77.00°, correspond to (100), (002), (101), (102), (110), (103), (200), (112), (201), (004) and (202), which can be indexed as the wurtzite phase of hexagonal ZnO (JCPDS no. 36-1451). The diffraction peaks of ZnO are sharp and intense, indicating its highly crystalline nature. No impurity peaks are observed, confirming the high purity of the products. It should be noted that the broad peak at ca. 20° observed for ZnO/RHC corresponds to amorphous carbon, and there is no impurity in the composite.In order to confirm the presence of well-graphitized carbon in the RHC/ZnO composite, Raman spectroscopic investigations were also conducted. As shown in Fig. 1b, the E1 (LO) mode (ca. 610 cm−1) is attributed to structural defects of ZnO, and the peak (440 cm−1) corresponds to the E2 (high) mode which is a characteristic of the hexagonal wurtzite phase. Peaks at 1380 cm−1 and 1595 cm−1 are also observed, which could be assigned to the presence of the D band and G band. The D band is for sp3 defects or disorder in carbon.24 The G band corresponds to in-plane vibrations of sp2-bonded carbon atoms.25 The disorder degree of the amorphous material and the average size of the sp2 domains were measured by the ID/IG intensity ratio.26 The ratio of RHC/ZnO was calculated to be 0.86, which corresponds to an increasing degree of ordered sp2 bonded carbon and a decreasing number of defects and vacancies due to the ZnO compound nanoparticles on the carbon matrix.
The detailed structures of ZnO and ZnO/RHC are shown in Fig. 2. It is clearly displayed in Fig. 2(a) and (b) that most ZnO nanorods are disorderly and unsystematic and are anchored on the amorphous three-dimensional skeleton. A high magnification FESEM image of the sample reveals that RHC with an amorphous stereoscopic structure is connected to {11−20} plane surfaces of the ZnO nanorods. When zooming in, a large number of small ZnO particles with diameters of 20 nm can be observed. These small sizes are favorable to lithium ion intercalation/deintercalation.27 The three-dimensional skeleton of RHC can buffer the volume expansion of ZnO nanorods and improve the stability of the ZnO/RHC composite. Obviously, the particles of pure ZnO are found to be nanorod crystals, as shown in Fig. 2(d) and (e), with an average diameter of 20 nm and a length of 100 nm. From the SEM-mounted EDS spectrum in Fig. 2(f), we can see that only C, O and Zn exist in the composite. The highest peak of the EDS is the measurement of silicon negative film. Although the determination of the carbon content by EDS has high uncertainty due to its low atomic weight,28 combined with the XRD, it still can indicate that ZnO nanorods have been successfully embedded in the surface of the carbon matrix.
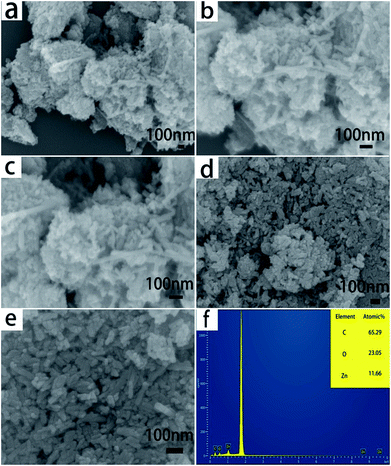 | ||
| Fig. 2 (a–c) The FESEM images of ZnO/RHC. (d and e) The FESEM images of ZnO. (f) The SEM-mounted EDS spectrum. | ||
In order to determine the crystal growth behavior, the ZnO nanorods grown on the surface of an amorphous carbon block were further characterized by TEM and HRTEM. As can be seen from Fig. 3a and b, the nanorod-like ZnO is well dispersed on the surface of the three-dimensional amorphous skeleton composed of many hollow nanostructures of carbon spheres. The sizes of the carbon hollow nanospheres with diameters ranging from 20 to 150 nm are interconnected closely. The insets of (b) and (c) are partial enlarged views of the hollow carbon spheres. This hollow structure provides a greater contact area for the electrode material and the electrolyte, accelerating the transfer of electrons and lithium ions, while providing protection for the volume change of ZnO. The HRTEM image of ZnO/RHC (Fig. 3d) reveals that the lattice fringes of ZnO display interplanar spacings of 0.26 nm in the particles, which match well respectively with those of the (002) planes of hcp ZnO. Fig. 3e shows a typical TEM image of the synthesized ZnO nanorods, which are of a hexagonal crystal system. Most of the nanorods have straight sides and regular ends. A particle count taken from many such images, obtained from different regions of the sample, confirmed the presence of an essentially monodispersed arrangement. The SAED pattern (Fig. 3f) depicts the observed lattice fringes with lattice distances of 0.2785 nm, 0.2477 nm, 0.2024 nm and 0.1437 nm, which correspond to the (100), (101), (102), and (200) facets of the ZnO polycrystalline phase.29 This is consistent with the XRD and Raman analysis.
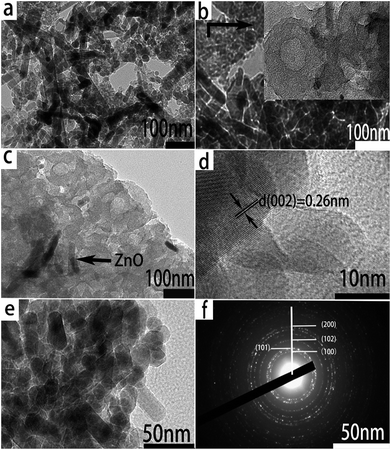 | ||
| Fig. 3 (a and b) TEM images of the RHC/ZnO. (c and d) HR-TEM images of the RHC/ZnO. (e) TEM image of ZnO. (f) SAED pattern of RHC/ZnO. | ||
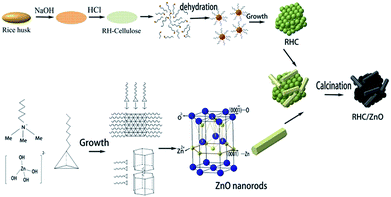
Fig. 4 illustrates the formation of RHC/ZnO. First, silica and lignin are removed from the RH in a high-temperature alkaline solution, and after acid treatment, cellulose is obtained. Then, during a hydrothermal carbonization process, most of the cellulose is hydrolyzed to glucose under high temperature and high pressure to form hydroxymethyl furfural by tautomerization and intramolecular dehydration. After a series of polymerization and polycondensation reactions, a crosslinked furan compound is generated.30 As the reaction goes on, small molecules, as shown in the figure, are gradually precipitated and form the nuclei of carbon nanospheres. The spherules gradually accumulate and become larger to reduce the free energy of the surface. During the growth of the spheres, a large number of defects are generated in the interior, and a hollow structure is formed, with the RHC successfully prepared at the end.19 The growth process of the ZnO nanorods occurs with Zn(OH)2 forming the growth unit Zn(OH)42− by hydrolysis in alkaline conditions. CTAB acts as a cationic surfactant and reduces the free energy of the interface, which is conducive to the formation of crystal nuclei. As shown in the figure, CTAB and Zn(OH)42− form an ion pair. The nucleation arises from the oxolation of the growth unit and the protonation of the anions. Hydrophobic films formed by CTAB during the growth process lead to its anisotropy. The formation of nanorods is ensured by the surface-bonding method on the (0001) face. The hydroxyl groups on RHC and the Zn2+ on the {11−20} planes will be bound together by electrostatic interactions, and carbonization results in the final formation of RHC/ZnO.
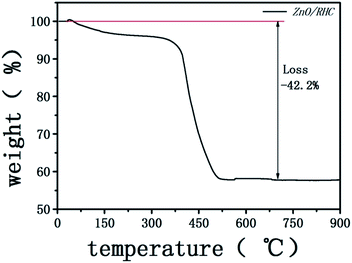
In addition, the content of ZnO in the composite was estimated by thermal gravimetric (TG) analysis, TG was performed from room temperature to 900 °C in air with a heating rate of 10 °C min−1. There was a weight loss below 200 °C caused by the removal of physically absorbed water. A significant weight loss of 42.2 wt% was recorded at about 400 °C, which indicates that the content of carbon in the ZnO/RHC was 42.2 wt% (Fig. 5).
The electrical performance behaviors of the ZnO/RHC anodes were tested by CV (Fig. 6a). In the first cathodic scan, the CV curves present two obvious reduction peaks at around 0.2 and 0.8 V. The peak located at 0.2 V is related to the conversion process of ZnO to LiZn alloy, and the 0.8 V peak can be attributed to the formation of the partially reversible solid electrolyte interphase (SEI) layer.31 The peak at ∼1.5 V is related to the reactions between lithium ions and functional groups on the surface of the material as reported previously.19 After the subsequent cathodic sweeps, a strong cathodic peak shift to 0.8 V, which becomes broader, corresponds to the reduction of ZnO to Zn and the formation of the alloy.32 An oxidation peak is located in the potential range of 0–0.5 V during the first and the subsequent anodic scans, which may be ascribed to the dealloying process of the LiZn alloy.33 The broad peak located at about 1.35 V can be related to the formation of ZnO by the redox reaction between Zn and Li2O.34 After the first cycle, the curves almost overlap in subsequent cycles indicating that ZnO/RHC have good stability and reversibility.
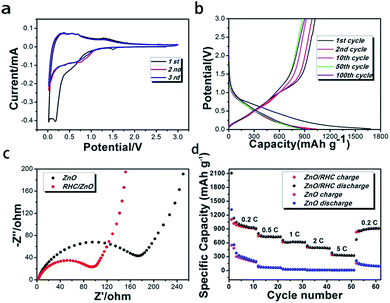 | ||
| Fig. 6 (a) Cyclic voltammogram curves of ZnO/RHC. (b and c) Nyquist plots for ZnO/RHC and ZnO. (d) The rate performance of the ZnO and ZnO/RHC. | ||
Fig. 6b shows the charge–discharge curves of ZnO/RHC at a current density of 0.2C in the range of 0.01–3 V in the 1st, 2nd, 10th, 50th and 100th cycles. It was noticed that the first discharge and charge capacities reached maxima of 1679.7 mA h g−1 and 1024.1 mA h g−1, showing a coulombic efficiency of 70.0%. A pronounced plateau around 0.8 V and a long flat plateau at 0.25 V in the first discharge curve are attributed to the decomposition of the electrolyte to generate the SEI layer and the reactions between Zn and Li+ to form LiZn alloys.35 These results match the CV characterization. Besides, the coulombic efficiency is also increased to 94.3%, 96.6%, 99.7% and 99.5% in the 2nd, 10th, 50th and 100th cycles, indicating that the reactions become more reversible and steady.36
To further determine the electrochemical behaviors of the hybrid materials, EIS tests were performed. Fig. 6c shows Nyquist plots for the fully cycled cells. Apparently, the diameter of the medium-frequency semicircle for RHC/ZnO (Rct = ∼95 Ω) is much smaller than that for ZnO (Rct = ∼175 Ω), demonstrating that the introduced RHC can further improve the electronic conductivity of the active substance and thereby give rise to improved electrochemical performance in LIBs.37 RHC, where ZnO nanorods are dispersed, is equivalent to a skeleton with an amorphous structure, which is conducive to stress relaxation. It is possible to effectively prevent the aggregation and pulverization of the ZnO particles during the charging and discharging processes.
In order to further investigate the rapid transfer of lithium ions and capacity recovery, Fig. 6d displays the rate capabilities of the ZnO nanorods and the ZnO/RHC at various current densities. The ZnO/RHC cell was first tested for 10 cycles at rates of 0.2, 0.5, 1, 2 and 5C (1C = 978 mA h g−1), and the corresponding reversible capacities were 931.9, 729.6, 617.6, 491.4 and 325.7 mA h g−1, respectively, returning to a cycle rate of 0.2C for 60 cycles, where the capacity could revert to 927.2 mA h g−1. It presented excellent rate cyclic performance, because there was no significant capacity loss at each rate test. These results further suggest the good reversibility of the electrode materials and the occurrence of reactivation.38 In order to investigate the role that RHC played in the electrode performance, pure ZnO nanorods were also tested under the same electrochemical conditions. As we can see, the rate capability of ZnO with the additive of RHC was better than that of ZnO.39 The superior cycle and rate performances of ZnO/RHC can be ascribed to the synergistic interactions between ZnO and carbon.
Fig. 7 shows the discharge–charge cycling performances of the ZnO/RHC composite and ZnO particles at a rate of 0.2C for 100 cycles. It was noted that the ZnO/RHC electrode exhibits a high and reversible capacity of 920 mA h g−1 even after 100 cycles. The capacities of the ZnO particles decrease from 576 mA h g−1 to 45.5 mA h g−1. Such a rapid decline in the process was due to the pulverization of ZnO. So, it is obvious that the carbon framework derived from RHC plays a crucial role in the enhanced electrochemical performance. The specific advantages can be summarized as follows: (a) the ZnO nanorods can boost the electrochemical kinetics and shorten the diffusion distances of lithium ions and electrons.40 (b) The skeleton of the three-dimensional hollow carbon nanospheres provides a larger contact area, which is also beneficial to the diffusion and transfer of electrons and lithium ions, as well as reducing the transfer path effectively. The most important thing is that the electrical conductivity of the whole electrode material is improved during the electrochemical process. (c) The {11−20} planes of the ZnO nanorods are connected uniformly to the surface of the RHC, which makes the contact area more stable, as well as suppressing pulverization and maintaining the integrity of hexagonal ZnO to achieve a stable charge–discharge cycle. (d) Due to the fact that a larger specific surface area possesses more reversible lithium storage sites, this suggests that it has more interfacial charge storage.16
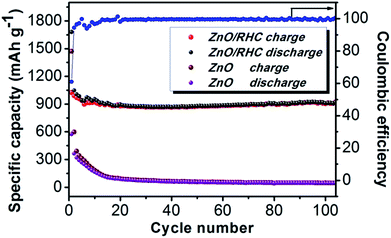 | ||
| Fig. 7 Cycling performance profiles of ZnO/RHC and ZnO at a rate of 0.2C and the coulombic efficiency of ZnO/RHC. | ||
Table 1 gives the results of performance comparisons of recent reports based on ZnO and RHC electrodes, which show that the electrode we prepared displays good electrochemical performance.
| Electrode materials | Current density (mA g−1) | Capacity (mA h g−1) | Cycle number | Ref. |
|---|---|---|---|---|
| RHC | 0.2C (1 C = 372 mA g−1) | 489 | 100 | 18 |
| ZnO–C microspheres | 100 | 520 | 150 | 40 |
| ZnO@graphene | 200 | 360 | 200 | 41 |
| ZnO/Cu/CNFs | 100 | 812 | 50 | 42 |
| ZnO–NiO–Co3O4 | 500 | 1060 | 300 | 43 |
| ZnO–NiO hybrid microspheres | 100 | 1176 | 200 | 44 |
| ZnO/Ni/C hollow microspheres | 100 | 583 | 20 | 45 |
4. Conclusions
In summary, the whole synthesis process was simple and convenient. By using the carbonaceous biomass of rice husk and ZnO nanorods as a lithium ion anode material, this research achieves a high specific capacity and a stable cycle number. The unique skeleton of the three-dimensional hollow carbon nanospheres plays a significant role in the charge and discharge process. The problems of volume expansion of ZnO caused by rapid decay and the electronic conductivity of the electrodes were solved. The synergistic effects of RHC and ZnO meant that the material could maintain a capacity of 920 mA h g−1 after 100 cycles at a high rate of 2C. It also presents excellent rate cyclic performance at different rates. This research has certain application prospects, in line with the contemporary advocacy of new energy sources.Conflicts of interest
There are no conflicts to declare.Acknowledgements
This work was financially supported by the National Science Foundation of China (51275203); the Key Scientific and Technological Project of Jilin Province (20140204052GX, 20180201074GX); the China Postdoctoral Science Foundation (2017M611321); the Project of Education Department of Jilin Province (JJKH20180130KJ).Notes and references
- G. Zhang, S. Hou and H. Zhang, Adv. Mater., 2015, 27, 2400–2405 CrossRef PubMed.
- F. Li, L. Yang and G. Xu, J. Alloys Compd., 2013, 577, 663–668 CrossRef.
- P. Ramu, P. M. Anbarasan and R. Ramesh, Mater. Lett., 2014, 122, 230–233 CrossRef.
- K. T. Park, F. Xia and S. W. Kim, J. Phys. Chem. C, 2013, 117, 1037–1043 CrossRef.
- Q. Xie, J. Li and Q. Tian, J. Mater. Chem., 2012, 22, 13541–13547 RSC.
- G. H. An, D. Y. Lee and H. J. Ahn, ACS Appl. Mater. Interfaces, 2017, 9, 12478–12485 CrossRef PubMed.
- Y. Song, Y. Chen and J. Wu, J. Alloys Compd., 2017, 694, 1246–1253 CrossRef.
- S. M. Abbas, S. T. Hussain and S. Ali, J. Mater. Sci., 2013, 48(16), 5429–5436 CrossRef.
- X. Shen, D. Mu and S. Chen, ACS Appl. Mater. Interfaces, 2013, 5(8), 3118–3125 CrossRef PubMed.
- G. T. K. Fey, D. C. Lee, Y. Y. Lin and T. P. Kumar, Synth. Met., 2003, 139, 71–80 CrossRef.
- W. B. Xing, R. A. Dunlap and J. R. Dahn, J. Electrochem. Soc., 1998, 145, 62–70 CrossRef.
- G. T. K. Fey and C. L. Chen, J. Power Sources, 2001, 97/98, 47–51 CrossRef.
- E. Peleda, V. Eshkenazi and Y. Rosenberg, J. Power Sources, 1998, 76, 153–158 CrossRef.
- W. B. Xing, J. S. Xue, T. Zheng, A. Gibaud and J. R. Dahn, J. Electrochem. Soc., 1996, 143, 3482–3491 CrossRef.
- J. Hou, C. Cao, X. Ma, F. Idrees, B. Xu, X. Hao and W. Lin, Sci. Rep., 2014, 4, 7260–7265 CrossRef PubMed.
- R. Pode, Renewable Sustainable Energy Rev., 2016, 53, 1468–1485 CrossRef.
- C. Yuan, H. Lin and H. Lu, Appl. Energy, 2016, 178, 260–268 CrossRef.
- Y. Gao, L. Li, Y. M. Jin, Y. Wang, C. J. Yuan, Y. J. Wei, G. Chen, J. J. Ge and H. Y. Lu, Appl. Energy, 2015, 153, 41–47 CrossRef.
- K. Yu, J. Li and H. Qi, ChemistrySelect, 2017, 2, 3627–3632 CrossRef.
- Z. Li, Z. Xu and X. Tan, Energy Environ. Sci., 2013, 6, 871–878 RSC.
- A. H. Lu, W. C. Li and G. P. Hao, Angew. Chem., Int. Ed., 2010, 2, 1615–1618 CrossRef PubMed.
- R. J. White, K. Tauer and M. Antonietti, J. Am. Chem. Soc., 2010, 132, 17360–17363 CrossRef PubMed.
- L. Guo, J. Zhang and Q. He, Chem. Commun., 2010, 46, 7127–7129 RSC.
- W. Yu, X. Chen and W. Mei, Appl. Surf. Sci., 2017, 4, 129–138 CrossRef.
- C. He, S. Wu and N. Zhao, ACS Nano, 2013, 7, 4459–4469 CrossRef PubMed.
- D. Pan, S. Wang and B. Zhao, Chem. Mater., 2009, 21, 3136–3142 CrossRef.
- S. Zhu, J. Li and X. Deng, Adv. Funct. Mater., 2017, 27, 1605017 CrossRef.
- W. Jie, H. Zhao and X. Liu, Electrochim. Acta, 2011, 56, 6441–6447 CrossRef.
- M. H. Jung, J. Colloid Interface Sci., 2017, 505–631 Search PubMed.
- M. Sevilla and A. B. Fuertes, Carbon, 2009, 47(9), 2281–2289 CrossRef.
- H. Köse, Ş. Karaal and A. O. Aydın, J. Power Sources, 2015, 295, 235–245 CrossRef.
- Z. Ren, Z. Wang and C. Chen, Electrochim. Acta, 2014, 146, 52–59 CrossRef.
- J. H. Lee, K. H. Ko and B. O. Park, J. Cryst. Growth, 2003, 247, 119–125 CrossRef.
- Y. Sharma, N. Sharma and G. Subba Rao, Adv. Funct. Mater., 2007, 17, 2855–2861 CrossRef.
- Q. S. Xie, Y. T. Ma, X. P. Wang, D. Q. Zeng, L. S. Wang, L. Q. Mai and D. L. Peng, ACS Nano, 2016, 10, 1283–1291 CrossRef PubMed.
- J. Liu, Y. Li and X. Huang, Adv. Funct. Mater., 2008, 18, 1448–1458 CrossRef.
- R. Guo, W. Yue and Y. An, Electrochim. Acta, 2014, 135, 161–167 CrossRef.
- Z. Chen, R. Wu and H. Wang, Chem. Eng. J., 2017, 326, 180–190 CrossRef.
- J. Wu, C. Chen and Y. Hao, Colloids Surf., A, 2015, 468, 17–21 CrossRef.
- Y. Zou, Z. Qi and Z. Ma, J. Electroanal. Chem., 2017, 788, 184–191 CrossRef.
- Q. Xie, X. Zhang, X. Wu, H. Wu, X. Liu, G. Yue, Y. Yang and D.-L. Peng, Electrochim. Acta, 2014, 125, 659–665 CrossRef.
- X. Y. Shen, D. B. Mu, S. Chen, R. Huang and F. Wu, J. Mater. Chem. A, 2014, 2(12), 4309–4315 RSC.
- L. Lu, H. Wang and J. G. Wang, et al., J. Mater. Chem. A, 2017, 5, 2530 RSC.
- Q. Xie, Y. Ma, D. Zeng, L. Wang, G. Yue and D. L. Peng, Sci. Rep., 2015, 5, 8351 CrossRef PubMed.
- Q. S. Xie, Y. T. Ma, X. Q. Zhang, L. S. Wang, G. H. Yue and D. L. Peng, J. Alloys Compd., 2015, 619, 235–239 CrossRef.
| This journal is © The Royal Society of Chemistry 2018 |

