 Open Access Article
Composition design, electrical properties, and temperature stability in (1 − x)K0.44Na0.56Nb0.96Sb0.04O3-xBi0.45La0.05Na0.5ZrO3 lead-free ceramics
Jian Ma*a,
Juan Wua and
Bo Wu *b
*b
aPhysics Department, Sichuan Province Key Laboratory of Information Materials, Southwest Minzu University, Chengdu 610041, P. R. China. E-mail: majian33@hotmail.com
bSichuan Province Key Laboratory of Information Materials and Devices Application, Chengdu University of Information Technology, Chengdu 610225, P. R. China. E-mail: wubo7788@126.com
First published on 23rd August 2018
Abstract
In this work, we designed a new system of (1 − x)K0.44Na0.56Nb0.96Sb0.04O3-xBi0.45La0.05Na0.5ZrO3 (KNNS-xBLNZ, 0 ≤ x ≤ 0.06) ceramics, and systemically investigated both their electrical performance and temperature stability. Through optimizing the composition, a relatively good comprehensive performance (e.g., d33 ∼ 455 ± 10 pC N−1, kp ∼ 0.47 ± 0.02, TC ∼ 266 °C, strain ∼ 0.148%, and  ) is obtained in the ceramics with x = 0.040, which is attributed to the construction of a rhombohedral–orthorhombic–tetragonal (R–O–T) phase boundary. Moreover, a good temperature stability of remnant polarization (Pr) as well as strain value (Pr100 °C/PrRT ∼ 89.6%, Pr180 °C/PrRT ∼ 73.2%, S100 °C/SRT ∼ 92.6%, S180 °C/SRT ∼ 74.1%) is gained in KNNS-0.040BLNZ ceramics with a broad temperature range from room temperature to 180 °C. Hence, we believe that KNNS-xBLNZ ceramics opens a window for the practical application of lead-free ceramics.
1. Introduction
Piezoelectric materials play an important role in electronic devices because they can interconvert electrical energy into mechanical energy. Lead zirconate titanate (PbZr1−xTixO3, PZT) ceramics have been the dominating material in the piezoelectric market during the last 60 years.1 However, in order to protect the environment and human sustainable development due to the toxicity of lead in the compositions, a lot of effort has been recently devoted to develop high-performance lead-free piezoelectric ceramics which can eventually replace the lead-based ones.1–26Among all the lead-free piezoelectric materials, (K, Na)NbO3 has been regarded as a potential candidate due to its good comprehensive electrical properties especially its flexibility in terms of compositional modification.2–26 Saito et al. reported that alkali niobate ceramics based on Li, Ta, and Sb-modified KNN show high density and excellent performance (d33 ∼ 416 pC N−1; TC ∼ 253 °C) by the reactive-templated grain growth method in 2004.2 Ever then, researchers paid much attention to promote the electricity by constructing the multiphase boundary has been extensively applied in KNN-based lead-free materials.2–26 Recently, some breakthroughs in the KNN-based ceramics were achieved.4–7,32–34 For example, Wu et al. obtained a series of KNN-based lead-free ceramics systems in multiphase boundary (e.g., R–O–T, R–T) with giant piezoelectricity of ≥490 pC N−1, which are comparable to that of PZT materials.4–7 According to the previous works, Sb5+, Bi0.5M0.5ZrO3 (M = Na, K, Li, Ag), can effectively enhance electrical properties of KNN ceramics by constructing the multiphase boundary.3–8,10,14–16 Therefore, these additives are good candidates for constructing phase boundary to improve the electricity (especially the piezoelectric properties) in KNN-based ceramics.
As we known, La3+ has properties similar to Bi3+, such as the similar ionic radius, same valence state, and so on. Consequently, we exploited a new lead-free piezoelectric material system of (1 − x)K0.44Na0.56Nb0.96Sb0.04O3-xBi0.45La0.05Na0.5ZrO3 prepared by normal sintering, and systemically investigated both their electrical performance and temperature stability. Through optimizing the composition, and the R–O–T phase boundary was mediated in this ceramics. The relatively good comprehensive performance (e.g., d33 ∼ 455 ± 10 pC N−1, kp ∼ 0.47 ± 0.02, TC ∼ 266 °C, strain ∼ 0.148%, and  ) is obtained in the ceramics with x = 0.040, which is attributed to the construction of R–O–T phase boundary. Moreover, a good temperature stability of remnant polarization (Pr) as well as strain value (Pr100 °C/PrRT ∼ 89.6%, Pr180 °C/PrRT ∼ 73.2%, S100 °C/SRT ∼ 92.6%, S180 °C/SRT ∼ 74.1%) is gained in KNNS-0.040BLNZ ceramics with a broad temperature range from room temperature to 180 °C. The related physical mechanisms were addressed.
2. Experimental procedure
(1 − x)K0.44Na0.56Nb0.96Sb0.04O3-xBi0.45La0.05Na0.5ZrO3 (0 ≤ x ≤ 0.06) piezoelectric ceramics were prepared by the conventional solid-state reaction process. Raw materials [Na2CO3 (99.8%), K2CO3 (99%), Nb2O5 (99.5%), Sb2O3 (99%), ZrO2 (99%), Bi2O3 (99.999%), and La2O3 (99.99%)] were weighed according to chemical formula above. The powder dried and calcined at 850 °C for 6 hours after milled with ZrO2 balls for 24 hours with alcohol as the dispersion medium, and then pressed into the pellets (∼10 mm diameter, ∼1 mm thickness) under a pressure of ∼10 MPa when the calcined powders were mixed with ∼8 wt% polyvinyl alcohol (PVA). After the PVA binder was burnt out, the samples were sintered at 1110–1130 °C for 3 hours in air, and then printed with silver paste on the both sides as the electrode. All specimens were polarized in a silicone oil bath at room temperature under a dc field of 3 kV mm−1 for 30 min.The phase structure of the sintered cylindrical pellets is identified by X-ray diffraction meter (Cuα, DX-2700, Dandong, China), measured at 40 kV and 30 mA. The field-emission scanning electron microscope (FE-SEM) (JSM-7500, Japan) has been used to measure their surface micro-structure and chemical compositions. The dielectric properties of the sintered samples were measured using an LCR analyzer (HP 4980, Agilent, U.S.A.) with varied temperatures in the range of −150–200 °C and 25–450 °C. The P–E loops and S–E curves of the cylindrical pellets were investigated by the ferroelectric tester (aixACCT, TF Analyzer 2000E, Germany). The kp was measured by a resonance-antiresonance method with the impedance analyzer (Impedance Analyzer, PV70A, Beijing, China). The d33 was measured by the commercial Berlincourt-type of d33 meter, (ZJ-3A, China) for the poled samples.
3. Results and discussion
The XRD patterns of the KNNS-xBLNZ (0 ≤ x ≤ 0.06) ceramics in the 2θ range of 20–60° is shown in Fig. 1(a). All samples exhibit a pure perovskite structure, indicating that BLNZ has completely diffused into the KNNS lattice to form a solid solution. The O phase is characterized by (220)/(020) peaks splitting at about 45°, that is, the intensity ratio (2![[thin space (1/6-em)]](https://www.rsc.org/images/entities/char_2009.gif) :
:![[thin space (1/6-em)]](https://www.rsc.org/images/entities/char_2009.gif) 1) between the left peak and the right one means the O symmetry.22,23 From the Fig. 1(b), we can find that an O phase was formed in the ceramics (0 ≤ x < 0.020), and other ceramics (0.02 ≤ x < 0.060) demonstrate multiphase structure. To further explore their phase structure of the ceramics, the εr–T curves (−150–200 °C) tested at 10 kHz have been plotted in Fig. 2(a)–(h). There are two obvious abnormal dielectric peaks in the ceramics with x ≤ 0.040, which respectively correspond to their TR–O at low temperature and TO–T at high temperature, as is shown in Fig. 2(a)–(e).21 The TO–T (∼136 °C) and TR–O (∼2 °C) is far to room temperature in the ceramics with 0 ≤ x < 0.020, showing that the O phase was observed [see Fig. 2(a)]. For the ceramics with 0.02 ≤ x ≤ 0.030, the TO–T (∼87 → 75 °C) is close to room temperature and TR–O (∼3 → 7 °C) is below room temperature, confirming that the O–T phase was obtained [see Fig. 2(b) and (c)]. As for BLNZ content increasing from 0.035 to 0.040, TR–O (∼9 → 13 °C) and TO–T (∼51 → 40 °C) are close to room temperature, suggesting that the R–O–T phase was constructed in the ceramics [see Fig. 2(d) and (e)]. Subsequently, only one abnormal dielectric peak was observed in the ceramics with 0.045 ≤ x < 0.060, indicating that both TR–O and TO–T were shifted to the same temperature, and formed the R–T phase boundary [see Fig. 2(f) and (g)]. In addition, the εr–T curve of x = 0.060 becomes flat to some degree, leading to the R phase boundary [see Fig. 2(h)], which can be explained by the fined-grain [see Fig. 4(d)]. Eventually, through systematical analysis of the phase structure by XRD and εr–T curves, we concluded that: the ceramics with 0 ≤ x < 0.020 are an O symmetry, the ceramics with 0.020 ≤ x ≤ 0.030 belong to be O–T phase coexistence, the ceramics with 0.035 ≤ x ≤ 0.040 have R–O–T phase boundary, the ceramics with 0.040 < x < 0.060 are R–T phase boundary, the ceramic with x = 0.060 is R phase boundary.
1) between the left peak and the right one means the O symmetry.22,23 From the Fig. 1(b), we can find that an O phase was formed in the ceramics (0 ≤ x < 0.020), and other ceramics (0.02 ≤ x < 0.060) demonstrate multiphase structure. To further explore their phase structure of the ceramics, the εr–T curves (−150–200 °C) tested at 10 kHz have been plotted in Fig. 2(a)–(h). There are two obvious abnormal dielectric peaks in the ceramics with x ≤ 0.040, which respectively correspond to their TR–O at low temperature and TO–T at high temperature, as is shown in Fig. 2(a)–(e).21 The TO–T (∼136 °C) and TR–O (∼2 °C) is far to room temperature in the ceramics with 0 ≤ x < 0.020, showing that the O phase was observed [see Fig. 2(a)]. For the ceramics with 0.02 ≤ x ≤ 0.030, the TO–T (∼87 → 75 °C) is close to room temperature and TR–O (∼3 → 7 °C) is below room temperature, confirming that the O–T phase was obtained [see Fig. 2(b) and (c)]. As for BLNZ content increasing from 0.035 to 0.040, TR–O (∼9 → 13 °C) and TO–T (∼51 → 40 °C) are close to room temperature, suggesting that the R–O–T phase was constructed in the ceramics [see Fig. 2(d) and (e)]. Subsequently, only one abnormal dielectric peak was observed in the ceramics with 0.045 ≤ x < 0.060, indicating that both TR–O and TO–T were shifted to the same temperature, and formed the R–T phase boundary [see Fig. 2(f) and (g)]. In addition, the εr–T curve of x = 0.060 becomes flat to some degree, leading to the R phase boundary [see Fig. 2(h)], which can be explained by the fined-grain [see Fig. 4(d)]. Eventually, through systematical analysis of the phase structure by XRD and εr–T curves, we concluded that: the ceramics with 0 ≤ x < 0.020 are an O symmetry, the ceramics with 0.020 ≤ x ≤ 0.030 belong to be O–T phase coexistence, the ceramics with 0.035 ≤ x ≤ 0.040 have R–O–T phase boundary, the ceramics with 0.040 < x < 0.060 are R–T phase boundary, the ceramic with x = 0.060 is R phase boundary.
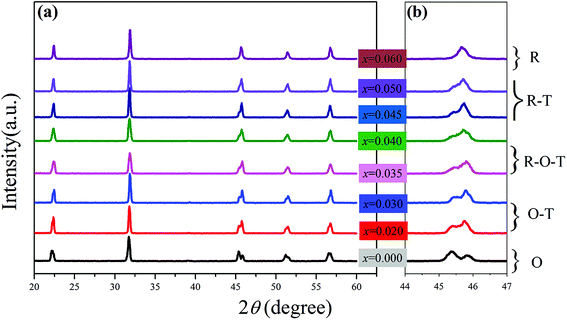 | ||
| Fig. 1 XRD patterns of the (1 − x)K0.44Na0.56Nb0.96Sb0.04O3-xBi0.45La0.05Na0.5ZrO3 ceramics in the 2θ range of (a) 20–60°, (b) 44–47°. | ||
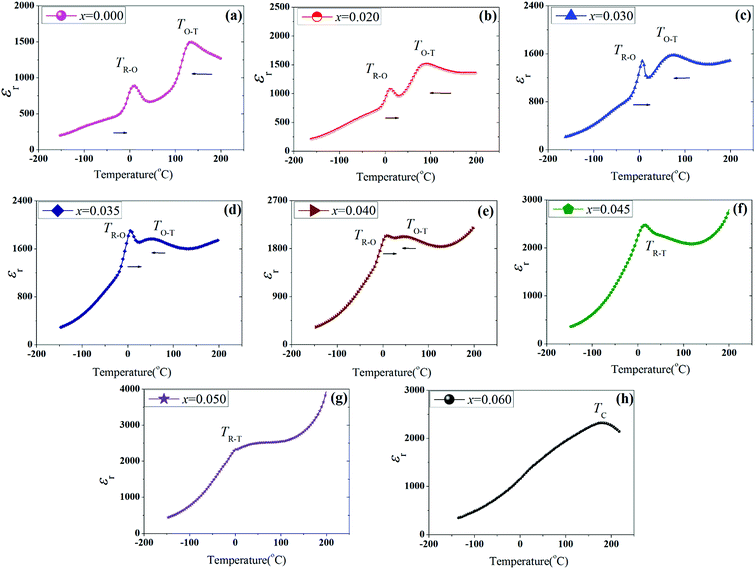 | ||
| Fig. 2 εr–T curves of (1 − x)K0.44Na0.56Nb0.96Sb0.04O3-xBi0.45La0.05Na0.5ZrO3 ceramics in temperature range of −150–200 °C. | ||
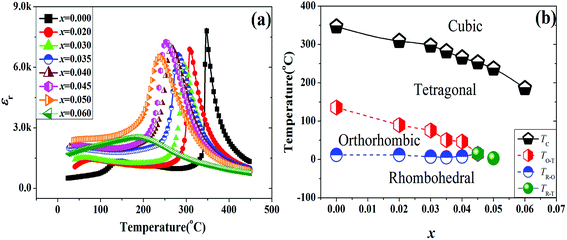
Fig. 3(a) shows the εr–T curves (∼25–450 °C) of the KNNS-xBLNZ ceramics. We have concentrated mainly on the variation of ferroelectric–paraelectric phase transition temperature (TC) versus BLNZ content. One can see that the TC decreases with increasing the BLNZ content. Fig. 3(b) plots the corresponding phase diagrams of the ceramics as a function of BLNZ content. One can see that the TC and TO–T values have a similar variation trend, that is, they reduce monotonously with increasing BLNZ content, but the TR–O rises. It is reported that both (Bi0.45La0.05Na0.5)2+ and Zr4+ can simultaneously drop TO–T and raise TR–O in KNN-based ceramics.3,20 Finally, the O symmetry gradually disappears with increasing of the BLNZ content, resulting in the appearance of multiphase coexistence (O–T for 0.020 ≤ x ≤ 0.030, R–O–T for 0.035 ≤ x ≤ 0.040, R–T for 0.040 < x < 0.060, and R for x = 0.060).
Fig. 4 shows the FE-SEM micrographs of the KNNS-xBLNZ ceramics. One can see that the grain size strongly depends on the BLNZ content in this ceramics. From Fig. 4(a), a relatively homogeneous grain size distribution is found in the ceramics with x = 0. The grain size of the ceramics (0.020 ≤ x ≤ 0.040) is increasing with introducing BLNZ content, and the inhomogeneous grains appear in the ceramics [see Fig. 4(b) and (c)]. It may be caused by the addition of Bi3+, which can improve the migration rate of the grain boundary, so as to accelerate the grain growth of the KNN-based ceramics due to the formation of liquid phase.25 Moreover, the small grains stuff the aperture of the large ones can lead to the formation of the dense microstructure in the ceramics. One can find that the grain size sharply decreases as BLNZ content increases to 0.060 [see Fig. 4(d)], which can be interpreted as the inhibited grain growth due to the aggregation at grain boundaries of both excessive Zr4+ and Bi3+.24,25 In addition, the fine-grain plays a key role in the flat dielectric peak in the ceramics of x = 0.060. The element mapping (K, Na, Nb, Sb, Bi, La, Zr, O) of KNNS-xBLNZ ceramics with x = 0.040 is shown in Fig. 5 shows. All chemical elements in the ceramics distribute uniformity.
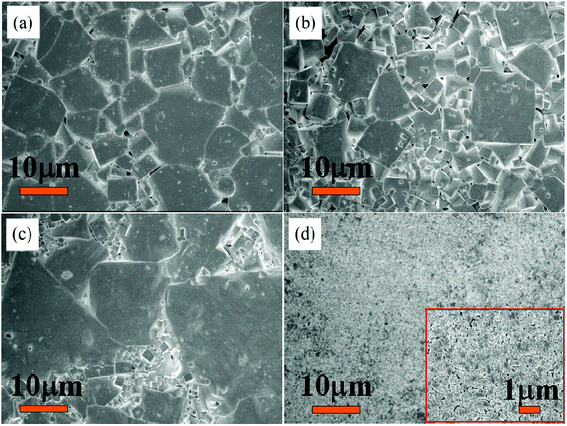 | ||
| Fig. 4 FE-SEM surface images of (1 − x)K0.44Na0.56Nb0.96Sb0.04O3-xBi0.45La0.05Na0.5ZrO3 ceramics with (a) x = 0, (b) x = 0.020, (c) x = 0.040, (d) x = 0.060. | ||
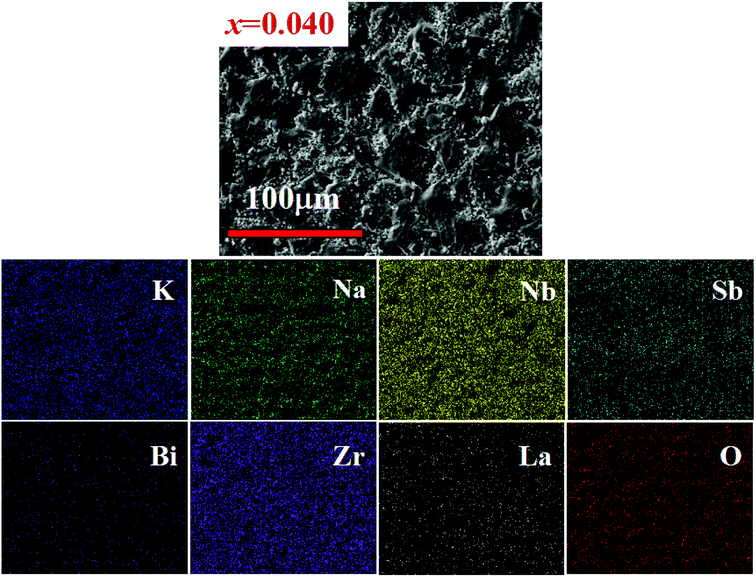 | ||
| Fig. 5 Elemental (K, Na, Nb, Sb, Bi, La, Zr, and O) mapping on the surface of (1 − x)K0.44Na0.56Nb0.96Sb0.04O3-xBi0.45La0.05Na0.5ZrO3 ceramics with x = 0.040. | ||
Fig. 6 shows εr and tan![[thin space (1/6-em)]](https://www.rsc.org/images/entities/char_2009.gif) δ values of KNNS-xBLNZ ceramics. One can find that the εr value is sensitive to the BLNZ content, that is, εr value rises sharply with increasing BLNZ content, getting a high value (2003–2376) in the ceramics with 0.035 ≤ x ≤ 0.050, which can be ascribed to the existence of multiphase boundary. The tan
δ values of KNNS-xBLNZ ceramics. One can find that the εr value is sensitive to the BLNZ content, that is, εr value rises sharply with increasing BLNZ content, getting a high value (2003–2376) in the ceramics with 0.035 ≤ x ≤ 0.050, which can be ascribed to the existence of multiphase boundary. The tan![[thin space (1/6-em)]](https://www.rsc.org/images/entities/char_2009.gif) δ value almost fluctuates in the range of 0.035–0.044 in the ceramics due to the dense microstructure, as is shown in Fig. 6.
δ value almost fluctuates in the range of 0.035–0.044 in the ceramics due to the dense microstructure, as is shown in Fig. 6.
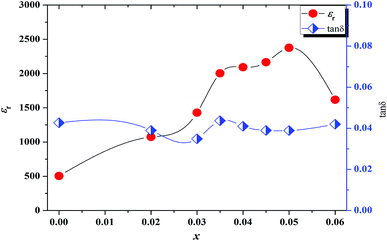 | ||
Fig. 6 Dielectric (εr, tan![[thin space (1/6-em)]](https://www.rsc.org/images/entities/char_2009.gif) δ) properties of (1 − x)K0.44Na0.56Nb0.96Sb0.04O3-xBi0.45La0.05Na0.5ZrO3 ceramics. δ) properties of (1 − x)K0.44Na0.56Nb0.96Sb0.04O3-xBi0.45La0.05Na0.5ZrO3 ceramics. | ||
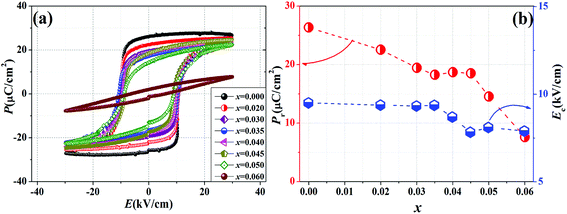
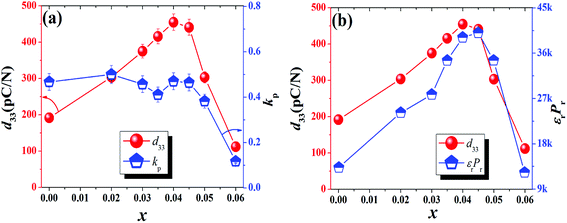
Fig. 7(a) plots the P–E loops of KNNS-xBLNZ ceramics. We can see that all ceramics exhibit typical ferroelectric loops in Fig. 7(a). The remnant polarization (Pr) and the coercive field (Ec) as a function of BLNZ content were shown in Fig. 7(b). As is known, the Pr value is the remained aligned dipoles after removing electric field, and the Ec value is the electric field required for domain switching. The Pr value slowly decreases with increasing BLNZ content to 0.045, and then reduces sharply with further increasing the BLNZ content [see Fig. 7(b)]. The Ec value almost fluctuates in the range of 7.8–9.5 kV cm−1 in the ceramics [See Fig. 7(b)]. The piezoelectric properties of KNNS-xBLNZ ceramics is plotted in Fig. 8(a). One can see that the d33 value firstly increases and then decreases as increasing the BLNZ content. The kp value firstly keeps stable with increasing the BLNZ content to 0.045, and then decreases sharply with further increasing the BLNZ content. Owing to the coexistence multiphase of R–O–T, an optimum piezoelectric (d33 ∼ 455 ± 10 pC N−1, kp ∼ 0.47 ± 0.02) properties were obtained in the ceramics with x = 0.040. It can be explained by the following two aspects: firstly, the multiphase boundaries have more equivalent spontaneous polarization vectors, indicating that it can provide more polarization vectors than the one with a pure phase structure. Secondly, the polarization anisotropic energy of the ceramics can be decreased in multiphase coexistence, which provides a shortcut for polarization rotation in anisotropically flattened free energy profile.26–28 As is known, the formula of d33 ∼ αεrPr appears to be well established in KNN-based ceramics,29,30 namely, the higher d33 value should be closely correlated with the higher εrPr value in the ceramics. To explore the relationship between d33 and εrPr, a diagram of d33 and εrPr vs. BLNZ content is shown in Fig. 8(b). One can see that there is a similar trend for the d33 and εrPr vs. BLNZ content. Therefore, the improvement of piezoelectric properties can be ascribed to the multiphase coexistence, dielectric and ferroelectric properties.
Bipolar electric field induced strain curves of KNNS-xBLNZ ceramics is shown in Fig. 9(a). A typical butterfly shape strain curves as a characteristic of the ferroelectric is exhibited in all ceramics. It was reported that the electric field-induced strain comes from intrinsic and extrinsic contributions. The intrinsic contributions mainly include the piezoelectric effects and electrostriction, and the extrinsic contributions are attributed to domain wall movement. In addition, the perfectly linear S–E response is the main contribution by the piezoelectric effect is, and the domain switching mainly produce “butterfly shape” of S–E loops.31 In this work, one can see that the “butterfly shape” of S–E loops is obtained in ceramics with 0 ≤ x ≤ 0.050. It can be explained by the intrinsic effect which is aligned with the lattice response and the extrinsic effect which is aligned with domain switching; Moreover, the nearly linear response of strain is observed in the ceramics with x = 0.060, indicating that both the lattice response and domain wall movement contribute to the strain. Fig. 9(b) shows the strain and  values vs. the compositions of BLNZ. The strain and
  value is similar variation with increasing BLNZ content, that is, the strain value firstly increases, and then decreases with increasing the BLNZ, obtaining the maximum value (strain ∼ 0.148%,
  ) at x = 0.040, which is benefit from the multiphase zone.
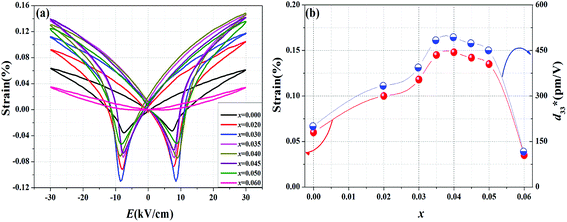 | ||
| Fig. 9 Bipolar electric field induced strain of (1 − x)K0.44Na0.56Nb0.96Sb0.04O3-xBi0.45La0.05Na0.5ZrO3 ceramics. | ||
Fig. 10(a) represents the temperature-dependent P–E curves of the ceramics with x = 0.040, measured at f = 1 Hz and room temperature to 180 °C. One can find that all are statured P–E loops with increasing the measured temperature. The remnant polarization Pr changed slightly with high PrT/PrRT (PrT is the Pr value which measured at the temperature of T; PrRT is the Pr value which measured at room temperature) values (Pr100 °C/PrRT ∼ 89.6%, Pr180 °C/PrRT ∼ 73.2%) in the wide temperature range [see Fig. 10(b) and (c)]. It indicates that the switched polarization state along the direction of the external electric field was of little variation. As another important characteristic for ferroelectric property, the coercive field (Ec) which indicates the energy barrier between the equivalent states of the order parameter decreased on increasing temperature. Fig. 10(d) shows bipolar electric field induced strain curves vs. temperature of KNNS-xBLNZ ceramics, measured at room temperature to 180 °C. All the strain curves show the typical butterfly shape. Different from the hysteresis loops, which involved all domain switching, the bipolar strain curves only reflected the population of non-180° domain switching. For ferroelectrics, the non-180° polarization switching is always coupled to the lattice strain, an instability in polarization orientation (i.e., isotropy of polarization) will necessarily induce a softening in elastic modulus, and hence a high electrostrain. Therefore, low polarization anisotropy and elastic softening go hands in hands with each other, both contributing to a high electrostrain. As summarized in Fig. 10(b), the Sneg (the strain between minimum strain and strain under zero electric field) of the ceramics decreased. The changes in Sneg can be explained by the quantity of 90°/180° domain increased and tetragonality c/a decreased with increasing temperature approaching its TC. While the Spos (the strain between the maximum strain and the strain under zero electric field) showed little change with high ST/SRT (ST is the S value which measured at the temperature of T; SRT is the S value which measured at room temperature) values (S100 °C/SRT ∼ 92.6%, S180 °C/SRT ∼ 74.1%) in the wide temperature range [see Fig. 10(e) and (f)]. The excellent temperature stability is due to the high TC (∼266 °C) and relatively stable εr in this composition, which has been demonstrated elsewhere.35 Therefore, the Pr and strain values of KNNS-xBLNZ ceramics with x = 0.040 exhibit excellent temperature stability (Pr100 °C/PrRT ∼ 89.6%, Pr180 °C/PrRT ∼ 73.2%, S100 °C/SRT ∼ 92.6%, S180 °C/SRT ∼ 74.1%) in the wide temperature range.
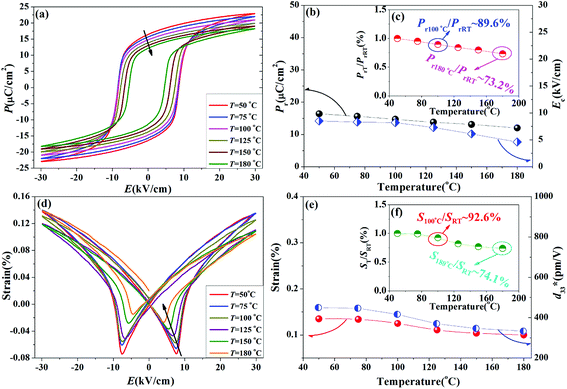 | ||
| Fig. 10 Ferroelectric loops and bipolar electric field induced strain of 0.96K0.44Na0.56Nb0.96Sb0.04O3-0.04Bi0.45La0.05Na0.5ZrO3 ceramics as a function of temperature from room temperature to 180 °C. | ||
4. Conclusion
(1 − x)K0.44Na0.56Nb0.96Sb0.04O3-xBi0.45La0.05Na0.5ZrO3 lead-free ceramics were developed by the normal sintering, and the effects of BLNZ content on their phase structure and electrical properties was investigated. The R–O–T coexistence phase has been confirmed by both XRD patterns and εr–T curves in the ceramics with 0.035 ≤ x ≤ 0.040. Through optimizing the composition, the relatively good comprehensive performance (e.g., d33 ∼ 455 ± 10 pC N−1, kp ∼ 0.47 ± 0.02, TC ∼ 266 °C, strain ∼ 0.148%, and ) is obtained in the ceramics with x = 0.040 which is attributed to the construction of rhombohedral–orthorhombic–tetragonal (R–O–T) phase boundary. Moreover, a good temperature stability of remnant polarization (Pr) as well as strain value (Pr100 °C/PrRT ∼ 89.6%, Pr180 °C/PrRT ∼ 73.2%, S100 °C/SRT ∼ 92.6%, S180 °C/SRT ∼ 74.1%) is gained in KNNS-0.040BLNZ ceramics with a broad temperature range from room temperature to 180 °C. Hence, such a material is promising for practical applications in the piezoelectric material markets.
Conflicts of interest
There are no conflicts to declare.Acknowledgements
Authors gratefully acknowledge the support of the National Science Foundation of China (Grant No. 51702028), and Scientific Research Project of Sichuan Provincial Department of Education (Grant No. 2018Z115).References
- B. Jaffe, W. R. Cook and H. Jaffe, Piezoelectric Ceramics, Academic, New York, 1971 Search PubMed.
- Y. Saito, H. Takao, T. Tani, T. Nonoyama, K. Takatori, T. Homma, T. Nagaya and M. Nakamura, Nature, 2004, 432, 84–87 CrossRef PubMed.
- J. G. Wu, D. Q. Xiao and J. G. Zhu, Chem. Rev., 2015, 115, 2559–2595 CrossRef PubMed.
- K. Xu, J. Li, X. Lv, J. G. Wu, X. X. Zhang, D. Q. Xiao and J. G. Zhu, Adv. Mater., 2016, 28(38), 8519–8523 CrossRef PubMed.
- B. Wu, H. J. Wu, J. G. Wu, D. Q. Xiao, J. G. Zhu and S. J. Pennycook, J. Am. Chem. Soc., 2016, 138, 15459–15464 CrossRef PubMed.
- X. P. Wang, J. G. Wu, D. Q. Xiao, J. G. Zhu, X. J. Cheng, T. Zheng, B. Y. Zhang, X. J. Lou and X. J. Wang, Giant piezoelectricity in potassium–sodium niobate lead-free ceramics, J. Am. Chem. Soc., 2014, 136, 2905–2910 CrossRef PubMed.
- T. Zheng, H. J. Wu, Y. Yuan, X. Lv, Q. Li, T. Men, C. L. Zhao, D. Q. Xiao, J. G. Wu, K. Wang, J. F. Li, Y. L. Gu, J. G. Zhu and S. J. Pennycook, Energy Environ. Sci., 2017, 10(2), 528–537 RSC.
- B. Wu, J. G. Wu, D. Q. Xiao and J. G. Zhu, Dalton Trans., 2015, 44(48), 21141–21152 RSC.
- K. Wang and J. F. Li, Appl. Phys. Lett., 2007, 91, 262902 CrossRef.
- T. Zheng, J. G. Wu, X. J. Cheng, X. P. Wang, B. Y. Zhang, D. Q. Xiao, J. G. Zhu, X. J. Lou and X. J. Wang, Dalton Trans., 2014, 43(30), 11759–11766 RSC.
- Y. Guo, K. I. Kakimoto and H. Ohsato, Mater. Lett., 2005, 59, 241–244 CrossRef.
- M. H. Zhang, K. Wang, Y. J. Du, G. Dai, W. Sun, G. Li, D. Hu, H. C. Thong, C. L. Zhao, X. Q. Xi, Z. X. Yue and J. F. Li, J. Am. Chem. Soc., 2017, 139(10), 3889–3895 CrossRef PubMed.
- P. Zhao and B. P. Zhang, J. Am. Ceram. Soc., 2008, 91, 3078–3081 CrossRef.
- Z. Wang, D. Q. Xiao, J. G. Wu, M. Xiao, F. X. Li and J. G. Zhu, J. Am. Ceram. Soc., 2014, 97(3), 688–690 CrossRef.
- T. Zheng, Y. Zu and J. Wu, J. Alloys Compd., 2015, 647, 927–934 CrossRef.
- X. P. Wang, J. G. Wu, X. Lv, H. Tao, X. J. Cheng, T. Zheng, B. Y. Zhang, D. Q. Xiao and J. G. Zhu, J. Mater. Sci.: Mater. Electron., 2014, 25, 3219–3225 CrossRef.
- F. Z. Yao, K. Wang, W. Jo, Y. G. Webber, T. P. Comyn, J. X. Ding, B. Xu, L. Q. Cheng, M. P. Zheng, Y. D. Hou and J. F. Li, Adv. Funct. Mater., 2016, 26, 1217–1224 CrossRef.
- F. Z. Yao, Q. Yu, K. Wang, Q. Li and J. F. Li, RSC Adv., 2014, 4, 20062–20068 RSC.
- T. Zheng, J. G. Wu, X. J. Cheng, X. P. Wang, B. Y. Zhang, D. Q. Xiao, J. G. Zhu and X. J. Lou, Dalton Trans., 2014, 43(25), 9419–9426 RSC.
- B. Chen, J. Ma, S. Wu and B. Wu, J. Mater. Sci.: Mater. Electron., 2017, 28, 3299–3308 CrossRef.
- B. Wu, J. Ma, W. J. Wu, M. Chen and Y. C. Ding, Ceram. Int., 2018, 44(1), 1172–1175 CrossRef.
- K. Wang and J. F. Li, Appl. Phys. Lett., 2007, 91, 262902 CrossRef.
- H. Du, W. Zhou, F. Luo, D. Zhu, S. Qu, Y. Li and Z. Pei, J. Appl. Phys., 2008, 104(3), 034104 CrossRef.
- B. Malic, J. Bernard, A. Bencan and M. Kosec, J. Eur. Ceram. Soc., 2008, 28, 1191–1196 CrossRef.
- J. Noh and J. Yoo, J. Electroceram., 2012, 29(2), 144–148 CrossRef.
- J. H. Gao, L. X. Zhang, D. Z. Xue, T. Kimoto, M. H. Song, L. S. Zhong and X. B. Ren, J. Appl. Phys., 2014, 115, 054108 CrossRef.
- D. S. Keeble, E. R. Barney, D. A. Keen, M. G. Tucker, J. Kreisel and P. A. Thomas, Adv. Funct. Mater., 2013, 23, 185–190 CrossRef.
- W. H. Ma and A. Hao, J. Appl. Phys., 2014, 115, 104105 CrossRef.
- J. Li, F. Li and S. J. Zhang, J. Am. Ceram. Soc., 2014, 97, 1–27 CrossRef.
- F. Rubio-Marcos, R. López-Juárez, R. E. Rojas-Hernandez, A. D. Campo, N. Razo-Pérez and J. F. Fernandez, ACS Appl. Mater. Interfaces, 2015, 7, 23080–23088 CrossRef PubMed.
- G. Viola, T. Saunders, X. Wei, K. B. Chong, H. Luo, M. J. Reece and H. Yan, J. Adv. Dielectr., 2013, 3, 1350007–1350011 CrossRef.
- P. Li, J. Zhai, B. Shen, S. Zhang, X. Li, F. Zhu and X. Zhang, Adv. Mater., 2018, 30(8), 1705171 CrossRef PubMed.
- B. Liu, P. Li, B. Shen, J. Zhai, Y. Zhang, F. Li and X. Liu, J. Am. Ceram. Soc., 2018, 101(1), 265–273 CrossRef.
- B. Liu, X. Liu, P. Li, F. Li, B. Shen and J. Zhai, RSC Adv., 2017, 7(66), 41788–41795 RSC.
- X. Lv, J. Wu, D. Xiao, J. Zhu, J. Zhang and X. X. Zhang, Adv. Electron. Mater., 2018, 1800205 CrossRef.
| This journal is © The Royal Society of Chemistry 2018 |

