 Open Access Article
Novel SrLaAlO4:Mn4+ deep-red emitting phosphors with excellent responsiveness to phytochrome PFR for plant cultivation LEDs: synthesis, photoluminescence properties, and thermal stability
K. Sankarasubramaniana,
Balaji Devakumara,
G. Annaduraia,
Liangling Suna,
Yu-Jia Zeng *b and
Xiaoyong Huang
 *a
*a
aKey Lab of Advanced Transducers and Intelligent Control System, Ministry of Education and Shanxi Province, College of Physics and Optoelectronics, Taiyuan University of Technology, Taiyuan 030024, P. R. China. E-mail: huangxy04@126.com
bShenzhen Key Laboratory of Laser Engineering, College of Optoelectronic Engineering, Shenzhen University, Shenzhen 518060, P. R. China. E-mail: yjzeng@szu.edu.cn
First published on 28th August 2018
Abstract
Herein, novel rare-earth-free Mn4+-doped SrLaAlO4 deep-red emitting phosphors were successfully synthesized via a traditional solid-state reaction method. The crystal structure and phase purity of the as-prepared samples were confirmed by XRD Rietveld refinement. Photoluminescence properties of SrLaAlO4:Mn4+ phosphors were examined in detail using photoluminescence spectra, decay lifetimes, temperature-dependent emission spectra and internal quantum efficiency measurements. The excitation spectrum obtained by monitoring at 730 nm contained two excitation bands centered at 364 and 520 nm within the range of 200–550 nm due to the Mn4+–O2− charge-transfer band and the 4A2g → 4T1g, 4T2g transitions of the Mn4+ ions. Under the 364 nm excitation, the SrLaAlO4:Mn4+ phosphors exhibited an intense deep-red emission band in 610–790 nm wavelength range peaking at 730 nm, which was assigned to the 2Eg → 4A2g transition of Mn4+ ions. The deep red emission showed excellent responsiveness to phytochrome PFR, revealing that the SrLaAlO4:0.4% Mn4+ phosphors possessed a possible application in deep-red light-emitting diodes (LEDs) for plant cultivation. The optimal doping concentration of Mn4+ ions was found to be 0.4 mol%. The critical distance Rc for energy transfer among Mn4+ ions was determined to be 5.86 Å and the concentration quenching mechanism was confirmed to be the electric dipole–dipole interaction. In addition, the Commission International de I'Eclairage (CIE) colour coordinates of the SrLaAlO4:0.4% Mn4+ phosphors (0.734, 0.266) were located in the deep red region and the corresponding internal quantum efficiency was measured to be about 29%. The above results confirmed that the as-prepared SrLaAlO4:0.4% Mn4+ deep red emitting phosphors might be a potential candidate for plant cultivation LEDs.
Introduction
Inorganic phosphors with outstanding optical properties have been broadly used over the past decades in many applications, such as, solid-state lighting, displays, optical temperature sensors, solar cells, and plant cultivation.1–15 Currently, light-emitting diodes (LEDs) are used as light sources for indoor plant cultivation in the agricultural area, which leads to improved plant cultivation within a natural atmosphere (e.g., light, water, air, temperature, and growth media).16–18 Artificial light sources are important for indoor plant cultivation to enhance the growth of plant tissues. The absorption spectra of photosynthesis pigments like chlorophyll and carotenoid match well with the light sources of blue and red LEDs. It has been reported that blue light with the wavelength of 410–500 nm affects the growth of chlorophyll, leaf morphogenesis, flower-bud formation, stomatal opening, and phototropism, and red light with the wavelength of 610–700 nm may be supportive to develop the vegetative flowering, budding, and internodal elongation, while the far-red light around 730 nm promotes the plant cultivation and photosynthesis.19–22 Hence, it is essential to find alternative high colour purity red or deep red emitting phosphors.Eu3+ and Sm3+ doped red phosphors are widely used in many fields, but their limitations in LEDs applications are mainly due to their sharp absorption peaks in ultraviolet (UV) and blue regions; and moreover, most of rare earth ions are costly. In addition, Eu2+ doped oxynitrides and nitrides based red phosphors also have some unavoidable deficiencies in practical applications caused by their critical synthesis process, because high temperature and high pressure are needed for their preparation.23–27 In recent years, many researchers intended to find eco-friendly non-rare-earth ions activated red-emitting phosphors. Compared with Eu3+ and Sm3+ doped red phosphors, Mn4+ ions activated phosphors show several important advantages, such as strong excitation peak at 300 to 480 nm and strong emission in the range from 600 to 780 nm, economically cheap and no absorption in green spectral range.12,28–32 Mn4+ ions could be suitable activators for replacing the Al3+, Ti4+, Zr4+, Si4+ or Ge4+ sites in the host materials and give rise to red or deep red emissions originating from spin-forbidden 2Eg → 4A2g transition of Mn4+ ions. The Mn4+ activated fluorides usually display red emissions around 620–640 nm because of their weak hybridization effect. In sharp contrast, Mn4+ activated oxide materials generally exhibit deep-red emissions with wavelengths longer than 650 nm owing to their strong hybridization effect. In recent years, many researchers investigated the Mn4+ activated oxide-based phosphors due to their chemical stability and eco-friendly synthesis process.33–46
In this work, we reported on novel deep red emitting Mn4+-activated SrLaAlO4 phosphors prepared by using conventional high-temperature solid-state reaction method. The crystal structure, morphology, and luminescence properties of SrLaAlO4:Mn4+ phosphors were investigated in detail. The SrLaAlO4 compound crystallizes in tetragonal structure with the space group of I4/mmm. In SrLaAlO4 host, Al3+ ion is octahedrally coordinated with six oxygens, and thus Mn4+ ions would occupy Al3+ sites in SrLaAlO4 host lattice due to their close ionic radii. Under 364 nm near-UV excitation, the SrLaAlO4:Mn4+ phosphors exhibited deep red emission in the 650–800 nm wavelength range peaking at 730 nm, which matched well with the absorption spectra of phytochrome PFR. The optimal doping concentration of Mn4+ ions was 0.4 mol%, and the corresponding internal quantum efficiency (IQE) of the SrLaAlO4:0.4% Mn4+ phosphor was found to be about 29%. Finally, a deep-red LED device was fabricated by coating the as-prepared SrLaAlO4:0.4% Mn4+ phosphors on the surface of a 365 nm InGaN LED chip. The results demonstrated the SrLaAlO4:Mn4+ phosphors could be new non-rare-earth-based red emitting luminescence materials for applications in plant cultivation LEDs.
Experimental
The SrLaAl1−xO4:xMn4+ (abbreviated as SLA:xMn4+: x = 0.1%, 0.2%, 0.4%, 0.6%, 0.8% and 1%) phosphors with various Mn4+ doping concentrations were prepared via solid-state reaction method. The SrCO3 (analytical reagent, A.R.), La2O3 (99.99%), Al2O3 (A.R.), and MnCO3 (A.R.) were used as the source materials of Sr, La, Al and Mn, respectively. According to the stoichiometric ratio, the SrCO3, La2O3, Al2O3 and MnCO3 were weighed and the mixture was ground thoroughly using an agate mortar. Then, this uniform mixture was placed in an alumina crucible and sintered at 1500 °C for 6 h in air atmosphere. Finally, the product was allowed to cool down to room temperature, and re-ground for further characterization.The crystal system of SLA:Mn4+ phosphors were characterized using powder X-ray diffraction (XRD) pattern (Bruker D8 Advance, CuKα radiation). Rietveld refinement of the prepared sample was performed by the FULLPROF software. The surface morphological and elemental mapping of the SLA:0.4% Mn4+ phosphors were performed using a field-emission scanning electron microscope (FE-SEM; MAIA3 TESCAN). The room-temperature photoluminescence (PL) and photoluminescence excitation (PLE) as well as decay curves were recorded using Edinburgh FS5 spectrofluorometer equipped with a 150 W continuous-wavelength xenon lamp and a pulsed xenon lamp as the excitation source, respectively. The IQE measurement was achieved by using Edinburgh FS5 spectrofluorometer equipped with an integrating sphere coated with barium sulphate. The temperature-dependent emission spectra were measured by using Edinburgh FS5 spectrofluorometer in the range of 303–483 K and the temperature was tuned by the temperature controlling system.
Results and discussion
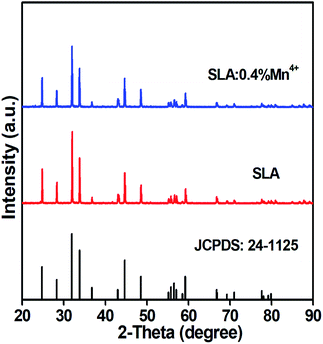
The phase purity and crystalline nature of the as-prepared SLA:0.4% Mn4+ phosphors were examined using XRD. Fig. 1 shows the XRD patterns of pure SLA and 0.4% Mn4+ doped SLA phosphors. It can be seen that all diffraction peaks matched well with standard data of SLA (JCPDS card 24-1125), which belongs to the tetragonal crystal system.47 Any other crystalline phase was not observed after the doping of Mn4+ ions. The inclusion of Mn4+ ion into the SLA lattice did not induce any significant change on the crystal system of the host because of their similar valence and ionic radii of Al3+ (r = 0.535 Å) and Mn4+ (r = 0.530 Å) ions.48,49 The radius percentage value of SLA:0.4% Mn4+ phosphors was calculated using the formula:50
 | (1) |
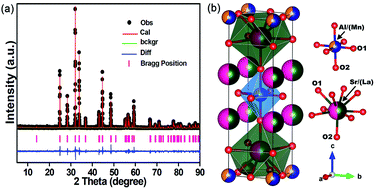
Fig. 2(a) shows the observed (black rounds), calculated (solid line), and different (bottom) XRD profiles for the Rietveld refinement of SLA:0.4% Mn4+ phosphors. From the XRD pattern, all the diffraction peaks were effectively indexed by tetragonal crystal system with the space group of I4/mmm. For SLA:0.4% Mn4+ phosphors, the lattice parameter values were calculated to be a = b = 3.75545 Å, c = 12.63941 Å and V = 178.258 Å3 and the refinement finally converged to Rp = 8.97% and Rwp = 11.34%, indicating the refined atom, peak position and fraction factors obeyed the reflection conditions. Fig. 2(b) shows the schematic diagram of the SLA:0.4% Mn4+ structure in tetragonal crystal system, in which Sr or Al atoms are coordinated by six O atoms, belonging to octahedral symmetry.
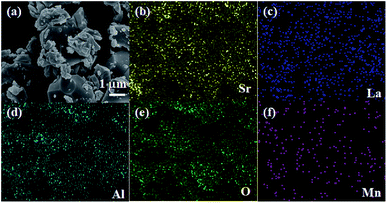
Fig. 3(a) represents the FE-SEM image of the SLA:0.4% Mn4+ phosphors. The particles were aggregated with irregular morphology. Approximately the size of the particles was in micrometer range. Meanwhile, the elemental mapping result confirmed that the Sr, La, Al, O and Mn elements were uniformly distributed throughout the particles, as indicated in Fig. 3(b–f).
Fig. 4(a) shows the PLE and PL spectra of SLA:0.4% Mn4+ phosphors. The PLE spectrum monitored at 730 nm contained two broad excitation bands in the range of 250–550 nm, which could be well fitted by Gaussian peaks centered at 335, 381, 455 and 519 nm corresponding to the Mn4+–O2− charge transfer band, the 4A2g → 4T1g, 4A2g → 2T2g and 4A2g → 4T2g transitions of Mn4+ ions. Under the 364 nm excitation, the obtained PL spectrum showed an intense emission band in the deep red range of 650–800 nm peaking at 730 nm, corresponding to the 2Eg → 4A2g vibronic transition of Mn4+ ions.52,53 In Fig. 4(b), the PL spectrum of SLA:0.4% Mn4+ phosphors was compared with the absorption spectra of phytochrome PR and PFR. The absorption spectrum of phytochrome PFR was centered at about 730 nm. Obviously a considerable overlap was found between the emission spectrum of SLA:0.4% Mn4+ phosphors and the absorption spectrum of phytochrome PFR, which confirmed that the SLA:0.4% Mn4+ phosphor might be used for indoor plant cultivation as far-red emitting light source.
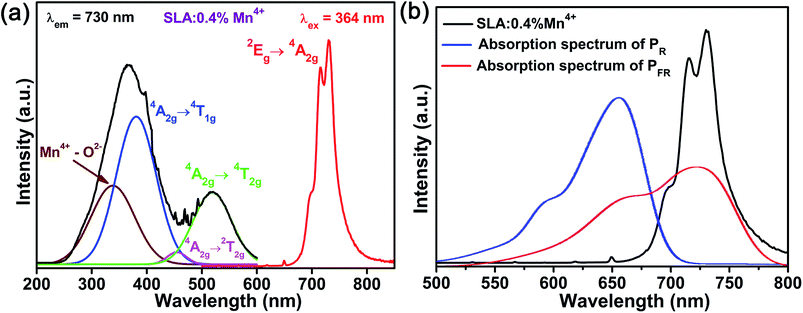 | ||
| Fig. 4 (a) Room-temperature PLE and PL spectra of SLA:0.4% Mn4+ phosphors. (b) PL spectrum of SLA:0.4% Mn4+ phosphors and the absorption spectra of phytochrome PFR and PR. | ||
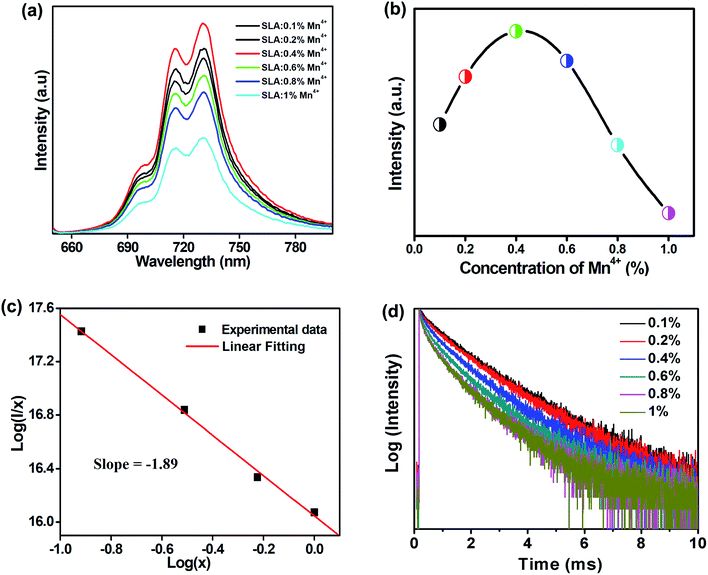
Fig. 5(a) shows the room-temperature PL spectra of SLA:xMn4+ phosphors with different Mn4+ concentrations under the excitation of 364 nm. It can be examined that all the emission peak positions and shapes have no noticeable change with altering Mn4+ ion concentration except the intensity. Fig. 5(b) shows the PL intensity as a function of Mn4+ doping concentration in SLA:xMn4+ phosphors. It was obvious that, the PL intensity of Mn4+ increased at first, until it reached the maximum at x = 0.4%, then it decreased slowly with increasing doping concentration, which was attributed to the concentration quenching effect. The decrease in PL intensity with increasing Mn4+ doping concentration may be due to the increase in nonradioactive decay, which was more possible beyond the optimal doping concentration. It has identified that the energy transfer is inversely proportional to Rn, where R is the distance between the neighbouring Mn4+ ions, and then the Rc could be calculated from the concentration quenching data. The Rc between Mn4+ ions can be calculated using the following formula:54
 | (2) |
 | (3) |
Fig. 5(d) shows the concentration-dependent PL decay curves of SLA:xMn4+(x = 0.1%, 0.2%, 0.4%, 0.6%, 0.8%, and 1%) phosphors monitored at 730 nm under the excitation of 364 nm. The PL decay curves were fitted by a single exponential decay equation:
I(t) = I0 + A![[thin space (1/6-em)]](https://www.rsc.org/images/entities/char_2009.gif) exp(−t/τ) exp(−t/τ)
| (4) |
CIE coordinates are very essential to reveal that the exact emission and colour purity of the sample. Fig. 6 illustrates the CIE chromaticity diagram of SLA:0.4% Mn4+phosphors with the excitation of 364 nm. The CIE coordinate values of the SLA:0.4% Mn4+ phosphors were calculated to be (0.734, 0.266), which located in the deep red region. The inset of Fig. 6 shows the digital image of the SLA:0.4% Mn4+ phosphors under the excitation of 365 nm UV-lamp.
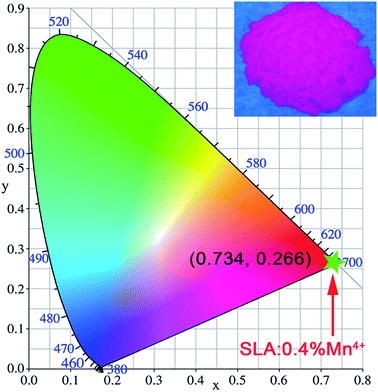 | ||
| Fig. 6 CIE chromaticity coordinates of SLA:0.4% Mn4+ phosphors (λex = 364 nm). Inset shows the image of SLA:0.4% Mn4+ phosphors under 365 nm UV lamp. | ||
IQE value of SLA:0.4% Mn4+ phosphors with the excitation of 364 nm was measured using an integrating sphere. The IQE value can be calculated using the following equation:59
 | (5) |
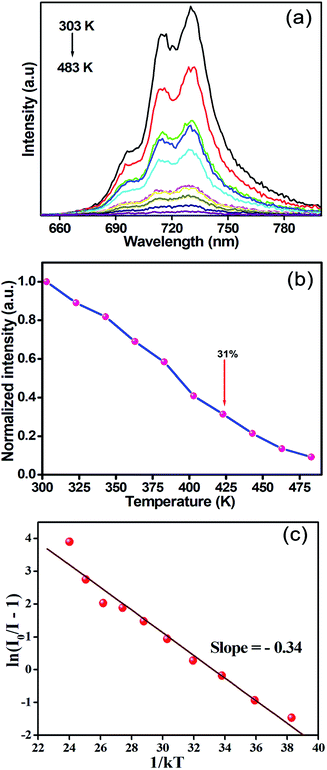
The thermal behaviour is an important parameter for phosphors in practical application. Fig. 7(a) shows the temperature-dependent PL spectra of SLA:0.4% Mn4+ deep red emitting phosphors recorded at various temperatures in the range of 303–483 K under the excitation of 364 nm. Clearly, the PL intensity decreased with increasing of temperature due to the thermal quenching effect. Fig. 7(b) shows the normalized PL intensity of SLA:0.4% Mn4+ phosphors as a function of various temperatures. It can be clearly seen that the PL intensity at the temperature of 423 K was found to be about 31% of that at 303 K, which was better than the reported value of 27% of Gd2ZnTiO6:Mn4+ phosphors.64 Furthermore, considerable changes were not found in their spectra, which indicated that the as-prepared SLA:Mn4+ phosphors offered low thermal stability due to its charge compensation-related defects induced by the replacement of Mn4+ ion into Al3+ host site (not stable at temperatures above 250 K). The activation energy was calculated using Arrhenius equation, which can be explained below as:65
 | (6) |
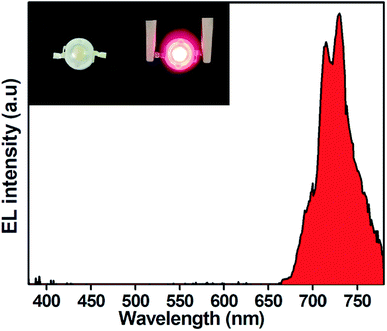
A deep red emitting LED device was fabricated by using SLA:0.4% Mn4+ phosphors combined with a 365 nm emitting InGaN LED chip. The electroluminescence (EL) spectrum of as-prepared LED device under 20 mA and 3.17 V was shown in Fig. 8. A strong red emission peak at 730 nm in the wavelength range of 650–800 nm was observed. The luminous efficacy value of the as-fabricated LED device was 0.09 lm W−1. The low luminous efficacy may be attributed to the presence of strong emission peak displayed by SLA:0.4% Mn4+ phosphors in the deep red spectral region, where the human eye sensitivity is very low. However, the plants are sensitive in the deep red light. Therefore, the SLA:0.4% Mn4+ phosphors could be used to fabricate deep red-emitting LEDs towards indoor plant cultivation.
Conclusions
In conclusion, we have successfully synthesized deep red emitting SLA:0.4% Mn4+ phosphors using conventional high-temperature solid-state reaction method. The role of Mn4+ ions on crystal structure and photoluminescence properties of SLA phosphors was systematically investigated. XRD and Rietveld refinement data proved that the SLA:0.4% Mn4+ phosphors were indexed by tetragonal crystal system. The SLA:0.4% Mn4+ phosphors exhibited deep red emission peaking at 730 nm under the excitation of 364 nm, and the resultant CIE coordinate values were (0.734, 0.266). The critical energy transfer distance of these phosphors was calculated to be 35.48 Å and the concentration quenching mechanism was confirmed to be the d–d interaction between Mn4+ ions. Decay lifetime values of SLA:xMn4+ phosphors gradually decreased with increasing of Mn4+ concentration. Meanwhile, the SLA:0.4% Mn4+ deep red phosphors also exhibited proper thermal stability, in addition, a deep-red LED device was fabricated using a 365 nm InGaN chip combined with the SLA:0.4% Mn4+ red emitting phosphors. The results indicated SLA:0.4% Mn4+ phosphors would be promising candidate as a deep red phosphor for plant cultivation LEDs applications.Conflicts of interest
There are no conflicts to declare.Acknowledgements
The present research work was supported by the National Natural Science Foundation of China (No. 51502190), the Program for the Outstanding Innovative Teams of Higher Learning Institutions of Shanxi, and the Open Fund of the State Key Laboratory of Luminescent Materials and Devices (South China University of Technology, No. 2017-skllmd-01).Notes and references
- M. Chen, Z. Xia and Q. Liu, J. Mater. Chem. C, 2015, 3, 4197–4204 RSC.
- S.-P. Lee, T.-S. Chan and T.-M. Chen, ACS Appl. Mater. Interfaces, 2014, 7, 40–44 CrossRef PubMed.
- R. Cao, D. Peng, H. Xu, S. Jiang, Z. Luo, H. Ao and P. Liu, J. Lumin., 2016, 178, 388–391 CrossRef.
- N. Zhang, C. Guo, L. Yin, J. Zhang and M. Wu, J. Alloys Compd., 2015, 635, 66–72 CrossRef.
- X. Huang, Nat. Photonics, 2014, 8, 748–749 CrossRef.
- P. Du, Y. Guo, S. H. Lee and J. S. Yu, RSC Adv., 2017, 7, 3170–3178 RSC.
- B. Li, X. Huang, H. Guo and Y. Zeng, Dyes Pigm., 2018, 150, 67–72 CrossRef.
- X. Huang, J. Alloys Compd., 2017, 690, 356–359 CrossRef.
- X. Huang, B. Li and H. Guo, J. Alloys Compd., 2017, 695, 2773–2780 CrossRef.
- P. Du, X. Huang and J. S. Yu, Inorg. Chem. Front., 2017, 4, 1987–1995 RSC.
- P. Du, X. Huang and J. S. Yu, Chem. Eng. J., 2018, 337, 91–100 CrossRef.
- Q. Sun, S. Wang, B. Li, H. Guo and X. Huang, J. Lumin., 2018, 203, 371–375 CrossRef.
- X. Huang, S. Wang, B. Li, Q. Sun and H. Guo, Opt. Lett., 2018, 43, 1307–1310 CrossRef PubMed.
- X. Huang, B. Li, H. Guo and D. Chen, Dyes Pigm., 2017, 143, 86–94 CrossRef.
- P. Du, L. Luo, X. Huang and J. S. Yu, J. Colloid Interface Sci., 2018, 514, 172–181 CrossRef PubMed.
- G. Tamulaitis, P. Duchovskis, Z. Bliznikas, K. Breive, R. Ulinskaite, A. Brazaityte, A. Novičkovas and A. Žukauskas, J. Phys. D: Appl. Phys., 2005, 38, 3182–3187 CrossRef.
- M. Olle and A. Viršile, Agric. Food Sci., 2013, 22, 223–234 CrossRef.
- G. D. Massa, H.-H. Kim, R. M. Wheeler and C. A. Mitchell, HortScience, 2008, 43, 1951–1956 Search PubMed.
- J. Chen, N. Zhang, C. Guo, F. Pan, X. Zhou, H. Suo, X. Zhao and E. M. Goldys, ACS Appl. Mater. Interfaces, 2016, 8, 20856–20864 CrossRef PubMed.
- N. Yeh, T. J. Ding and P. Yeh, Renewable Sustainable Energy Rev., 2015, 51, 55–61 CrossRef.
- C. Koc, G. A. Anderson and A. Kommareddy, Isr. J. Aquac., 2013, 65, 797–805 Search PubMed.
- H. G. Choi, B. Y. Moon and N. J. Kang, Sci. Hortic., 2015, 189, 22–31 CrossRef.
- C.-W. Yeh, W.-T. Chen, R.-S. Liu, S.-F. Hu, H.-S. Sheu, J.-M. Chen and H. T. Hintzen, J. Am. Chem. Soc., 2012, 134, 14108–14117 CrossRef PubMed.
- X. Zhang, L. Zhou, Q. Pang, J. Shi and M. Gong, J. Phys. Chem. C, 2014, 118, 7591–7598 CrossRef.
- H. Li, R. Zhao, Y. Jia, W. Sun, J. Fu, L. Jiang, S. Zhang, R. Pang and C. Li, ACS Appl. Mater. Interfaces, 2014, 6, 3163–3169 CrossRef PubMed.
- X. Huang, H. Guo and B. Li, J. Alloys Compd., 2017, 720, 29–38 CrossRef.
- X. Huang, B. Li, P. Du, H. Guo, R. Cao, J. S. Yu, K. Wang and X. W. Sun, Dyes Pigm., 2018, 151, 202–210 CrossRef.
- H. Zhu, C. C. Lin, W. Luo, S. Shu, Z. Liu, Y. Liu, J. Kong, E. Ma, Y. Cao, R.-S. Liu and X. Chen, Nat. Commun., 2014, 5, 4312–4317 CrossRef PubMed.
- S. Okamoto and H. Yamamoto, J. Electrochem. Soc., 2010, 157, J59–J63 CrossRef.
- M. Peng, X. Yin, P. A. Tanner, C. Liang, P. Li, Q. Zhang and J. Qiu, J. Am. Ceram. Soc., 2013, 96, 2870–2876 CrossRef.
- Y. Tanabe and S. Sugano, J. Phys. Soc. Jpn., 1954, 9, 766–779 CrossRef.
- X. Huang, J. Liang, B. Li, L. Sun and J. Lin, Opt. Lett., 2018, 43, 3305–3308 CrossRef PubMed.
- B. Wang, H. Lin, J. Xu, H. Chen and Y. Wang, ACS Appl. Mater. Interfaces, 2014, 6, 22905–22913 CrossRef PubMed.
- M. Brik, S. Camardello and A. Srivastava, ECS J. Solid State Sci. Technol., 2015, 4, R39–R43 CrossRef.
- S. Zhang, Y. Hu, H. Duan, L. Chen, Y. Fu, G. Ju, T. Wang and M. He, RSC Adv., 2015, 5, 90499–90507 RSC.
- R. Cao, W. Luo, Q. Xiong, A. Liang, S. Jiang and Y. Xu, J. Alloys Compd., 2015, 648, 937–941 CrossRef.
- T. Sasaki, J. Fukushima, Y. Hayashi and H. Takizawa, Chem. Lett., 2014, 43, 1061–1063 CrossRef.
- Y. Zhydachevskii, A. Suchocki, A. Pajączkowska, A. Kłos, A. Szysiak and A. Reszka, Opt. Mater., 2013, 35, 1664–1668 CrossRef.
- S. Adachi, J. Lumin., 2018, 197, 119–130 CrossRef.
- S. Adachi, J. Lumin., 2018, 202, 263–281 CrossRef.
- X. Huang and H. Guo, Dyes Pigm., 2018, 152, 36–42 CrossRef.
- Q. Sun, B. Li, S. Wang, H. Guo and X. Huang, J. Mater. Sci.: Mater. Electron., 2018, 29, 12972–12977 CrossRef.
- J. Liang, L. Sun, B. Devakumar, S. Wang, Q. Sun, H. Guo, B. Li and X. Huang, RSC Adv., 2018, 8, 27144–27151 RSC.
- Q. Sun, S. Wang, B. Devakumar, B. Li, L. Sun, J. Liang and X. Huang, RSC Adv., 2018, 8, 28538–28545 RSC.
- K. Li, H. Lian and R. Van Deun, J. Lumin., 2018, 198, 155–162 CrossRef.
- K. Li, H. Lian and R. Van Deun, Dalton Trans., 2018, 47, 2501–2505 RSC.
- B. Liu, L. Li, X. Q. Liu and X. M. Chen, J. Mater. Chem. C, 2016, 4, 4684–4691 RSC.
- A. Bergstein and W. B. White, J. Electrochem. Soc., 1971, 118, 1166–1171 CrossRef.
- Y. Pan and G. Liu, Opt. Lett., 2008, 33, 1816–1818 CrossRef PubMed.
- Y. Zhang, X. Li, K. Li, H. Lian, M. Shang and J. Lin, ACS Appl. Mater. Interfaces, 2015, 7, 2715–2725 CrossRef PubMed.
- H. Y. Jiao and Y. Wang, Physica B, 2012, 407, 2729–2733 CrossRef.
- A. Srivastava and M. Brik, J. Lumin., 2012, 132, 579–584 CrossRef.
- R. Cao, Q. Xiong, W. Luo, D. Wu, X. Fen and X. Yu, Ceram. Int., 2015, 41, 7191–7196 CrossRef.
- G. Blasse, J. Solid State Chem., 1986, 62, 207–211 CrossRef.
- L. Van Uitert, J. Electrochem. Soc., 1967, 114, 1048–1053 CrossRef.
- Z. Xia, H. Liu, X. Li and C. Liu, Dalton Trans., 2013, 42, 16588–16595 RSC.
- G. Y. Lee, J. Y. Han, W. B. Im, S. H. Cheong and D. Y. Jeon, Inorg. Chem., 2012, 51, 10688–10694 CrossRef PubMed.
- J. Y. Han, W. B. Im, G.-y. Lee and D. Y. Jeon, J. Mater. Chem., 2012, 22, 8793–8798 RSC.
- T. Wei, Q. Ren, X. Wu, X. Shi, B. Wang and Z. Huo, Opt. Laser Technol., 2016, 85, 7–13 CrossRef.
- L. Li, Y. Pan, Z. Chen, S. Huang and M. Wu, RSC Adv., 2017, 7, 14868–14875 RSC.
- L. Xi, Y. Pan, S. Huang and G. Liu, RSC Adv., 2016, 6, 76251–76258 RSC.
- J. Zhong, D. Chen, X. Chen, K. Wang, X. Li, Y. Zhu and Z. Ji, Dalton Trans., 2018, 47, 6528–6537 RSC.
- S. Sakurai, T. Nakamura and S. Adachi, ECS J. Solid State Sci. Technol., 2016, 5, R206–R210 CrossRef.
- H. Chen, H. Lin, Q. Huang, F. Huang, J. Xu, B. Wang, Z. Lin, J. Zhou and Y. Wang, J. Mater. Chem. C, 2016, 4, 2374–2381 RSC.
- H. Guo, X. Huang and Y. Zeng, J. Alloys Compd., 2018, 741, 300–306 CrossRef.
| This journal is © The Royal Society of Chemistry 2018 |

