 Open Access Article
Creative Commons Attribution 3.0 Unported Licence
Self-calibrated optical thermometer based on luminescence from SrLu2O4:Bi3+,Eu3+ phosphors
Xueyan Chen,
Zhigang Zheng,
Liming Teng,
Rongfei Wei,
Fangfang Hu and
Hai Guo *
*
Department of Physics, Zhejiang Normal University, Jinhua, Zhejiang 321004, China. E-mail: ghh@zjnu.cn
First published on 16th October 2018
Abstract
Bi3+,Eu3+ co-doped SrLu2O4 phosphors were synthesized by a solid state reaction method. Their structural, luminescent and temperature sensing properties have been systematically investigated. The color-tunable emissions from violet to red were detected with the increase of Eu3+ concentration. Relying on energy transfer process from Bi3+ to Eu3+ and thermal quenching behaviour, the fluorescence intensity ratio (FIR) presents excellent temperature sensing performance. The maximum absolute and relative sensitivities reach 1.10% K−1 and 0.87% K−1, respectively. These meaningful results indicate that SrLu2O4:Bi3+,Eu3+ is a promising material for optical temperature sensing.
Introduction
Recently, optical temperature sensors based on non-contact detection mode with rare earth (RE) ions doped luminescent materials have attracted extensive attention.1–8 Commonly, temperature sensing optical parameters, such as emission intensity, luminescent lifetime and the fluorescence intensity ratio (FIR) have been widely adopted for their non-contact operating mode.5,9 However, the measurement accuracy of temperature sensing strategy, which is based on the emission intensity, could be strongly affected by the external factors.10 Optical thermometry based on FIR technique, by contrast, can reduce the dependence of measurement conditions and have obvious advantages, such as no requirement for contact, high sensitivity, rapid response, as well as high spatial and temperature resolutions.4Therefore, searching for a FIR temperature sensing material, whose spectra display two discriminable peaks with different temperature-dependent luminescent behaviours, is an important way to develop optical thermometry.1 In recent years, a series of FIR-based investigations have been systematically explored in order to search for high temperature sensitivity materials.4,6,11 The typical conventional researches focus on the thermally coupled energy levels (TCEL) of RE ions, the relative sensitivities of which are difficult to promote due to their inherent energy gap.12,13 Herein, a great many novel strategies and luminescent materials have been extensively investigated in order to promote relative sensitivity. According to the diverse thermal quenching behaviours of two intervalence charge transfer (IVCT) states, a novel thermometry strategy was proposed in 2016.1 Another typical strategy was based on the diversity in thermal behaviour of dual activators doped in separated matrixes.14 Other kind of thermometry strategy was based on the phonon assisted energy transfer between RE ions (e.g. Eu3+ and Tb3+) doped in metal–organic framework.15
It is well known that RE ions doped luminescent materials are plentiful luminescent resources due to their abundant energy levels.16,17 Eu3+ ion is a red activator originating from 5D0–7FJ (J = 0, 1, 2, 3, 4) transitions under UV light excitation.17,18 Bi3+ ion is another kind of activator, whose luminescence is attributed to the transition from 6s2 to 6s6p with broad absorption band in UV region.19,20 Bi3+ ion can emit various wavelength including ultraviolet, blue, green, yellow and even red bands in different hosts.19 These excellent luminescent properties make Bi3+ ion becomes a sensitizer to enhance Eu3+ emission in various hosts.16–22 Eu3+ doped SrLu2O4 and SrGd2O4 have been considered as promising red phosphors in solid state lighting devices.23,24 But energy transfer from Bi3+ to Eu3+ and temperature sensing property in SrLu2O4 have never been investigated.
In this work, a series of Bi3+,Eu3+ co-doped SrLu2O4 phosphors were successfully synthesized by a solid state reaction method. The structural, luminescent and temperature sensing properties were investigated in detail. With the increase of Eu3+ content in SrLu2O4:0.005Bi3+,yEu3+, tunable emission including violet, pink and red can be observed owing to energy transfer from Bi3+ to Eu3+. Moreover, based on the opposite temperature dependence of Bi3+ and Eu3+ emission intensities, the temperature sensitivities reach high in the range from 315 to 543 K. More importantly, the main emission peak of Eu3+ and band of Bi3+ are well separated, providing an excellent signal discriminability for temperature sensing and detection.
Experimental
A series of SrLu1.9O4:0.1Eu3+, SrLu2−xO4:xBi3+ (x = 0, 0.25, 0.5, 1, 3%), and SrLu2−0.005−yO4:0.005Bi3+,yEu3+ (y = 0, 0.5, 2.5, 6, 10 and 12.5%) samples were prepared by conventional solid state reaction method. In this paper, SrLu1.9O4:0.1Eu3+, SrLu2−xO4:xBi3+, and SrLu2−0.005−yO4:0.005Bi3+,yEu3+ are briefly labelled as SrLu2O4:10% Eu3+, SrLu2O4:xBi3+, and SrLu2O4:Bi3+,yEu3+, respectively. SrCO3 (A.R.), Bi2O3 (99.99%), Lu2O3 (99.99%) and Eu2O3 (99.99%) were used as starting materials. 2 wt% NH4Cl (A.R.) was used as flux. The raw materials were mixed in an appropriate molar ratio and thoroughly grounded for 30 min in an agate mortar. The powder mixtures were put into crucibles and sintered at 900 °C for 3 h in air. After repeated grinding, they were sintered at 1300 °C for 10 h in air. The resulted samples were cooled down to room temperature and pulverized. Then the final products were gained for further characterization.The crystalline structure of phosphors were investigated by X-ray diffraction (XRD) on a Rigaku MiniFlex/600 X-ray diffraction apparatus (Tokyo, Japan) with CuKα (λ = 0.154056 nm) radiation at 40 kV and 15 mA in a step size of 0.02°. The morphologies of samples were recorded by scanning electron microscope (Phenom ProX desktop SEM). The excitation and emission spectra were performed on an Edinburgh FS5 spectrofluorometer equipped with a continuous wave 150 W Xe lamp. Temperature-dependent luminescent spectra were measured using FS5 spectrofluorometer equipped with a TCB1402C temperature controller (China). Lifetime measurement was acquired on an Edinburgh FLS920 spectrofluorometer equipped with a nanosecond flashlamp (nF900) as excitation source. All measurements were performed at room temperature except temperature-dependent spectra.
Results and discussion
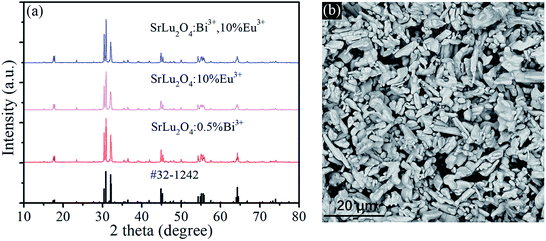
Fig. 1(a) shows the XRD patterns of SrLu2O4:Bi3+,10% Eu3+, SrLu2O4:10% Eu3+ and SrLu2O4:0.5% Bi3+ samples with NH4Cl as flux, which can improve the crystallization, decrease the crystallization temperature and surface defect. Both Bi3+ (r = 1.03 Å, CN = 6) and Eu3+ (r = 0.947 Å, CN = 6) ions are suggested to occupy the sites of Lu3+ (r = 0.861 Å, CN = 6) ion due to their similar radii and valence states. No trace of impure phase is observed when Bi3+ or Eu3+ ions are doped into this lattice. SEM image displayed in Fig. 1(b) exhibits that the synthesized SrLu2O4 products are uniform with smooth facets, whose mean size is approximately 10 μm.Room-temperature photoluminescence emission (λex = 327 nm) and excitation (λem = 393 nm) spectra of SrLu2O4:xBi3+ phosphors are presented in Fig. 2(a) and (b), respectively. Broadband blue emission from 350 to 510 nm with maximum at 393 nm is shown in emission spectra, which can be ascribed to the 3P1 → 1S0 transition of Bi3+.21 In excitation spectra monitored at 393 nm, there is an excitation band ranging from 300 to 360 nm centered at 327 nm which can be attributed to the spin-allowed 1S0 → 3P1 transition of Bi3+.21 With the increase of Bi3+ content, the emission and excitation intensities of Bi3+ increase sharply at first, reach the maximum at x = 0.5%, and then remarkably decrease when Bi3+ content is further increased due to concentration quenching.
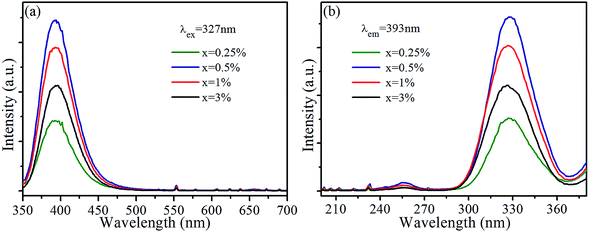 | ||
| Fig. 2 (a) Emission (λex = 327 nm) and (b) excitation (λem = 393 nm) spectra of SrLu2O4:xBi3+ (x = 0, 0.25, 0.5, 1, 3%) samples. | ||
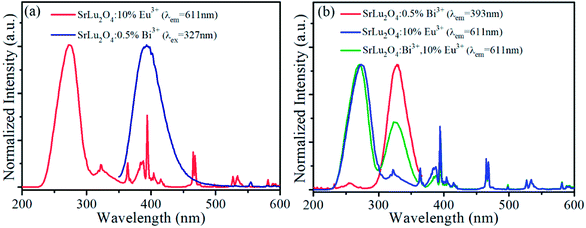
In order to explore energy transfer from Bi3+ to Eu3+ further, excitation spectra of SrLu2O4:10% Eu3+ (λem = 611 nm) and emission spectra of SrLu2O4:0.5% Bi3+ (λex = 327 nm) are revealed in Fig. 3(a). In excitation spectra, there is a broadband from 230 to 305 nm centered at 274 nm, which can be ascribed to Eu3+–O2− charge transfer transition.25 Due to 7F0 → 5D4, 5L7, 5L6, 5D2 and 5D1 transitions of Eu3+ ion, several weak excitation peaks at 322, 364, 394, 465, 527 nm can be observed.19,21,25 Meanwhile a broadband emission from 350 to 456 nm centered at 393 nm is presented in emission spectra ascribed to the 3P1 → 1S0 transition of Bi3+ ion. It is obvious that there is an overlap between emission spectra of Bi3+ and excitation spectra of Eu3+, indicating energy transfer process may occur from Bi3+ to Eu3+.
Normalized excitation spectra of SrLu2O4:10% Eu3+, SrLu2O4:Bi3+,10% Eu3+ and SrLu2O4:0.5% Bi3+ phosphors are displayed in Fig. 3(b). Excitation spectra of SrLu2O4:Bi3+,10% Eu3+ sample monitored Eu3+ emission (λem = 611 nm) ranging from 300 to 360 nm is almost similar with excitation spectra of SrLu2O4:0.5% Bi3+ sample monitored at 393 nm emission of Bi3+. These phenomena from Fig. 3 imply that a portion of emission intensity of Eu3+ comes from energy transfer process from Bi3+ to Eu3+.
On the other side, there is a band from 310 to 355 nm centered at 323 nm in excitation spectra of SrLu2O4:10% Eu3+. That means characteristic excitation wavelength of Bi3+ (λex = 327 nm) can also excite Eu3+ ion directly. To be specific, a competitive absorption exists between Bi3+ and Eu3+ ions in SrLu2O4:Bi3+,10% Eu3+.
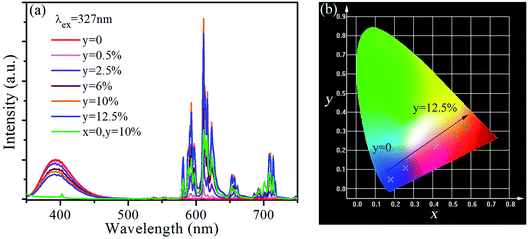
The emission spectra of SrLu2O4:Bi3+,yEu3+ (y = 0, 0.5, 2.5, 6, 10 and 12.5%) under 327 nm excitation are displayed in Fig. 4(a). As revealed in emission spectra, both emissions of Bi3+ and Eu3+ are observed. When the Eu3+ ion concentration increases, the red emission intensity increases rapidly and reaches the highest at 10%, after that the intensity decreases due to concentration quenching effect. However, the emission intensity from Bi3+ decreases slowly and monotonously with the increase of Eu3+ ion concentration. Therefore, conclusion can be drawn that the variation trend may owing to energy transfer from Bi3+ to Eu3+.
Fig. 4(b) gives the Commission International ed’Eclairage (CIE) chromaticity coordinates of SrLu2O4:Bi3+,yEu3+ (y = 0, 0.5, 2.5, 6, 10 and 12.5%) phosphors under 327 nm excitation. The CIE chromaticity coordinates vary from (0.1805, 0.0478) to (0.5761, 0.3194) corresponding to y = 0–12.5%, locating in violet, pink and red regions. It is well-known that red and violet lights can promote photosynthesis effectively, which implies the SrLu2O4:Bi3+,Eu3+ phosphors may act as promising candidate to promote the photosynthesis of plant.26–28
The energy transfer efficiency from Bi3+ sensitizer to Eu3+ acceptor can be calculated by the following equation:5,25,29
| η = 1 − IS/IS0 | (1) |
The luminescence decay curves of Bi3+ emission at 393 nm (λex = 327 nm) in all phosphors were displayed in Fig. 5(c). The average lifetime τ can be evaluated by the following equation:4,29
 | (2) |
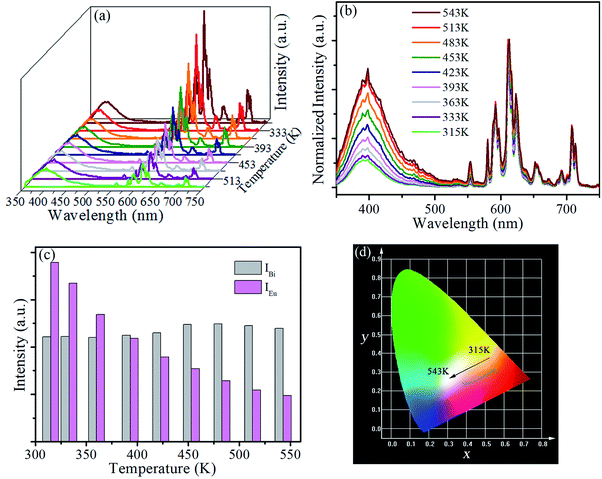
Furthermore, temperature-dependent emission behaviour of SrLu2O4:Bi3+,10% Eu3+ under 327 nm excitation has been systemically investigated in order to explore possible temperature sensing material. As displayed in Fig. 6(a), the Eu3+ emission intensity decreases rapidly, while the Bi3+ emission intensity increases slightly with an increase of temperature from 315 to 543 K. To better exhibit the relative emission intensities variation, luminescent spectra in the research temperature range normalized to the 611 nm emission peak of Eu3+ is depicted in the Fig. 6(b).
The integrated intensities of Bi3+ and Eu3+, as shown in Fig. 6(c), exhibit that the emission intensity of Eu3+ decreases greatly from 315 to 543 K. In contrast, the emission intensity of Bi3+ presents a slight rise. Such opposite temperature-dependent luminescent behaviour was adopted to investigate for the temperature sensing performance of SrLu2O4:Bi3+,Eu3+ sample. Not surprisingly, the remarkable change in FIR (IBi/IEu) results in the shift of emission color from red to pink as the CIE diagram displayed in Fig. 6(d).
According to the theory proposed by Struck and Fonger, the relationship between temperature and emission intensity can be expressed as:1
 | (3) |
To further assess the temperature sensing performance of the SrLu2O4:Bi3+,Eu3+ phosphor, the FIR (IBi/IEu) of Bi3+ to Eu3+ can be deduced from eqn (3) and expressed as follows:30
 | (4) |
 | (5) |
 | (6) |
The plots of temperature-dependent FIR can be fitted by eqn (4) from 315 to 543 K, as shown in Fig. 7(a). Consequently, the values of B, C and ΔE parameters in this fitting function can be determined to be 0.17, 19.40 and 1151.78 K, respectively.
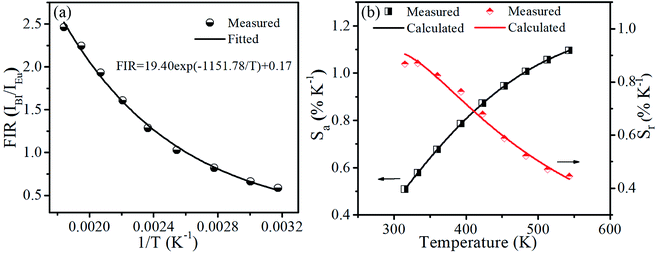 | ||
| Fig. 7 (a) Experimental measured and fitted plots of FIR (IBi/IEu) versus 1/T. (b) Absolute sensitivity Sa and relative sensitivity Sr versus temperature. | ||
Fig. 7(b) presents the Sa and Sr, which were deduced by eqn (5) and (6), respectively. It is clear that absolute sensitivity Sa increases monotonously from 315 to 543 K, while the relative sensitivity Sr decreases with the rise of temperature. Noteworthily, SrLu2O4:Bi3+,10% Eu3+ exhibits high temperature sensitivities with the maximal values of Sa and Sr are 1.10% K−1 and 0.87% K−1, respectively. The obtained Sa-max is higher than most RE ions doped phosphor materials, as listed in Table 1.
| Sensing materials | Temperature range (K) | Sa-max | Tmax | Ref. |
|---|---|---|---|---|
| SrMoO4:Er3+,Yb3+ | 93–773 | 0.0128 | 480 | 31 |
| NaLuF4:Yb3+,Er3+,Mn2+ | 295–525 | 0.01099 | 295 | 6 |
| ZnWO4:Er3+,Yb3+ | 83–583 | 0.0099 | 583 | 2 |
| YNbO4:Er3+ | 100–1600 | 0.0093 | 554 | 32 |
| LuNbO4:Mo6+,Er3+ | 323–673 | 0.0069 | — | 33 |
| Gd2O3:Er3+,Eu3+ | 300–443 | 0.0043 | 300 | 34 |
| Gd2TiO5:Yb3+,Er3+ | 298–573 | 0.004076 | 565 | 35 |
| Y2WO6:Tm3+,Yb3+ | 303–473 | 0.0034 | 303 | 36 |
| BaTiO3:Er3+ | 300–450 | 0.0032 | 400 | 37 |
| SrLu2O4:Bi3+,Eu3+ | 315–543 | 0.0110 | 543 | This work |
In order to evaluate reversibility, the temperature-recycle measurements are studied in SrLu2O4:Bi3+,10% Eu3+. As revealed in Fig. 8, the sample has an excellent repeatability of the temperature-dependent FIR. The above results demonstrate that SrLu2O4:Bi3+,Eu3+ phosphor is a promising material for optical temperature sensor.
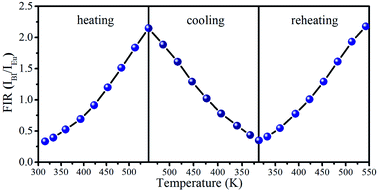 | ||
| Fig. 8 Temperature-dependent FIR (IBi/IEu) plots of in temperature cycling process from 315 to 543 K. | ||
Conclusions
SrLu2O4 phosphors doped with different concentrations of Bi3+ and Eu3+ were successfully synthesized by solid state reaction method. The energy transfer from Bi3+ to Eu3+ was investigated by luminescent properties and decay curves. With the increase of the doped Eu3+ concentration, the color-tunable emissions from violet to red were detected. Owing to the competitive absorption between Bi3+ and Eu3+ ions, the energy transfer efficiency from Bi3+ to Eu3+ is about 37.8%. Temperature-dependent emission behaviour of SrLu2O4:Bi3+,10% Eu3+ under 327 nm excitation has been systemically investigated. Based on the opposite temperature dependence, the maximum absolute and relative sensitivities reach as high as 1.10% K−1 and 0.87% K−1, respectively. The excellent temperature sensing performance indicates SrLu2O4:Bi3+,10% Eu3+ is a promising candidate in the fields of optical temperature sensor.Conflicts of interest
The authors declare that there is no conflict of interests regarding the publication of this article.Acknowledgements
This work was supported by the National Natural Science Foundation of China 11374269 and 11465010.Notes and references
- Y. Gao, F. Huang, H. Lin, J. Zhou, J. Xu and Y. Wang, Adv. Funct. Mater., 2016, 26, 3139–3145 CrossRef CAS
.
- X. Chai, J. Li, X. Wang, Y. Li and X. Yao, Opt. Express, 2016, 24, 22438–22447 CrossRef CAS PubMed
.
- J. Cao, X. Li, Z. Wang, Y. Wei, L. Chen and H. Guo, Sens. Actuators, B, 2016, 224, 507–513 CrossRef CAS
.
- M. Ding, M. Xu and D. Chen, J. Alloys Compd., 2017, 713, 236–247 CrossRef CAS
.
- F. Huang and D. Chen, J. Mater. Chem. C, 2017, 5, 5176–5182 RSC
.
- H. Lu, H. Hao, H. Zhu, G. Shi, Q. Fan, Y. Song, Y. Wang and X. Zhang, J. Alloys Compd., 2017, 728, 971–975 CrossRef CAS
.
- W. Chen, J. Cao, F. Hu, R. Wei, L. Chen and H. Guo, J. Alloys Compd., 2018, 735, 2544–2550 CrossRef CAS
.
- S. Zhou, C. Duan and S. Han, Dalton Trans., 2018, 47, 1599–1603 RSC
.
- Y. Cui, R. Song, J. Yu, M. Liu, Z. Wang, C. Wu, Y. Yang, Z. Wang, B. Chen and G. Qian, Adv. Mater., 2015, 27, 1420–1425 CrossRef CAS PubMed
.
- J. S. Zhong, D. Q. Chen, Y. Z. Peng, Y. D. Lu, X. Chen, X. Y. Li and Z. G. Ji, J. Alloys Compd., 2018, 763, 34–48 CrossRef CAS
.
- J. Cao, F. Hu, L. Chen, H. Guo, C. Duan and M. Yin, J. Am. Ceram. Soc., 2017, 100, 2108–2115 CrossRef CAS
.
- S. Zhou, X. Wei, X. Li, Y. Chen, C. Duan and M. Yin, Sens. Actuators, B, 2017, 246, 352–357 CrossRef CAS
.
- W. J. Hu, F. F. Hu, X. Y. Li, H. W. Fang, L. Zhao, Y. H. Chen, C. K. Duan and M. Yin, RSC Adv., 2016, 6, 84610–84615 RSC
.
- D. Q. Chen, M. Xu, S. Liu and X. Y. Li, Sens. Actuators, B, 2017, 246, 756–760 CrossRef CAS
.
- A. M. Kaczmarek, Y. Y. Liu, C. H. Wang, B. Laforce, L. Vincze, P. Van Der Voort and R. Van Deun, Dalton Trans., 2017, 46, 12717–12723 RSC
.
- K. Lenczewska, Y. Gerasymchuk, N. Vu, N. Q. Liem, G. Boulon and D. Hreniak, J. Mater. Chem. C, 2017, 5, 3014–3023 RSC
.
- R. Cao, T. Fu, D. Peng, C. Cao, W. Ruan and X. Yu, Spectrochim. Acta, Part A, 2016, 169, 192–196 CrossRef CAS PubMed
.
- A. Escudero, C. Carrillo-Carrion, M. V. Zyuzin, S. Ashraf, R. Hartmann, N. O. Nunez, M. Ocana and W. J. Parak, Nanoscale, 2016, 8, 12221–12236 RSC
.
- X. Y. Liu, H. Guo, S. X. Dai, M. Y. Peng and Q. Y. Zhang, Opt. Mater. Express, 2016, 6, 3574–3585 CrossRef CAS
.
- Y. C. Wang, J. Y. Ding, Y. Y. Li, L. F. Yang, X. Ding and Y. H. Wang, RSC Adv., 2016, 6, 42618–42626 RSC
.
- P. P. Dang, S. S. Liang, G. G. Li, Y. Wei, Z. Y. Cheng, H. Z. Lian, M. M. Shang, S. J. Ho and J. Lin, J. Mater. Chem. C, 2018, 6, 6449–6459 RSC
.
- S. K. Hussain, L. K. Bharat, D. H. Kim and J. S. Yu, J. Alloys Compd., 2017, 703, 361–369 CrossRef CAS
.
- L. Zhou, J. Shi and M. Gong, Mater. Res. Bull., 2005, 40, 1832–1838 CrossRef CAS
.
- J. Singh and J. Manam, J. Mater. Sci., 2016, 51, 2886–2901 CrossRef CAS
.
- K. Li, H. Lian, M. Shang and J. Lin, Dalton Trans., 2015, 44, 20542–20550 RSC
.
- D. Q. Chen, Z. Y. Wan, Y. Zhou, W. D. Xiang, J. S. Zhong, M. Y. Ding, H. Yua and Z. G. Ji, J. Mater. Chem. C, 2015, 3, 3141–3149 RSC
.
- X. Y. Li, X. Chen, S. Yuan, S. Liu, C. Wang and D. Q. Chen, J. Mater. Chem. C, 2017, 5, 10201–10210 RSC
.
- J. C. Zhang, X. G. Zhang, J. L. Zhang, W. T. Ma, X. Y. Ji, S. Z. Liao, Z. X. Qiu, W. L. Zhou, L. P. Yu and S. X. Lian, J. Mater. Chem. C, 2017, 5, 12069–12076 RSC
.
- D. Xu, R. Wei, J. Cao and H. Guo, Opt. Mater. Express, 2017, 7, 2899–2904 CrossRef CAS
.
- H. Y. Lu, R. Meng, H. Y. Hao, Y. F. Bai, Y. C. Gao, Y. L. Song, Y. X. Wang and X. R. Zhang, RSC Adv., 2016, 6, S7667–S7671 Search PubMed
.
- P. Du, L. H. Luo and J. S. Yu, CURR. APPL. PHYS., 2015, 15, 1576–1579 CrossRef
.
- X. Wang, X. P. Li, L. H. Cheng, S. Xu, J. S. Sun, J. S. Zhang, X. Z. Zhang, X. T. Yang and B. J. Chen, RSC Adv., 2017, 7, 23751–23758 RSC
.
- B. N. Tian, B. J. Chen, J. S. Sun, X. P. Li, J. S. Zhang and R. N. Hua, Mater. Res. Express, 2016, 3, 5 CrossRef
.
- S. K. Ranjan, A. K. Soni and V. K. Rai, Methods Appl. Fluoresc., 2017, 5, 9 CrossRef PubMed
.
- J. S. Liao, Q. Wang, L. Y. Kong, Z. Q. Ming, Y. L. Wang, Y. Q. Li and L. X. Che, Opt. Mater., 2018, 75, 841–849 CrossRef CAS
.
- A. K. Soni, Mater. Res. Express, 2018, 5, 6 Search PubMed
.
- D. K. Singh and J. Manam, Ceram. Int., 2018, 44, 10912–10920 CrossRef CAS
.
| This journal is © The Royal Society of Chemistry 2018 |

