 Open Access Article
Significantly improved piezoelectric performance of PZT-PMnN ceramics prepared by spark plasma sintering
Li-Qian Cheng *a,
Ze Xu
 a,
Chunlin Zhaob,
Hao-Cheng Thongb,
Zhen-Yong Cen
 b,
Wei Lu*c,
Yu Lanc and
Ke Wang
 b
b
aDepartment of Materials Science and Engineering, China University of Mining & Technology (Beijing), Beijing 100083, China. E-mail: chenglq@cumtb.edu.cn
bState Key Laboratory of New Ceramics and Fine Processing, School of Materials Science and Engineering, Tsinghua University, Beijing 100084, China
cAcoustic Science and Technology Laboratory, Harbin Engineering University, Harbin 150001, China. E-mail: luwei@hrbeu.edu.cn
First published on 17th October 2018
Abstract
A high-performance piezoelectric material, 0.95Pb(Zr0.52Ti0.48)O3-0.05Pb(Mn1/3Nb2/3)O3 (PZT-PMnN) ceramic, was prepared by using a spark plasma sintering (SPS) method. By systematically comparing the electrical properties, the spark-plasma-sintered sample was demonstrated to be superior to a conventionally sintered sample. With respect to conventionally sintered ceramic, the d33 of spark-plasma-sintered ceramic increases from 323 pC/N to 412 pC/N, and the  increases from 318 pm V−1 to 553 pm V−1. More importantly, the mechanical quality factor (Qm) reaches 583, which is three times higher than the conventionally sintered sample (Qm ∼ 182). Furthermore, the SPS method was found to be capable of promoting other electrical properties simultaneously. Therefore, the SPS method is proposed to be an effective processing method to fabricate PZT-PMnN ceramics of higher performance.
1. Introduction
Piezoelectric ceramic is a kind of functional material which can convert mechanical energy into electrical energy and vice versa. It is widely used in microelectronics, such as in camera focusing systems, fuel injectors, and medical ultrasound.1–4 Inside these devices, the piezoelectric actuator is the most important element, and it can provide a very precise and accurate movement under an applied electric field. Therefore, it gains a lot of interest from industry.5 As a powerful and cost-effective piezoelectric material, Pb(Zr, Ti)O3 (PZT) and its family have dominated the market of piezoelectric ceramics for a long period.It is mostly accepted that the criteria for practical applications include an excellent piezoelectric coefficient, good temperature stability, low dielectric loss, and high mechanical quality factor.6–8 However, some of these properties are not necessarily required to be outstanding under certain circumstances, e.g. a high mechanical quality factor is more important than a high piezoelectric coefficient in the application of high-frequency ultrasonic transducers. In 1954, Jaffe discovered the PbZrO3-PbTiO3 system, possessing high piezoelectricity.9,10 Different elements, acting as a soft or hard doping, when they were doped in PZT ceramics, can improve the ferroelectric properties of ceramics.11 On the other hand, Priya et al. analyzed and proved that Pb(Zr, Ti)O3-Pb(Mn1/3Nb2/3)O3 is suitable for applications, on the basis of the dielectric and piezoelectric magnitudes.12
However, PZT ceramics still face many problems, such as the volatilization of lead at the high sintering temperature.13–16 Spark plasma sintering (SPS) could be favorable in suppressing the lead loss because of the rapid heating rate, lower sintering temperature and shorter sintering time.17 It is well known that SPS is an effective tool to achieve dense and fine-grained ceramics at a relatively low temperature.18 For example, Han et al. demonstrated that SPS can reduce the sintering temperature of Pb(Zr0.52Ti0.42Sn0.02Nb0.04)O3 ceramic by about 200–300 °C while maintaining a high relative density (>99%).19 Besides, the SPS method is capable of promoting the performance of piezoceramics. For example, Shen et al. improved the electrical and mechanical properties of (Na0.535K0.485)1−xLix(Nb0.8Ta0.2)O3 (x = 0.02–0.07) ceramic using SPS method.20 This provides a promising alternative to fabricate lead-based ceramics with high mechanical strength and homogeneous fine-grain sizes.21 However, there is barely a few papers which systematically investigate and compare the comprehensive electrical properties of spark-plasma-sintered (SPSed) and conventionally sintered (CSed) ceramics.
In this work, Mn and Nb co-doped PZT ceramics with the composition 0.95Pb(Zr0.52Ti0.48)O3-0.05Pb(Mn1/3Nb2/3)O3 (PZT-PMnN) were prepared by the SPS method at 900–1000 °C. For comparison, the similar composition was prepared by using the conventional sintering (CS) method at 1250 °C. Both ceramic samples were systematically studied. A dense microstructure and high piezoelectric performance are obtained in the SPSed ceramic. This work herein suggests that SPS is an effective method for fabricating high-performance piezoceramics at a low sintering temperature, which is believed to be beneficial for further development of the piezoceramics.
2. Experimental
PZT-PMnN piezoceramics were prepared by the SPS and CS method. Pb3O4 (99%), BaCO3 (99%), TiO2 (98%), ZrO2 (99%), Nb2O5 (99.99%) and MnO2 (97.5%) were weighed according to the stoichiometric formula and mixed together by ball milling in ethanol for 10 hours. The mixture was dried for 2 hours and then calcined for 2 hours at 850 °C. Later, the calcined powder was subjected to the second ball milling process before sintering. The conventional solid-state sintering of PZT-PMnN was performed at 1250 °C for two hours. For spark plasma sintering, the sintering temperature is generally about 200–300 °C lower than the conventional solid-state method. Hence, the temperature range of 900–1000 °C was used in the SPS process.19 Approximately 3.5 g of calcined powder was compacted into a graphite mold with an inner diameter of 10 mm. After the SPS chamber was evacuated (4–6 Pa), the compacted powder was heated to 900–1000 °C at a rate of 100 °C min−1 and held for 5 min. A constant pressure of 50 MPa was applied on the compacted powder inside the graphite die along the Z-axis until the sintering process finished. The graphite die was cooled down naturally to room temperature, after which the sintered samples were taken out and cut into disks with a thickness of 1 mm. Post-annealing was then carried out in two steps. First, the SPS samples were annealed in air at 700 °C for 4 h, followed by another annealing in air at 1000 °C for 6 h to eliminate oxygen vacancies formed during the SPS process. Finally, the sintered disks were coated with silver paste on the upper and bottom surfaces and then baked at 600 °C for 10 min to form electrodes for electrical measurements.The density of the samples was determined by the Archimedes method. A high-resolution X-ray diffractometer (Rigaku, D/Max2500, Tokyo, Japan) is implemented to examine the crystal structure. Microstructures of sintered disks were examined by using a scanning electron microscopy (SEM, JSM-6460LV, JEOL, Tokyo, Japan). The quasi-static piezoelectric coefficient d33 of the poled samples was measured using a quasi-static d33 meter (ZJ-3A, Institute of Acoustics, Beijing, China). Field-dependent parameters were measured by a ferroelectric tester (aixACCT TF Analyzer 1000, Germany), bipolar/unipolar strain curves (S–E) and ferroelectric hysteresis (P–E) loops were included. The dielectric properties were measured at a frequency of 1 kHz using an impedance analyzer (TH2827, Changzhou Tonghui Electronic Co, China). Resistance |Z| and phase angle θ were measured at room temperature, using an Agilent 4294A precision impedance analyzer.
3. Results and discussions
3.1 Microstructure analysis
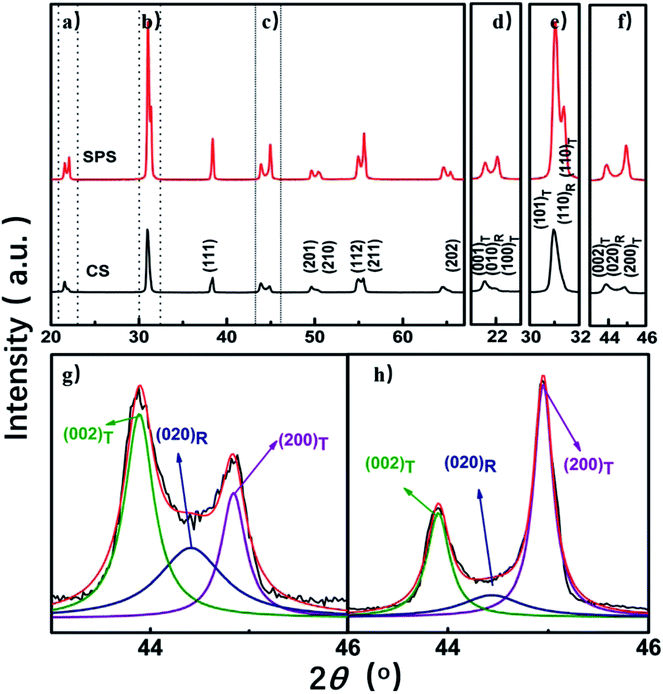
Fig. 1 shows the X-ray diffraction patterns of PZT-PMnN ceramics prepared by using CS and SPS methods. It can be found that both ceramics present typical and pure perovskite structures, indicating that Mn and Nb are completely doped into the PZT, forming a good solid solution. T and R represent the rhombohedral and tetragonal phases, respectively. There is one peak (200) between 44° and 46° in the diffraction pattern of R phase and two peaks (002) and (200) between 44° and 46° in the diffraction pattern of T phase.19 The split peaks shown in Fig. 1(d)–(f) confirm the presence of coexistence of R–T phase,22,23 which is consistent with the reported R–T morphotropic phase boundary in PZT-PMnN ceramics.24,25 The coexistence of R–T phases provides more polarization directions and flexible domain rotation to the ceramic, which makes it easier to be polarized under an external electric field.26,27 Comparing the XRD results of CSed and SPSed samples, it can be found that the sample prepared by SPS contains higher content of T phase, due to the value of I(002)/I(200) of the T phase between 44° and 46° is 1![[thin space (1/6-em)]](https://www.rsc.org/images/entities/char_2009.gif) :
:![[thin space (1/6-em)]](https://www.rsc.org/images/entities/char_2009.gif) 2, and the peak of the SPSed samples is closer to 1
2, and the peak of the SPSed samples is closer to 1![[thin space (1/6-em)]](https://www.rsc.org/images/entities/char_2009.gif) :
:![[thin space (1/6-em)]](https://www.rsc.org/images/entities/char_2009.gif) 2 here.28–30 In addition, as shown in Fig. 1(g) and (h), the R-phase characteristic peak of CSed ceramic more higher than that of SPSed ceramic, indicating the more R phase shows in CSed ceramic.
2 here.28–30 In addition, as shown in Fig. 1(g) and (h), the R-phase characteristic peak of CSed ceramic more higher than that of SPSed ceramic, indicating the more R phase shows in CSed ceramic.
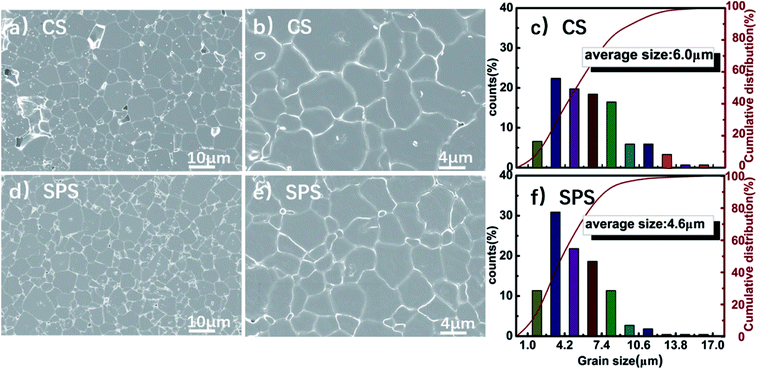
It can be seen from the SEM images (Fig. 2) that the SPSed ceramic possesses a denser microstructure than CSed ceramic. A lot of pores can be found in the CSed ceramic, as shown in Fig. 2(a), while there is no visible pore in SPSed ceramic, as shown in Fig. 2(d). Hence, the density of SPS-prepared ceramic is obviously larger than the CS-prepared ceramic (see Table 1).27 In addition, SPS-prepared ceramic has a suitable grain size distribution [see Fig. 2(f)], so that the grains can distribute more densely. The average grain size of the CSed ceramic is about 6.0 μm, while the average grain size of SPSed ceramic is about 4.6 μm. This is in agreement with the previous reports because the relatively short holding time during SPS will limit the grain growth.19 It is proposed that electrical properties depend on the grain size.31 At an appropriate grain size, the electrical properties can be highly enhanced. As shown in Table 1, it can improve piezoelectric coefficient and strain of ceramics with decreased grain size and porosity.17 The piezoelectric effect of the piezoelectric ceramics is affected by the 90° domain wall movement.32 It is because that domain wall area will change as a function of grain size. A smaller domain can react strongly to the applied electric field as it can rotate more easily.31 The piezoelectric coefficients d33 of CSed and SPSed samples were measured by using a quasi-static d33 meter, as shown in Table 1. SPSed sample was found to possess an unexceptionally high d33 when compared to the CSed sample. Therefore, it is conjectured that the smaller grain size achieved by using SPS method helps reduce the domain size, which potentially plays a significant role on the enhancement of piezoelectric performance.
3.2 Measurement of electrical properties
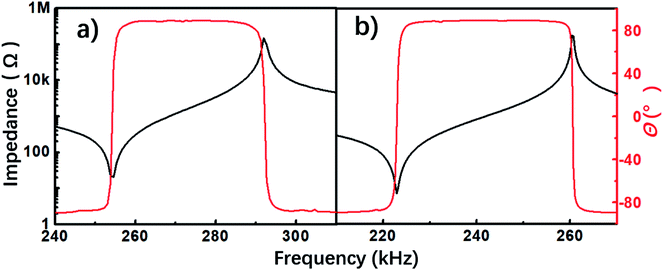
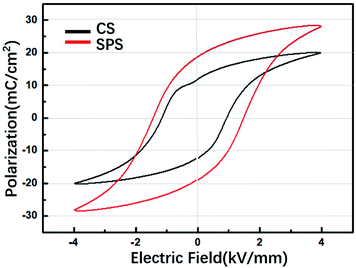
The impedance spectra and phase angle θ measured at 20 °C are presented in Fig. 3 From the figure, the mechanical quality factor (Qm) and the planar mode electromechanical coupling factor (kp) can be evaluated, as shown in Table 1. It can be seen that the Qm of the SPSed ceramic (583) is three times higher than that of the CSed ceramic (182). Also, SPS method has also improved the kp from 0.553 to 0.585. This is related to the more T phase content in the phase structure of the ceramic and smaller grain size and porosity.17,28 This is consistent with the previous phase structure analysis (see Fig. 1 and phase structure analysis) and microstructure analysis (see Fig. 2 and microstructure analysis).Fig. 4 shows P–E hysteresis loops of PZT-PMnN prepared by different sintering methods. Typical ferroelectric loops were observed for both ceramics. Maximum polarization (Pmax), residual polarization (Pr) and coercive field (EC) were summarized in Table 1. It can be seen that the SPSed ceramic possesses a better ferroelectric performance (Pmax = 28.2 μC cm−2 and Pr = 18.8 μC cm−2) than the CSed ceramic (Pmax = 20.1 μC cm−2 and Pr = 11.9 μC cm−2). In addition, the coercive field of SPSed ceramic is also higher than that of CSed ceramic. It is generally believed that the coercive field is related to the flexibility of domain and domain walls, and the coercive field of T-phase is generally larger than that of R-phase.29 SPS ceramic shows higher EC (1.49 kV mm−1) than CS ceramic (0.92 kV mm−1). This phenomenon is consistent with their XRD conclusions, and the XRD of SPS shows more obvious T-phase. It can be found that the content of the T phase in the coexisting phase affects the piezoelectric properties of the ceramic.
Fig. 5 shows temperature-dependent dielectric constant and loss of both SPSed and CSed PZT-PMnN ceramics. It can be seen from Fig. 5(a) that the Curie temperatures of the ceramics are quite similar. The Curie temperature of the SPSed ceramic is only 5 °C lower than that of the CSed ceramic. On the other hand, SPS can significantly increase the peak dielectric constant and the dielectric constant at room temperature. The dielectric constant at Curie temperature was increased from 21![[thin space (1/6-em)]](https://www.rsc.org/images/entities/char_2009.gif) 000 to 37
000 to 37![[thin space (1/6-em)]](https://www.rsc.org/images/entities/char_2009.gif) 000 and it was increased from 472 to 824 at room temperature. Besides, in Fig. 5(b), it can be seen that the SPS can largely reduce the dielectric loss of ceramic in various temperature ranges, and the loss was reduced from 0.0045 to 0.0018 at room temperature.
000 and it was increased from 472 to 824 at room temperature. Besides, in Fig. 5(b), it can be seen that the SPS can largely reduce the dielectric loss of ceramic in various temperature ranges, and the loss was reduced from 0.0045 to 0.0018 at room temperature.
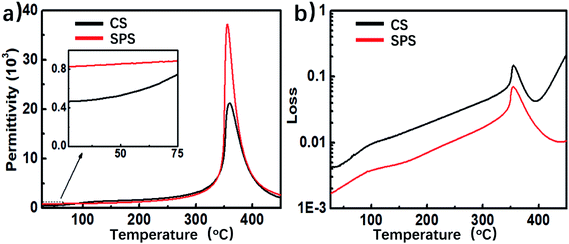 | ||
| Fig. 5 Dielectric constants and losses of PZT-PMnN ceramics prepared by different sintering methods. | ||
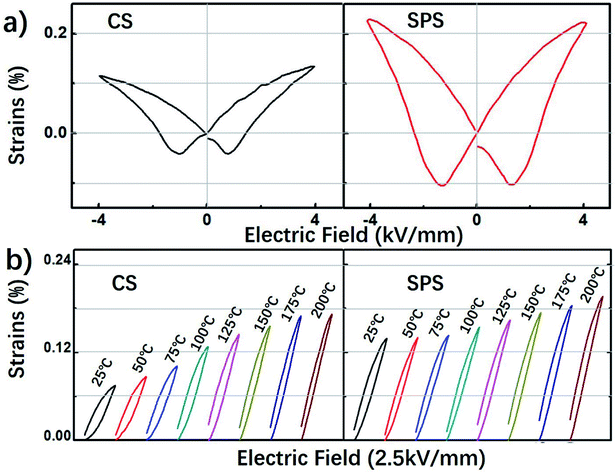
Fig. 6(a) shows bipolar strain curves of PZT-PMnN ceramics. It can be observed that the strain value of SPSed ceramic at room temperature is almost twice that of the CSed ceramic. In order to verify the thermal stability of the strain performance, the unipolar strain was measured at various temperatures, ranging from 25 °C to 200 °C. The unipolar strain can be normalized as  , which is also known as the converse piezoelectric coefficient. Similar to bipolar strain performance, a higher
  (553 pm V−1) is observed in SPSed ceramic at room temperature, when compared to the CSed ceramic (318 pm V−1). As shown in Fig. 6(b), when the temperature rises from 25 °C, the unipolar strain of CSed ceramic greatly increases from 0.08% to 0.17% (variation of 112.5%) while the SPSed ceramic only changes from 0.13% to 0.17% (variation of 33%). The result suggests that SPSed ceramic possesses a thermally stable strain performance.
According to the above comparison, it is easy to find that the performance of PZT-PMnN ceramics can be optimized via SPS method. And SPSed ceramic has the higher strain, d33, εr, Pr, EC, compactness, and lowest loss. The R–T phase structure with more T phase and denser and finer grain distribution are the main reasons for improving the ferroelectric properties of SPS ceramics. Hence, SPS not only reduced the sintering temperature by 300 °C, but also greatly improved the ceramic performance. This work provides a powerful reference for future researchers, how to improve the d33 and Qm while the performance requirements getting bigger in practical applications. SPS may be a reliable means.
4. Conclusions
A high-performance PZT-PMnN ceramic was prepared by SPS at 900–950 °C. The SPS method can effectively reduce the sintering temperature and time, compared to the CS method. SPS was found to be able to enhance the density of the sintered ceramic, and meanwhile, decrease its average grain size. Besides, a remarked enhancement is observed in piezoelectric performances, including the piezoelectric coefficient and the converse piezoelectric coefficient. Furthermore, SPS also help improve the other properties, e.g. kp, Qm, and εr. The unstable strain performance of CSed PZT-PMnN ceramics against rising temperature has been greatly mitigated in the SPSed ceramic as well. All of these improvements demonstrate that SPS is an exceptionally good processing method for PZT-PMnN system, which can provide upgraded materials for future applications.Conflicts of interest
There are no conflicts to declare.Acknowledgements
The authors acknowledge the financial supports from the National Natural Science Foundation of China (Grant No. 51602345), the State Key Laboratory of New Ceramics and Fine Processing, Tsinghua University (Grant No. KF201512), Fundamental Research Funds for the Central Universities (Grant No. 2016QJ01) and the Opening Fund of Acoustics Science and Technology Laboratory (Grant No. SSKF2016003).References
- X. Gao, X. Xin, J. Wu, Z. Chu and S. Dong, Appl. Phys. Lett., 2018, 112, 152902 CrossRef.
- B. Narayan, J. S. Malhotra, R. Pandey, K. Yaddanapudi, P. Nukala, B. Dkhil, A. Senyshyn and R. Ranjan, Nat. Mater., 2018, 17, 427–431 CrossRef CAS PubMed.
- F. Li, S. Zhang, Z. Xu and L.-Q. Chen, Adv. Funct. Mater., 2017, 27, 1700310 CrossRef.
- J. Li, F. Li, Z. Xu and S. Zhang, Adv. Mater., 2018, 1802155 CrossRef PubMed.
- W. Jo, R. Dittmer, M. Acosta, J. Zang, C. Groh, E. Sapper, K. Wang and J. Rödel, J. Electroceram., 2012, 29, 71–93 CrossRef CAS.
- K. Song, Z. Li, H. Guo, Z. Xu and S. Fan, J. Appl. Phys., 2018, 123, 154107 CrossRef.
- A. K. Yadav, A. Verma, S. Kumar, V. Srihari, A. K. Sinha, V. R. Reddy, S. W. Liu, S. Biring and S. Sen, J. Appl. Phys., 2018, 123, 124102 CrossRef.
- F. Li, S. Zhang, T. Yang, Z. Xu, N. Zhang, G. Liu, J. Wang, J. Wang, Z. Cheng, Z.-G. Ye, J. Luo, T.-R. Shrout and L.-Q. Chen, Nat. Commun., 2016, 13807 CrossRef CAS PubMed.
- B. Jaffe, R. S. Roth and S. Marzullo, J. Appl. Phys., 1954, 25, 809–810 CrossRef CAS.
- B. Jaffe, R. S. Roth and S. Marzullo, J. Res. Natl. Bur. Stand., 1955, 55, 239–254 CrossRef CAS.
- M. Hammer, C. Monty, A. Endriss and M. J. Hoffmann, J. Am. Ceram. Soc., 1998, 81, 721–724 CrossRef CAS.
- S. Priya, H.-W. Kim and K. Uchino, J. Am. Ceram. Soc., 2004, 87, 1907–1911 CrossRef CAS.
- K. Wang, J.-F. Li and J.-J. Zhou, Appl. Phys. Express, 2011, 4, 061501 CrossRef.
- M.-H. Zhang, K. Wang, Y.-J. Du, G. Dai, W. Sun, G. Li, D. Hu, H. C. Thong, C. Zhao, X.-Q. Xi, Z.-X. Yue and J.-F. Li, J. Am. Chem. Soc., 2017, 139, 3889–3895 CrossRef CAS PubMed.
- H. C. Thong, Q. Li, M.-H. Zhang, C. Zhao, K. X. Huang, J.-F. Li and K. Wang, J. Am. Ceram. Soc., 2018, 15488 Search PubMed.
- L.-Q. Cheng, K. Wang, Q. Yu and J.-F. Li, J. Mater. Chem. C, 2014, 2, 1519–1524 RSC.
- C. Chen, R. Liang, Z. Zhou, W. Zhang and X. Dong, Ceram. Int., 2018, 44, 3563–3570 CrossRef CAS.
- T. Hungría, J. Galy and A. Castro, Adv. Eng. Mater., 2009, 11, 615–631 CrossRef.
- B. Han, C. Zhao, Z. X. Zhu, X. Chen, Y. Han, D. Hu, M.-H. Zhang, H. C. Thong and K. Wang, ACS Appl. Mater. Interfaces, 2017, 9, 34078–34084 CrossRef CAS PubMed.
- Z.-Y. Shen, J.-F. Li, K. Wang, S. Xu, W. Jiang and Q. Deng, J. Am. Ceram. Soc., 2010, 93, 1378–1383 CAS.
- K. Wang, J.-F. Li and N. Liu, Appl. Phys. Lett., 2008, 93, 092904 CrossRef.
- T. Wu, Q. Sun, W. Ma and Z. Liu, J. Electroceram., 2013, 31, 28–34 CrossRef CAS.
- S. Shen, J. Chen, J. Jian, F. Luo, J. Mei and J. Cheng, J. Am. Ceram. Soc., 2018, 15804 Search PubMed.
- Y. Zhou, Q. Li, C. Xu, F. Zhuo, Q. Yan, Y. Zhang and X. Chu, J. Am. Ceram. Soc., 2018, 101, 3054–3064 CrossRef CAS.
- S. M. Gupta and D. Viehland, J. Appl. Phys., 1998, 83, 407–414 CrossRef CAS.
- B. Hanrahan, Y. Espinal, C. Neville, R. Rudy, M. Rivas, A. Smith, M.-T. Kesim and S.-P. Alpay, J. Appl. Phys., 2018, 123, 124104 CrossRef.
- F. Bian, S. Yan, C. Xu, Z. Liu, X. Chen, C. Mao, F. Cao, J. Bian, G. Wang and X. Dong, J. Eur. Ceram. Soc., 2018, 38, 3170–3176 CrossRef CAS.
- Z. Wu and R. E. Cohen, Phys. Rev. Lett., 2005, 95, 037601 CrossRef PubMed.
- Z. Tan, J. Tian, Z. Fan, Z. Lu, D. Zheng, Y. Wang, D. Chen, M. Qin, M. Zeng, X. Lu, X. Gao and J.-M. Liu, Appl. Phys. Lett., 2018, 112, 152905 CrossRef.
- A. Prasatkhetragarn and R. Yimnirun, Ceram. Int., 2013, 39, S91–S95 CrossRef CAS.
- N. Ma, B.-P. Zhang, W.-G. Yang and D. Guo, J. Eur. Ceram. Soc., 2012, 32, 1059–1066 CrossRef CAS.
- D. Damjanovic and M. Demartin, J. Phys. D: Appl. Phys., 1996, 29, 2057 CrossRef CAS.
| This journal is © The Royal Society of Chemistry 2018 |

