 Open Access Article
Adsorption and reduction of hexavalent chromium on magnetic greigite (Fe3S4)-CTAB: leading role of Fe(II) and S(−II)†
Yanxia Zhoua,
Yiting Zhaoa,
Xiaoge Wua,
Weiqin Yina,
Jianhua Hou ab,
Shengsen Wangab,
Ke Fengab and
Xiaozhi Wang
 *abc
*abc
aCollege of Environmental Science and Engineering, Yangzhou University, Jiangsu 225127, China. E-mail: xzwang@yzu.edu.cn
bJiangsu Collaborative Innovation Center for Solid Organic Waste Resource Utilization, Nanjing 210095, China
cInstitutes of Agricultural Science and Technology Development, Yangzhou University, Yangzhou 225127, Jiangsu, China
First published on 10th September 2018
Abstract
In this study, a facile one-step route was used to synthesize a novel magnetic mesoporous greigite (Fe3S4)-CTAB composite, which was utilized to remove hexavalent chromium (Cr(VI)). The optimized Fe3S4-CTAB0.75 composite with a CTAB dosage of 0.75 g possessed the maximum specific surface, showing the highest Cr(VI) adsorption capacity of 330.03 mg g−1. The mechanism analysis revealed that Fe(II) and S(−II) were critical for the reduction of Cr(VI). CTAB can promote the removal of Cr(VI) by Fe3S4-CTAB composites, possibly due to increased S(−II) concentration, better dispersion of nanoparticles, and greater zeta potential. Besides, there is mild effect of Fe0 on Cr(VI) removal, which is confirmed by the disappearance of the Fe0 peak from the XPS analysis. The pseudo-second-order kinetic model could explain the Cr(VI) removal processes well. The adsorption of Cr(VI) at different initial concentrations was more consistent with a Langmuir isotherm. The existence of H+ was beneficial for Cr(VI) removal by Fe3S4-CTAB0.75. Our work confirmed that the obtained Fe3S4-CTAB0.75 composites exhibit considerable potential for Cr(VI) removal from aqueous solution.
1. Introduction
As a metal contaminant, chromium frequently occurs in wastewater. Since it could seriously harm human health, the U.S. Environmental Protection Agency (EPA) has listed hexavalent chromium as a group ‘A’ human carcinogen.1 Cr(III) and Cr(VI) are the most common and stable forms of chromium,2,3 and the poisonousness of the latter is 100 times larger than the former.4 It has been reported that long exposure to Cr(VI) could induce many diseases, for example liver failure, reproductive failure, chronic headaches, respiratory disease, nose bleeds and any type of cancer.5A lot of technologies have been utilized to remove Cr(VI) from the environment, such as photoreduction,6,7 electro-chemical precipitation,8 ion exchange,9 and adsorption.10 Combining with adsorption, chemical reduction from Cr(VI) to Cr(III) to reduce toxicity is one of the most simple and economical methods.11 The combined strategy includes many advantages, such as high efficiency, easy use, and low cost.12
Greigite (Fe3S4) is isostructural with Fe3O4.13–15 Due to its low cost and good chemical reduction ability, Fe3S4 has been applied on heavy metal removal.12 For example, Kong and his coworkers investigated lead (Pb2+) transformations on β-cyclodextrin stabilized magnetic Fe3S4 nanoparticles, and found that the surface adsorption and chemical precipitation (PbS) were the dominant mechanisms in the process of removing lead.16 Mahamudur Islam et al. utilized greigite-conducting polypyrrole nanocomposite to remove arsenate and arsenite from aqueous solution.17 However, the application of Fe3S4 in the adsorption and reduction of hexavalent chromium is rarely investigated. According to the previous reports,18 Fe3S4 can release Fe(II) and S(−II) in aqueous solution, which can promote Cr(VI) reduction effectively.
Various cationic surfactants have been applied to removal anionic metal.19 Appropriate surfactants or stabilizers such as β-CD, PEG, and CTAB, could affect the purity and stability of Fe3S4.20 Cetyltrimethylammonium bromide (CTAB) is one of the common cationic surfactants and it is known that the dissociated cetyltrimethylammonium (CTA+) maintains the properties of surfactant. CTAB could help to obtain high purity greigite microcrystals,21 improve the content of S(−II) in greigite, and CTA+ could combine with Cr(VI) anions and form ion-pairs.22 This is the first work about the application of Fe3S4-CTAB to removal Cr(VI).
The task of this study was to prepare greigite (Fe3S4) doped with CTAB for the removal of Cr(VI). The detailed works were listed as following: (1) synthesize and characterize greigite (Fe3S4) doped with CTAB, (2) determine the effects of solution pH, reaction time, CTAB doping amount, and initial concentrations of contaminant on the Cr(VI) removal effectiveness, (3) investigate the reductive and adsorptive capacity of Cr(VI). This work could provide evidence to explain Cr(VI) removal mechanisms by Fe3S4-CTAB.
2. Materials and methods
2.1 Chemical reagents
K2Cr2O7 was dissolved to prepare Cr(VI) stock solutions. Ferric chloride hexahydrate (FeCl3·6H2O), thiourea, ethylene glycol (EG), ethanol, potassium dichromate (K2Cr2O7), cetyltrimethylammonium bromide (CTAB) were purchased from Yangzhou Chemicals Corporation (Yangzhou, China). Solution pH was regulated by 1 M HCl and/or NaOH. Deionized water was used in the whole experiment. All reagents used were of analytical grade and had not been further purified before use.2.2 Synthesis of greigite and greigite-CTAB composite
Fe3S4 composite was synthesized by the modified hydrothermal method.18 Briefly, FeCl3·6H2O (3.0 mmol) and thiourea (6.0 mmol) were added to EG (60 mL) and stirred for 20 min to form a carmine solution. Typically, CTAB (0.75 g) was then added to the carmine solution, followed by 15 min magnetic stirring and 15 min sonication. After the mixing, the above solution was transferred into a autoclave (the capacity is 100 mL). After 12 h heating at 180 °C, a magnet was used to collect solid products. The collected samples were repeatedly washed with distilled water followed by ethanol. The obtained Fe0/FeS/Fe3S4-CTAB0.75 (referred to as Fe3S4-CTAB0.75 in the article) were dried in a vacuum oven at 60 °C for 12 h. Following the similar fabricated method, other Fe3S4-CTAB samples were prepared with varying amounts of CTAB and named as Fe3S4-CTAB0.25, Fe3S4-CTAB0.50, and Fe3S4-CTAB1.00.2.3 Batch experiments of Cr(VI) removal
In order to determine the best pH in the reaction process, the pH value of the Cr(VI) solutions was set to 2.0, 3.0, 4.0, 5.0 and 6.0, respectively, with 1 M HCl and 1 M NaOH. Typically, the obtained composite (15 mg) was mixed with Cr(VI) solution (50 mL of 100 mg L−1), and then continuously shaken for 1 h at room temperature. The experimental data of adsorption kinetic was obtained by sampling at certain time intervals, then the suspension was filtered through a 0.22 mm membrane to achieve clarified samples. Adsorption isotherms were performed by mixing the composite with Cr(VI) solution (initial concentration ranging from 100 to 300 mg L−1) and shaking for 5 h to obtain adsorptive equilibrium.2.4 Analysis
Total Cr(VI) in solution was confirmed through the 1,5-diphenylcarbazide colorimetric method (with potassium permanganate).23 Moreover, the 1,5-diphenylcarbazide colorimetric method was applied to measure the Cr(VI) concentrations at 540 nm through a UV/Vis spectrophotometer.24 The Cr(III) concentration corresponded to the difference between total Cr and Cr(VI). The Cr speciation of the reaction product was confirmed by XPS.2 The o-phenanthroline method was utilized to determine the concentration of ferrous ions at 510 nm. Through adding hydroxylamine hydrochloride to reduce Fe from Fe(III) to Fe(II), then the total dissolved iron was measured.242.5 Characterization
XRD analysis (D8 Advance Bruker AXS, Germany) was applied to determine the phase structure of the obtained composites. HRTEM was obtained using a Tecnai G2 F30 S-TWIN (FEI, USA) to ensure the crystal lattice of the reaction product. Scanning electron microscope (S-4800II, Japan) was used to observe the surface morphology of the obtained composite. Fourier transform infrared (FTIR) spectra were obtained by using a Thermo Nicolet iS5 spectrometer, using KBr as a reference. The magnetization of the obtained composites was obtained on a vibrating sample magnetometry (VSM-EV7, ADE). Micromeritics ASAP 2460 was applied to confirmed nitrogen adsorption–desorption isotherms and specific surface areas. The valence state of related elements of the adsorbent before and after reaction was identified by XPS (ESCALAB 250 Xi, USA). Zeta potentials of the obtained composites were measured through zeta potentiometer (DTS1060).3. Results and discussion
3.1 Characterization of greigite and greigite-CTAB composite
The crystal structure and phase purity of the obtained composites and Cr(VI)-treated Fe3S4-CTAB0.75 were determined by XRD pattern. From Fig. 1, FeS shows three 2θ peaks at 17.61°, 38.99° and 49.59°, which correspond to [001], [111] and [200] directions. The other diffraction peaks can correspond well to cubic Fe3S4 (JCPDS file no. 89-1998).17 No other impurity peaks were observed between bare Fe3S4 and CTAB modified Fe3S4 composite, indicating that the existence of CTAB did not change the structure of Fe3S4. Meanwhile, the product from the reaction of Fe3S4-CTAB0.75 with Cr(VI) was shown in Fig. 1. The XRD pattern showed that the diffraction peaks of FeS disappeared and a new diffraction peak attributed to Cr2O3 emerged. HRTEM (Fig. S1†) was applied to determine the composition of Cr(VI)-treated Fe3S4-CTAB0.75. The d-spacing in HRTEM was about 0.25 nm and 0.334 nm in accordance with the (110) faces of Cr2O3 and Cr(OH)3 respectively,25,26 which demonstrated the existence of Cr2O3 and Cr(OH)3.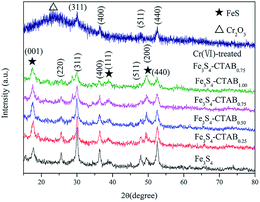 | ||
| Fig. 1 XRD patterns of Fe3S4, Fe3S4-CTAB0.25, Fe3S4-CTAB0.50, Fe3S4-CTAB0.75, Fe3S4-CTAB1.00 and Cr(VI)-treated Fe3S4-CTAB0.75. | ||
SEM images under high magnification (Fig. S2†) clearly displayed that a large amount of nanosheets formed 3D flower-shaped microspheres, which agreed with previous reports.18 The FTIR spectra of the obtained composites and pure CTAB were presented in Fig. S3.† Interestingly, the peaks at 2400 cm−1 and 2300 cm−1 became more obvious with the increase of CTAB doping amount. These coincided with the spectra of pure CTAB between 2400 cm−1 and 2300 cm−1 indicating Fe3S4 crystals doped with CTAB has been successfully fabricated.
The magnetization of obtained composites were gained under the condition of an applied magnetic field. The magnetic hysteresis loop of the obtained Fe3S4, Fe3S4-CTAB0.25, Fe3S4-CTAB0.50, Fe3S4-CTAB0.75 and Fe3S4-CTAB1.00 were shown in Fig. 2, which indicates that all the five composites exhibit ferromagnetic nature. The saturation magnetization of greigite-CTAB composite decreased gradually due to the attachment of nonmagnetic component.
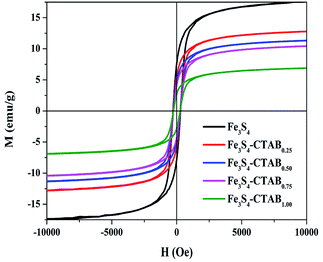 | ||
| Fig. 2 Hysteresis (M–H) analysis of Fe3S4, Fe3S4-CTAB0.25, Fe3S4-CTAB0.50, Fe3S4-CTAB0.75 and Fe3S4-CTAB1.00. | ||
The nitrogen adsorption–desorption method were applied to determine the specific surface area of the obtained composites. A type IV isotherm shown in Fig. S4† displayed the presence of mesopores structure. Table 1 summarizes the BET surface area of the obtained composites with varied doping amount of CTAB. Fe3S4 has a specific surface of 18.82 m2 g−1. With the increase of doping amount of CTAB, the surface area of the obtained composites decreases first and then increases. When CTAB doping increases to 0.75 g, the highest BET surface area is obtained. When the CTAB content is low, it will adsorb on the pore surfaces, leading to the reduction of the pore size and specific surface areas.27 But when we increase CTAB dosage, it acts as a mesopore directing agent,28 which will enter into the material structure, thus increasing the specific surface area of the material.29
| Sample | SBET (m2 g−1) | Average pore size (nm) | Pore volume (cm3 g−1) |
|---|---|---|---|
| Fe3S4 | 18.82 | 15.035 | 0.071 |
| Fe3S4-CTAB0.25 | 15.13 | 6.934 | 0.026 |
| Fe3S4-CTAB0.50 | 16.69 | 15.799 | 0.066 |
| Fe3S4-CTAB0.75 | 21.27 | 14.895 | 0.079 |
| Fe3S4-CTAB1.00 | 20.95 | 6.116 | 0.032 |
XPS spectroscopy was used to examine the valence change of related elements before and after treatment of Cr(VI) (Fig. 3). For Fe3S4-CTAB0.75, the Fe 2p spectra in Fig. 3(a) was decomposed to five peaks. The binding energies of Fe(II) were at 707.6 (ref. 30) and 710.3 eV.24,31 The Fe peak at 2p3/2 = 720.2 eV which can be assigned to Fe0.32,33 The binding energies of Fe 2p3/2 and Fe 2p1/2 are at 713.3 eV and 724.4 eV, respectively, proving of the existence of Fe(III).32,34 The S 2p spectra in Fig. 3(b) exhibited five peaks, namely, FeS at about 161 (ref. 31) and 162 (ref. 24) eV, S(−I) at about 163 eV,35 S(VI) at about 168 eV.24,36 The O 1s was decomposed into different peaks at binding energies of 530 eV and 531 eV, consisting with O2− (ref. 30) and C–O,31 respectively. Furthermore, the proportion of the reduced sulfur in Fe3S4-CTAB0.75 was increased and the diffraction peak –OH was converted into C–O after CTAB doping (Fig. S5†). These changes further proved that CTAB had been successfully doped into greigite.
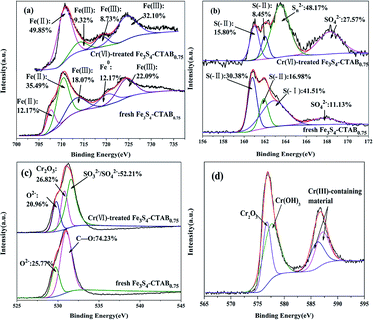 | ||
| Fig. 3 XPS spectra of (a) the Fe 2p region, (b) the S 2p region, (c) the O 1s region and (d) the Cr 2p region of the fresh and Cr-treated Fe3S4-CTAB0.75 sample. | ||
Upon Cr(VI) sorption, the reductive state of iron(Fe(II) and Fe0) decreased from 59.84% for Fe3S4-CTAB0.75 to 49.85% for Cr(VI)-spent Fe3S4-CTAB0.75, whereas Fe(III) increased from 40.16% to 50.15% (Table S1†). Furthermore, the peak assigned to Fe0 disappeared, while a new peak ascribed to Fe(III) appeared at 718.9 eV.37 It displays the oxidation of Fe(II) and Fe0 by Cr(VI) under the condition of experiment. The percentage of S(−II) decreased from 47.36% to 24.25%, and S(VI) increased from 11.13% to 27.57% after contacting with Cr(VI) (Table S1†), revealing the oxidization of S(−II) by Cr(VI). The peak assigned to S(−I) vanished, indicating it could react with Fe(III) to form Fe(II) and release H+ (FeS2 + 14Fe3+ + 8H2O → 15Fe2+ + 2SO42− + 16H+).38 Simultaneously, a new peak ascribed to Sn2− (n > 2) resulting from the oxidation of FeS and/or FeS2 (ref. 39) appeared at 163.5 eV.30,34 For O 1s, C–O disappeared, the binding energy at 531.6 eV suggests the existence of SO32−/SO42−,30 which is consistent with the increased proportion of S(VI). Additionally, a new peak assigned to Cr2O3 emerged at 530.8 eV (ref. 31) supported by the XRD of Cr(VI)-treated Fe3S4-CTAB0.75. Chromium species were determined via the high-resolution XPS Cr 2p spectrum (Fig. 3(d)). The Cr 2p3/2 signal of Cr(VI)-treated Fe3S4-CTAB0.75 was partitioned into two contributions: the binding energy at 576.7 eV and 577.5 eV are assigned to Cr2O3 (ref. 40) and Cr(OH)3,40,41 respectively. The results are consistent with the observation from HRTEM. The binding energies of Cr 2p1/2 (586.1 eV and 587.1 eV) were close to those of Cr(III)-containing material.42,43
3.2 Effect of pH on Cr(VI) removal
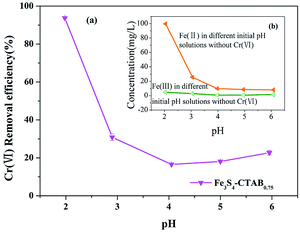
Solution pH is a critical parameter in the process of adsorption and reduction of Cr(VI).44 As shown in Fig. 4(a), the removal efficiency of Cr(VI) in the solution was 93.73% and 22.67%, respectively, corresponding to the pH value of 2.0 and 6.0. Under the pH range from 2.0 to 4.0, the removal efficiency of Cr(VI) showed a significant drop, which is consistent with previous experimental results.45 This trend coincided with the marked decrease of concentration of dissolved Fe(II) from Fe3S4-CTAB0.75 (Fig. 4(b)). The result may suggest facilitated dissolution of Fe2+ at lower pHs played important roles in Cr(VI) removal. Besides, the isoelectric point of the material is between pH 2.0 and 3.0,46 and thus material becomes positively charged and protonated at pH 2.0 which is favourable for electrostatic attraction between HCrO4−.47 This was also further confirmed with positive zeta potential at pH 2.0 (Fig. S6†). However, higher pH values will change the surface charge of the material, impairing the electrostatic attraction between the material and Cr(VI) anions. Furthermore hydroxyls from the higher pH value solution could compete the adsorption sites on Fe3S4-CTAB0.75 surface with Cr(VI) anions, leading to a reduction of the removal efficiency of Cr(VI).22 However, under the pH range from 4.0 to 6.0, the removal efficiency slightly increased, which may be due to the formation of a small amount of Cr(OH)3.48 In addition, coexistence of H+ at lower pH and reduced sulphur was able to reduce Cr(VI) to Cr(III) more easily.49 Based on the pH-dependent sorption of Fe3S4-CTAB, we choose the pH valve at 2.0 for further removal studies.3.3 Effects of CTAB dosage on Cr(VI) removal kinetics
Fig. 5(a) shows the adsorption data of Cr(VI) at different time intervals. The initial concentration of Cr(VI) was set to 100 mg L−1 and the amount of Fe3S4-CTABX (initial pH = 2.0) added was 0.3 g L−1. It can be seen that adsorption reached equilibrium after 30 min reaction. The removal effectiveness of Fe3S4-CTABX is affected by the amount of CTAB doping. Cr(VI) removal efficiency was about 70% and 94% for Fe3S4 and Fe3S4-CTAB0.75 after 60 min, respectively. The enhanced removal of Cr(VI) by CTAB composites might be attributed to several reasons. First, the higher reduced sulfur in the composites as revealed by the XPS analysis (Fig. S5(a)†) facilitated its reduction reaction with Cr(VI). This could be a very important mechanism associated with our composites. Second, the CTAB improved the dispersion and reduced the aggregation of Fe3S4 to Cr(VI) (Fig. S2(a) & (d)†). Third, the cationic surfactant CTAB could increase electrostatic attraction with negatively charged HCrO4− on one hand. On the other hand, CTAB could increase zeta potential of Fe3S4 compared to pristine Fe3S4 which provide more positive surface for attraction with HCrO4− at experimental pH (Fig. S6†). As shown in Table 2, the pseudo second-order adsorption model was more suitable than the pseudo first-order adsorption model to explain Cr(VI) removal from correlation coefficients. Thus, the difference in the removal rate by obtained composites is expressed by the pseudo first-order reaction model (Fig. 5(b)). The kinetic parameters calculated from the pseudo-first reaction model are listed in Table S2,† where reaction rate of Fe3S4-CTAB0.75 is 3–4 times greater than pristine Fe3S4.| Sample | Pseudo-first-order model | Pseudo-second-order model | ||||
|---|---|---|---|---|---|---|
| K1 (min−1) | Qe (mg g−1) | R2 | K2 × 10−4 (g (mg min)−1) | Qe (mg g−1) | R2 | |
| Fe3S4 | 0.117 | 204.925 | 0.883 | 7.023 | 235.849 | 0.998 |
| Fe3S4-CTAB0.25 | 0.092 | 253.764 | 0.941 | 5.302 | 281.690 | 0.999 |
| Fe3S4-CTAB0.50 | 0.105 | 280.186 | 0.908 | 4.659 | 319.489 | 0.998 |
| Fe3S4-CTAB0.75 | 0.094 | 304.922 | 0.977 | 3.881 | 346.021 | 0.999 |
| Fe3S4-CTAB1.00 | 0.113 | 232.121 | 0.924 | 4.491 | 280.899 | 0.997 |
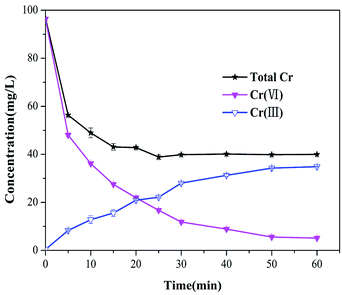
To gain a better explanation of transformation of chromium species, the total chromium concentrations were examined at different sampling time points (shown in Fig. 6). The total chromium concentration dropped sharply within 5 min, and then gradually reached equilibrium within 30 min. The residual total chromium concentration dropped to 40 mg L−1 at 60 min, about 85% of the chromium was Cr(III), which is less toxic than Cr(VI). Therefore, it is suggested that Cr(VI) could be reduced to Cr(III) effectively by Fe3S4-CTAB0.75.
3.4 Adsorption isotherm
The adsorption isotherm of Cr(VI) removal was discussed by changing the initial concentrations of contaminant, with the Fe3S4-CTAB0.75 dosage of 0.3 g L−1 (initial pH = 2.0). The related model parameters were shown in Table S1.† The adsorption capacity of Fe3S4-CTAB0.75 reached to 303.53 mg g−1 and 329.95 mg g−1 with initial Cr(VI) concentrations of 100 and 300 mg L−1, respectively. The Freundlich model could not fit the experimental data well (Fig. S7†), compared with the Langmuir model (R2 = 0.99) (Fig. 7).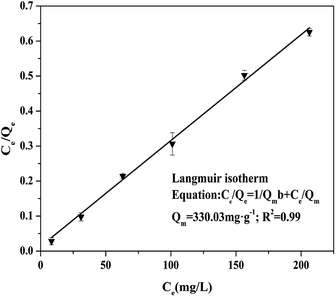 | ||
| Fig. 7 Langmuir isotherm of Cr(VI) adsorption. The reactions were developed at initial Cr(VI) concentrations of 100–300 mg L−1 with 0.3 g L−1 Fe3S4-CTAB0.75, with pH0 = 2.0. | ||
According to the fitting results, it could be speculated that the adsorption of Cr(VI) by Fe3S4-CTAB0.75 was mononuclear layer adsorption.24 The calculated Qmax value (the adsorption capacity) was 330.03 mg g−1. Fe3S4-CTAB0.75 exhibited a excellent removal good capacity for Cr(VI), compared with other Fe-based adsorbents (Table 3).
| Adsorbents | SBET (m2 g−1) | qm (mg g−1) | pH | Equilibrium time (h) | Ref. |
|---|---|---|---|---|---|
| FeS@Fe0 | 53.11 | 66.7 | 5.0 | 2 | 24 |
| FeS-coated iron (Fe/FeS) | 62.1 | 69.7 | 5.0 | 72 | 38 |
| CMC-FeS@biochar | 51.5 | 130.5 | 5.5 | 72 | 31 |
| FeS | — | 240 | 5 | 4.5 | 50 |
| MnFe2O4@SiO2-CTAB | 53.4 | 25.044 | 3.0 | 12 | 22 |
| Fe3O4 capped with CTAB | — | 10.05 | 4.0 | 12 | 19 |
| Fe3S4-CTAB0.75 | 21.273 | 330.03 | 2.0 | 1 | This study |
| 76.65 | 6.0 |
3.5 Proposed Cr(VI) removal mechanism
Based on the above discussion, a possible mechanism for Cr(VI) removal on Fe3S4-CTAB0.75 was preliminarily proposed as follows. The mesoporous Fe3S4-CTAB0.75 composite could adsorb Cr(VI) rapidly as CTA+ cations can combine the HCrO4− (main species of hexavalent chromium at pH 2.0 (ref. 41)) to form ion-pairs (eqn (1)).22 Moreover Fe0 could be easily oxidized by Cr(VI).32 The absorbed Cr(VI) is in situ reduced by Fe0 to generate Cr(III), accompanied by the oxidation of Fe0 to form Fe(II),51 which is consistent with the disappearance of Fe0 peak (Fig. 3(b)) (eqn (2)). Furthermore, dissolved FeS provides Fe(II) and S(−II) (eqn (3)) donating the electrons to Cr(VI),31,38 which was evidenced by the increase of SO42− content in Fig. 3(b) (eqn (4)). In addition, we measured the concentration of Fe(II) and Fe(III) in deionized water (pH = 2.0) and in the presence of Cr(VI) (pH = 2.0) at different time intervals, respectively. Without Cr(VI), dominant iron species in acidic solution (pH = 2.0) is in the Fe(II) state, while after 60 min reaction in the presence of Cr(VI), iron exists mainly in trivalent iron(Fig. S8†). Thus, it is suggested that Cr(VI) is reduced by ferrous ions dissolved from Fe3S4-CTAB0.75 (eqn (5)).2,52| C16H33(CH3)3N+ + HCrO4− → C16H33(CH3)3N+⋯HCrO4− | (1) |
| 3Fe0 + 2HCrO4− + 6H2O → 3Fe2+ + 3Cr(OH)3 +8OH− | (2) |
| FeS + H+ → Fe2+ + HS− | (3) |
| 8HS− + 3HCrO4− + 29H+ → 3SO42− + 8Cr3+ + 20H2O | (4) |
| 3Fe2+ + HCrO4− + 7H+ → 3Fe3+ + Cr3+ + 4H2O | (5) |
4. Conclusions
Novel greigite-CTAB composites applied to remove Cr(VI) from aqueous solutions were successfully synthesized by a simple one-step modification method. The effectiveness of greigite-CTAB composites varies with the doping content of CTAB. When the doping content of CTAB was 0.75 g, the highest Cr(VI) removal capacity was achieved. Langmuir isotherm model matches better than Freundlich isotherm model in fitting Cr(VI) adsorption datas. The predicted maximum Cr(VI) removal capacity is 330.03 mg g−1. The removal process is in accordance with pseudo-second-order kinetic model. Furthermore, low pH value of the system is crucial to the reduction of Cr(VI) to Cr(III). It could be inferred that the release of Fe(II) under acidic conditions is favorable. In the case of Fe3S4-CTAB0.75, Cr(VI) was adsorbed on the adsorbent surface through electrostatic attraction followed by reduced to less toxic Cr(III). Therefore, the novel greigite-CTAB composites have great potential for the efficient removal of Cr(VI) in wastewater.Conflicts of interest
There are no conflicts to declare.Acknowledgements
This work was financially supported by the Qing Lan Project, the National Science Foundation of China (31772394, 51602281), Social development project of Jiangsu Province (BE2015661), Six-talent peaks project in Jiangsu Province (2013-NY-017). We thank the Testing Center of Yangzhou University for the help in sample characterization.References
- B. Dhal, H. N. Thatoi, N. N. Das and B. D. Pandey, J. Hazard. Mater., 2013, 250–251, 272–291 CrossRef PubMed.
- T. Yang, L. Meng, S. Han, J. Hou, S. Wang and X. Wang, RSC Adv., 2017, 7, 34687–34693 RSC.
- L. Hua, Y. C. Chan, Y. P. Wu and B. Y. Wu, J. Hazard. Mater., 2009, 163, 1360–1368 CrossRef PubMed.
- C. Liu, N. Fiol, I. Villaescusa and J. Poch, Sci. Total Environ., 2016, 541, 101–108 CrossRef PubMed.
- G. R. Xu, J. N. Wang and C. J. Li, Chem. Eng. J., 2012, 198–199, 310–317 CrossRef.
- F. Xu, R. D. Webster, J. Chen, T. T. Y. Tan, H. L. Sit and W. Y. Teoh, Appl. Catal., B, 2017, 210, 444–453 CrossRef.
- Y. Zhang, M. Xu, H. Li, H. Ge and Z. Bian, Appl. Catal., B, 2017, 226, 213–219 CrossRef.
- C. Peng, H. Meng, S. Song, S. Lu and A. Lopez-Valdivieso, Sep. Sci. Technol., 2005, 39, 1501–1517 CrossRef.
- Y. Xing, A. Xueming Chen and D. Wang, Environ. Sci. Technol., 2007, 41, 1439–1443 CrossRef PubMed.
- K. Parida, K. G. Mishra and S. K. Dash, J. Hazard. Mater., 2012, 241–242, 395–403 CrossRef PubMed.
- H. Gu, S. Rapole, Y. Huang, D. Cao, Z. Luo, S. Wei and Z. Guo, J. Mater. Chem. A, 2013, 1, 2011–2021 RSC.
- L. Kong, Z. Li, X. Huang, S. Huang, H. Sun, M. Liu and L. Li, J. Mater. Chem. A, 2017, 5, 19333–19342 RSC.
- Y. S. Chang, S. Savitha, S. Sadhasivam, C. K. Hsu and F. H. Lin, J. Colloid Interface Sci., 2011, 363, 314–319 CrossRef PubMed.
- S. Huang, D. Kang, X. Wu, J. Niu and S. Qin, Sci. Rep., 2017, 7, 46334 CrossRef PubMed.
- Y. J. Choe, J. Y. Byun, S. H. Kim and J. Kim, Appl. Catal., B, 2018, 233, 272–280 CrossRef.
- L. Kong, L. Yan, Z. Qu, N. Yan and L. Li, J. Mater. Chem. A, 2015, 3, 15755–15763 RSC.
- M. Islam and R. Patel, Sep. Sci. Technol., 2017, 52, 2837–2854 CrossRef.
- W. Liu, Z. Ai, R. A. Dahlgren, L. Zhang and X. Wang, Chem. Eng. J., 2017, 330, 1232–1239 CrossRef.
- S. A. Elfeky, S. E. Mahmoud and A. F. Youssef, J. Adv. Res., 2017, 8, 435–443 CrossRef PubMed.
- M. Feng, Y. Lu, Y. Yang, M. Zhang, Y. J. Xu, H. L. Gao, L. Dong, W. P. Xu and S. H. Yu, Sci. Rep., 2013, 3, 2994 CrossRef PubMed.
- G. Li, B. Zhang, F. Yu, A. A. Novakova, M. S. Krivenkov, T. Y. Kiseleva, L. Chang, J. Rao, A. O. Polyakov and G. R. Blake, Chem. Mater., 2014, 26, 5821–5829 CrossRef.
- L. Na, F. Fu, J. Lu, Z. Ding, T. Bing and J. Pang, Environ. Pollut., 2016, 220, 1376–1385 Search PubMed.
- S. C. Ponce, C. Prado, E. Pagano, F. E. Prado and M. Rosa, Ecol. Eng., 2015, 74, 33–41 CrossRef.
- J. Du, J. Bao, C. Lu and D. Werner, Water Res., 2016, 102, 73–81 CrossRef PubMed.
- H. Sun, L. Wang, D. Chu, Z. Ma and A. Wang, Mater. Lett., 2015, 140, 35–38 CrossRef.
- J. Wu, X. B. Wang and R. J. Zeng, J. Hazard. Mater., 2017, 333, 275–284 CrossRef PubMed.
- Y. F. Lin and S. H. Hsu, J. Colloid Interface Sci., 2017, 485, 152–158 CrossRef PubMed.
- G. Qi, Y. Wang, L. Estevez, X. Duan, N. Anako, A. H. A. Park, W. Li, C. W. Jones and E. P. Giannelis, Energy Environ. Sci., 2011, 4, 444–452 RSC.
- Y. Jiang, W. Wang, X. Li, X. Wang, J. Zhou and X. Mu, ACS Appl. Mater. Interfaces, 2013, 5, 1913–1916 CrossRef PubMed.
- W. Han and M. Gao, Cryst. Growth Des., 2008, 8, 1023–1030 CrossRef.
- H. Lyu, J. Tang, Y. Huang, L. Gai, E. Y. Zeng, K. Liber and Y. Gong, Chem. Eng. J., 2017, 322, 516–524 CrossRef.
- G. Bing, Z. H. Jin, T. L. Li and X. H. Qi, Chemosphere, 2009, 75, 825–830 CrossRef PubMed.
- S. K. Singh, A. K. Singh, K. Aranishi and Q. Xu, J. Am. Chem. Soc., 2011, 133, 19638–19641 CrossRef PubMed.
- V. L. Tauson, R. G. Kravtsova, V. I. Grebenshchikova, E. E. Lustenberg and S. V. Lipko, Geochem. Int., 2009, 47, 231–243 CrossRef.
- D. C. Frost, W. R. Leeder, R. L. Tapping and B. Wallbank, Fuel, 1977, 56, 277–280 CrossRef.
- C. Domínguez, F. J. Pérez-Alonso, J. L. G. D. L. Fuente, S. A. Al-Thabaiti, S. N. Basahel, A. O. Alyoubi, A. A. Alshehri, M. A. Peña and S. Rojas, J. Power Sources, 2014, 271, 87–96 CrossRef.
- T. Mayer, Appl. Surf. Sci., 2001, 179, 257–262 CrossRef.
- Y. Gong, L. Gai, J. Tang, J. Fu, Q. Wang and E. Y. Zeng, Sci. Total Environ., 2017, 595, 743–751 CrossRef PubMed.
- H. W. Nesbitt and I. J. Muir, Geochim. Cosmochim. Acta, 1994, 58, 4667–4679 CrossRef.
- Q. Liu, M. Xu, F. Li, T. Wu and Y. Li, Chem. Eng. J., 2016, 296, 340–348 CrossRef.
- Y. Sun, Q. Yue, B. Gao, Y. Gao, Q. Li and Y. Wang, Chem. Eng. J., 2013, 217, 240–247 CrossRef.
- D. Park, Y. S. Yun and J. M. Park, J. Colloid Interface Sci., 2008, 317, 54–61 CrossRef PubMed.
- L. Tang, G. D. Yang, G. M. Zeng, Y. Cai, S. S. Li, Y. Y. Zhou, Y. Pang, Y. Y. Liu, Y. Zhang and B. Luna, Chem. Eng. J., 2014, 239, 114–122 CrossRef.
- B. Jiang, S. Xin, Y. Liu, H. He, L. Li, Y. Tang, S. Luo and X. Bi, J. Hazard. Mater., 2017, 343, 1–9 CrossRef PubMed.
- B. Jiang, H. He, Y. Liu, Y. Tang, S. Luo and Z. Wang, Chemosphere, 2018, 197, 367–374 CrossRef PubMed.
- M. J. Dekkers and M. A. A. Schoonen, Geochim. Cosmochim. Acta, 1994, 58, 4147–4153 CrossRef.
- H. Jabeen, V. Chandra, S. Jung, J. W. Lee, K. S. Kim and S. B. Kim, Nanoscale, 2011, 3, 3583–3585 RSC.
- C. H. Weng, C. P. Huang, H. E. Allen, P. B. Leavens and P. F. Sanders, Environ. Sci. Technol., 1996, 30, 371–376 CrossRef.
- B. Jiang, Y. Liu, J. Zheng, M. Tan, Z. Wang and M. Wu, Environ. Sci. Technol., 2015, 49, 12363–12371 CrossRef PubMed.
- M. Moran, Colloids Surf., A, 2004, 244, 77–85 CrossRef.
- F. Zhu, L. Li, S. Ma and Z. Shang, Chem. Eng. J., 2016, 302, 663–669 CrossRef.
- Z. Ai, Y. Cheng, L. Zhang and J. Qiu, Environ. Sci. Technol., 2008, 42, 6955–6960 CrossRef PubMed.
Footnote |
| † Electronic supplementary information (ESI) available. See DOI: 10.1039/c8ra06534a |
| This journal is © The Royal Society of Chemistry 2018 |

