 Open Access Article
Polyellisin, a novel polyketide from cultures of the basidiomycete Polyporus ellisii†
Shuang Wangab,
Zheng-Hui Lia,
Hong-Lian Aia,
Juan Hea,
Tao Feng *a and
Ji-Kai Liu*a
aSchool of Pharmaceutical Sciences, South-Central University for Nationalities, Wuhan 430074, China. E-mail: tfeng@mail.scuec.edu.cn; jkliu@mail.kib.ac.cn
bCollege of Pharmacy and Chemistry, Dali University, Dali 671000, China
First published on 10th September 2018
Abstract
Polyellisin (1), an unprecedented polyketide possessing a tricyclic system sharing a spiroketal carbon, was isolated from cultures of the basidiomycete Polyporus ellisii. The structure with absolute configuration was elucidated by means of spectroscopic methods and the single crystal X-ray diffraction. Polyellisin showed NO production inhibition with an IC50 value of 17.2 μM.
Introduction
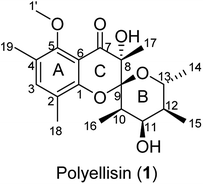
The basidiomycete Polyporus ellisii, belonging to the family Polyporaceae, is widely distributed in the Yunnan and Sichuan Provinces of China.1 Its young fruiting body is used as a popular and delicious food in southwestern China, Japan and Korea. So far, the reports of chemical investigations on the species are not too many and have mainly been carried out by our research group. At first, a number of biologically active cerebrosides were isolated from its fruiting bodies.2–4 After that, a number of ergosterols5 and sesquiterpenoids6 were obtained from cultures of this fungus in 2013. In our continuing search for structurally interesting and biologically active natural products from higher fungi,5–12 an unprecedented polyketide, named polyellisin (1, Fig. 1), was isolated from cultures of the fungus P. ellisii. The structure was identified by means of spectroscopic methods, while its absolute configuration was determined by the single crystal X-ray diffraction. Polyellisin possesses a 6/6/6 tricyclic system sharing a spiroketal carbon. Its cytotoxicity against five human cancer cell lines and its ability to inhibit NO production were evaluated. Herein, the isolation, structural elucidation, and the biological activities of polyellisin are discussed.Results and discussion
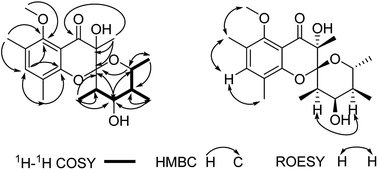
Polyellisin (1) had a molecular formula C20H28O6 as determined on the basis of the positive HRESIMS, which showed a molecular ion peak at m/z 387.1779 (calcd for C20H28O6Na, 387.1783), corresponding to seven degrees of unsaturation. The IR spectrum indicated the presence of hydroxy group (3438 cm−1), carbonyl group (1708 cm−1) and double-bonds (1623, 1593 cm−1). The 1D NMR spectra, as well as the HSQC spectrum, revealed seven methyls (one methoxy), five methines, and eight quaternary carbons (Table 1). Of them, one olefinic proton at δH 7.18 (s, H-3), together with six olefinic carbon resonances indicated the presence of a five substituted benzene ring A (Fig. 1). The locations of substituent groups in the benzene ring were established by HMBC and ROESY spectra. In the ROESY spectrum, the olefinic proton at δH 7.18 (s, H-3) showed ROESY correlations to 2.21 (3H, s, Me-18) and δH 2.20 (3H, s, Me-19), indicating that the two methyls should be located at C-2 and C-4. While in the HMBC spectrum, the key HMBC correlation from H-3 to the oxygenated carbons at δC 153.0 (s) and 157.0 (s) revealed that these two olefinic carbons were assigned to C-1 and C-5. The carbonyl carbon at δC 191.8 (s) was identified to be connected to C-6 of the benzene ring. In the 1H–1H COSY spectrum, a partial moiety was established as shown in Fig. 2. In addition, a key HMBC correlation from δH 3.70 (1H, dq, J = 12.3, 6.2 Hz, H-13) to δC 107.8 (s, C-9) was detected. These data constructed a six-membered ether ring B (Fig. 2). Except the carbon resonances included in rings A and B, the rest including a carbonyl carbon at δC 191.8 (s, C-7), an sp3 quaternary carbon at δC 76.2 (s, C-8), and a methyl carbon at δC 18.0 (q, C-17) are likely to build a six-membered ether ring C (Fig. 1), as deduced from the HMBC correlations from δH 1.44 (3H, s, Me-17) to C-7, C-8, and C-9, as well as from the mass spectroscopic data. Therefore, the gross structure of 1 was established as depicted.| δH (J in Hz) | δC, type | |
|---|---|---|
| a Data were assigned by HSQC, HMBC, 1H–1H COSY and ROESY spectra. | ||
| 1 | 153.0, qC | |
| 2 | 120.5, qC | |
| 3 | 7.18 s | 139.0, CH |
| 4 | 125.2, qC | |
| 5 | 157.0, qC | |
| 6 | 112.0, qC | |
| 7 | 191.8, qC | |
| 8 | 76.2, qC | |
| 9 | 107.8, qC | |
| 10 | 2.30 qd (7.2, 3.1) | 38.3, CH |
| 11 | 3.58 br d (9.4) | 74.9, CH |
| 12 | 1.53 qd (7.0, 3.0) | 42.0, CH |
| 13 | 3.70 dq (12.3, 6.2) | 68.0, CH |
| 14 | 1.07 d (6.2) | 18.9, CH3 |
| 15 | 0.98 d (7.0) | 13.8, CH3 |
| 16 | 1.25 d (7.2) | 13.2, CH3 |
| 17 | 1.44 s | 18.0, CH3 |
| 18 | 2.21 s | 15.8, CH3 |
| 19 | 2.20 s | 14.9, CH3 |
| OMe | 3.76 s | 61.0, CH3 |
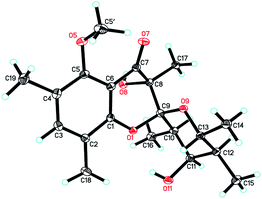
Since multiple chiral centers and adjacent quaternary carbons, the relative configuration of 1 could not be identified by the ROESY experiment. Only the ROESY correlation between H-10 and H-12 could indicated that the Me-15 and Me-16 were equatorial (Fig. 2). Fortunately, a single crystal X-ray diffraction not only confirmed the structure elucidation above but also established the absolute configuration as shown in Fig. 3.
Compound 1 was evaluated for its cytotoxicity against five human cancer cell lines, SK-BR-3 breast, SMMC-7721 hepatocellular carcinoma, HL-60 myeloid leukemia, PANC-1 pancreatic cancer and A-549 lung cancer, using the MTT method reported previously13 with minor revision. Unfortunately, the results showed that 1 exhibited no significant inhibitory activities with IC50 values more than 40 μM. In addition, compound 1 was evaluated for its anti-inflammatory activity using the method of the NO production inhibition, as that we reported recently.14 The result suggested that compound 1 possessed certain NO production inhibition with an IC50 value of 17.2 μM.
Conclusions
In summary, the chemical investigation on the edible mushroom of P. ellisii was carried out, which resulted in the isolation of a novel polyketide, namely polyellisin (1). It possessed a tricyclic system sharing a spiroketal carbon, and the absolute configuration was determined by the single crystal X-ray diffraction. Polyellisin showed certain NO production inhibitory activity, suggesting a potential anti-inflammatory candidate.Experimental section
General experimental procedures
The melting points were tested by a Putiantongchuang WRX-5A apparatus. Optical rotations were measured on a Jasco-P-1020 polarimeter. IR spectra were obtained by using a Bruker Tensor 27 FT-IR spectrometer with KBr pellets. NMR spectra were acquired with instrument of a Bruker DRX-500. HRESIMS was measured on an API QSTAR Pulsar spectrometer. Silica gel (200–300 mesh and 80–100 mesh, Qingdao Marine Chemical Inc., China) and Sephadex LH-20 (Amersham Biosciences, Sweden) were used for column chromatography (CC). Fractions were monitored by TLC (Qingdao Marine Chemical Inc., China) and spots were visualized by heating silica gel plates immersed in vanillin–H2SO4 in EtOH, in combination with Agilent 1200 series HPLC system (Eclipse XDB-C18 column, 5 μm, 4.6 × 150 mm). Preparative HPLC was performed on an Agilent 1100 series with a Zorbax SB-C18 (5 μm, 9.4 × 150 mm) column. MPLC was performed on Buchi apparatus equipped with Buchi fraction collector C-660, Buchi pump module C-605 and manager C-615.Fungal material and cultivation conditions
Fruiting bodies of P. ellisii were collected at Jingdong, Yunnan Province, China in 2003 and identified by Prof. Zhu-Liang Yang (Kunming Institute of Botany). The voucher specimen (no. CGBWSHF00118) was deposited at herbarium of Kunming Institute of Botany. Culture medium was composed of glucose (5%), pork pepton (0.15%), yeast (0.5%), KH2PO4 (0.05%) and MgSO4 (0.05%). Initial pH was adjusted to 6.0, the fermentation was first carried out on an Erlenmeyer flask for 6 days till the mycelium biomass reached to the maximum. Later it was transferred to a fermentation tank (100 L) at 24 °C and 250 rpm for twenty days, ventilation was setted to 1.0 vvm (vvm: air volume/culture volume/min).Extraction and isolation
The culture broth (80 L) was extracted four times with EtOAc. The organic layer was evaporated to give a crude extract (71 g). Then it was subjected to silica gel CC (200–300 mesh) eluted with petroleum ether (PE)–Me2CO gradient system to afford fractions A–G. Fraction C, eluted with PE–Me2CO (8/1), was separated by Sephadex LH-20 CC (CHCl3–MeOH, 1/1), then applied to preparative MPLC with a reversed-phased C18 column (MeOH–H2O, 50–100%) and preparative HPLC (MeCN–H2O, 0–20%, 10 mL min−1) to give 1 (4.8 mg).![[thin space (1/6-em)]](https://www.rsc.org/images/entities/char_2009.gif) ε) 202 (3.61), 218 (3.70), 262 (3.16) nm; IR (KBr) νmax 3483, 2972, 2932, 1708, 1623, 1593, 1474, 1381, 1298, 1090, 1025, 960 cm−1; 1H and 13C NMR data (see Table 1); HRESIMS (pos.) m/z 387.1779 (calcd for C20H28O6Na, 387.1783).
ε) 202 (3.61), 218 (3.70), 262 (3.16) nm; IR (KBr) νmax 3483, 2972, 2932, 1708, 1623, 1593, 1474, 1381, 1298, 1090, 1025, 960 cm−1; 1H and 13C NMR data (see Table 1); HRESIMS (pos.) m/z 387.1779 (calcd for C20H28O6Na, 387.1783).Cytotoxicity assay
All the cells were cultured in RPMI-1640 or DMEM medium (Hyclone, USA), supplemented with 10% fetal bovine serum (Hyclone, USA) in 5% CO2 at 37 °C. The cytotoxicity assay was performed according to the MTT (3-(4,5-dimethylthiazol-2-yl)-2,5-diphenyl tetrazolium bromide) method in 96-well microplates. Briefly, 100 μL adherent cells were seeded into each well of 96-well cell culture plates and allowed to adhere for 12 h before drug addition, while suspended cells were seeded just before drug addition with initial density of 1 × 10⁵ cells per mL. Each tumor cell line was exposed to the test compound at concentrations of 0.0625, 0.32, 1.6, 8, and 40 μM in triplicates for 48 h, with cisplatin (sigma, USA) as a positive control. After compound treatment, cell viability was detected and cell growth curve was graphed.Anti-NO production assay
Murine monocytic RAW264.7 macrophages were dispensed into 96-well plates (2 × 10⁵ cells per well) containing RPMI 1640 medium (Hyclone) with 10% FBS under a humidified atmosphere with 5% CO2 at 37 °C. After 24 h of preincubation, cells were treated with serial dilutions of the test compounds, up to a maximum concentration of 25 μM (n = 2), in the presence of 1 μg mL−1 LPS for 18 h. The compounds were dissolved in DMSO and further diluted in medium to produce different concentrations. NO production in each well was assessed by adding 100 μL of Griess reagent (reagent A and reagent B, Sigma) to 100 μL of each supernatant from the LPS-treated or LPS- and compound-treated cells in triplicate. After 5 min incubation, the absorbance of samples was measured at 570 nm with a 2104 Envision Multilabel Plate Reader (Perkin-Elmer Life Sciences, Inc., Boston, MA, USA). MG-132 (Sigma-Aldrich, purity 98%) was used as a positive control (IC50 = 2.8 μM). Compound 1 (purity > 90%) were tested for inhibitory activity on NO production.Conflicts of interest
There are no conflicts to declare.Acknowledgements
This work was financially supported by the National Key Research and Development Program of China (2017YFC1704007), National Natural Science Foundation of China (81773590, 81872762, 31870513, 81561148013), Thailand Research Fund (grant no. DBG5980002), the Key Projects of Technological Innovation of Hubei Province (No. 2016ACA138), and the Fundamental Research Funds for the Central University, South-Central University for Nationalities (CZP18005, CZQ17010, CZQ17008, CZT18014, CZT18013). The authors thank the Analytical & Measuring Center, School of Pharmaceutical Sciences, South-Central University for Nationalities for the spectra test.Notes and references
- H. D. Zheng and P. G. Liu, Fungal Divers., 2008, 32, 157–170 Search PubMed.
- J. M. Gao, A. L. Zhang, H. Y. Yao and J. Shen, Zhongguo Zhongyao Zazhi, 2003, 28, 943–945 Search PubMed.
- J. M. Gao, L. Hu, Z. J. Dong and J. K. Liu, Lipids, 2001, 36, 521–527 CrossRef PubMed.
- J. K. Liu, Heterocycles, 2002, 57, 157–167 CrossRef.
- S. Wang, L. Zhang, L. Y. Liu, Z. J. Dong, Z. H. Li and J. K. Liu, Nat. Prod. Bioprospect., 2012, 2, 240–244 CrossRef.
- S. Wang, Z. H. Li, Z. J. Dong, J. K. Liu and T. Feng, Fitoterapia, 2013, 91, 194–198 CrossRef PubMed.
- J. H. Ding, T. Feng, B. K. Cui, K. Wei, Z. H. Li and J. K. Liu, Tetrahedron Lett., 2013, 21, 2651–2654 CrossRef.
- X. Y. Yang, T. Feng, Z. H. Li, Y. Sheng, X. Yin, Y. Leng and J. K. Liu, Org. Lett., 2012, 14, 5382–5384 CrossRef PubMed.
- M. Y. Jiang, Y. Li, F. Wang and J. K. Liu, Phytochemistry, 2011, 72, 923–928 CrossRef PubMed.
- Z. Y. Zhou, G. Q. Shi, R. Fontaine, K. Wei, T. Feng, F. Wang, G. Q. Wang, T. Qu, Z. H. Li, Z. J. Dong, H. J. Zhu, Z. L. Yang, G. Zeng and J. K. Liu, Angew. Chem., Int. Ed., 2012, 51, 2368–2370 CrossRef PubMed.
- Z. Z. Zhao, H. P. Chen, B. Wu, L. Zhang, Z. H. Li, T. Feng and J. K. Liu, J. Org. Chem., 2017, 82, 7974–7979 CrossRef PubMed.
- S. B. Zhang, Y. Huang, S. J. He, H. P. Chen, Z. H. Li, B. Wu, J. P. Zuo, T. Feng and J. K. Liu, RSC Adv., 2018, 8, 23914–23918 RSC.
- T. Mosmann, J. Immunol. Methods, 1983, 65, 55–63 CrossRef PubMed.
- S. B. Zhang, Z. H. Li, M. Stadler, H. P. Chen, Y. Huang, X. Q. Gan, T. Feng and J. K. Liu, Phytochemistry, 2018, 152, 105–112 CrossRef PubMed.
Footnote |
| † Electronic supplementary information (ESI) available: One PDF document. CCDC 936912. For ESI and crystallographic data in CIF or other electronic format see DOI: 10.1039/c8ra06544f |
| This journal is © The Royal Society of Chemistry 2018 |


