 Open Access Article
Highly hydrophilic carbon nanoparticles: uptake mechanism by mammalian and plant cells†
Lijuan Chenabc,
Hongbo Wangd,
Xiang Lid,
Cong Nied,
Taibo Liange,
Fuwei Xied,
Kejian Liud,
Xiaojun Peng c and
Jianping Xie
 *d
*d
aKey Laboratory of Separation Science for Analytical Chemistry, Dalian Institute of Chemical Physics, Chinese Academy of Sciences, 457 Zhongshan Road, Dalian, Liaoning 116023, China
bUniversity of Chinese Academy of Sciences, 19 Yuquan Road, Beijing 100049, China
cState Key Laboratory of Fine Chemicals, Dalian University of Technology, Dalian, Liaoning 116012, China
dKey Laboratory of Tobacco Chemistry, Zhengzhou Tobacco Research Institute of CNTC, 2 Fengyang Road, Zhengzhou, 450001, China. E-mail: ztridicp@126.com; Tel: +86-371-67672113
eKey Laboratory of Ecological Environment and Tobacco Quality, Zhengzhou Tobacco Research Institute of CNTC, 2 Fengyang Road, Zhengzhou, 450001, China
First published on 15th October 2018
Abstract
As one of the carbon based materials, the potential application of carbon nanoparticles (CNPs) has emerged in the promotion of plant growth. However, knowledge on the biological mechanism of how the CNPs interact with plant cells is limited. In this study, nanostructures of CNPs were examined. The particles exhibited particulate morphology and their size distribution was in the range of 18 to 70 nm, with an average size of 30 nm. Hydrophilic groups of COOH and OH were present on the surface of CNPs, and CNPs showed the common feature of graphitic sp2 hybridization carbons. The CNPs were determined to be biocompatible with these two cell lines, mammalian cells (A549 cells) and plant cells (BY-2 cells). The COOH groups on the surface of CNPs were functionalized via covalent binding with a fluorescent dye for improvement of the fluorescence. The fluorescent carbon nanoparticles (FCNPs) were found to cross the cell membrane and enter cells (A549 cells and BY-2 cells) in an energy-dependent manner. Subsequently, the mechanism of FCNPs interaction with the cell membrane was evaluated in the presence of inhibitors that specifically affect different endocytosis membrane proteins. The FCNPs mainly entered A549 cells through caveolin-mediated endocytosis and macropinocytosis, and clathrin-dependent endocytosis was also involved in the transportation of the FCNPs. Clathrin-independent endocytosis mediated in the internalization of FCNPs in BY-2 cells. The way FCNPs entering cells will provide a fundamental understanding of the influence of CNPs on cell membrane.
1 Introduction
During recent decades, carbon nanomaterials have attracted an increasing amount of attention. There are many carbon nanomaterials that possess various structures, excellent conductivity, and a large surface area; these materials include fullerene,1 single-walled carbon nanotubes (SWCNTs),2 multi-walled carbon nanotubes (MWCNTs),3–5 carbon nanofibers,6 and graphene oxide.7,8 Carbon nanomaterials have been applied in biological and biomedical applications due to their low toxicity. As one type of nanoscale carbon material, carbon nanoparticles (CNPs) have been prepared from various carbon sources, including candle soot,9,10 and organic molecules, such as phenol,11 citric acid,12 carbohydrates,13 sucrose,14 ascorbic acid,15 melamine and trisodium citrate dihydrate.16,17 Hence, CNPs have been identified as a new type of carbon based nanomaterials with fascinating properties due to the variability of their raw materials and synthetic processes.Recently, the interest of researchers has been aroused by carbon nanomaterials for regulating plant growth. Yuan et al. found that MWCNTs could increase the number of nodules and enhance the activity of nitrogenase in the rhizobium–plant interaction.18 In this study, we prepared one kind of CNPs, via electrochemical oxidation of graphite plate in deionized water with some modifications,19 and this process differed from the preparation of graphene oxide.20 Our present studies suggested that a suitable concentration of CNPs promoted plant growth and increased the potassium content in plants, though the mechanism by which CNPs affect plants is still unknown. Few reports are available on the applications of CNPs in mammalian cells. The ability of CNPs to be internalized by cells is an important property that reveals their mechanisms how CNPs affect the cells. However, few reports describe the mechanisms by which the emerging nanostructures interact with mammalian cells or plant cells. In particular, whether CNPs only attach to the cell surface or penetrate the cell membrane is still unknown.
Cellular uptake has been studied with other types of nanoparticles.21–24 For instance, graphene oxide (GO) has been reported to exhibit different mechanisms depending on the cell type, with a microtubule-dependent mechanism in Saos-2 osteoblasts, and clathrin-dependent in HepG2 hepatocytes and RAW-264.7 macrophages.24 Nanoparticles were shown to be incorporated into the plasma membrane and enter cells through the following two different endocytosis pathways that depended on the particle size: phagocytosis (particles larger than 0.5 μm) and pinocytosis (uptake of fluids and solutes).24,25 Pinocytosis occurs in all cell types and exhibits multiple forms according to cell type and function. The latest classification of pinocytosis is depended on the proteins involved in the pathways of the endocytic process.24 Thus, pinocytosis is classified as “clathrin-mediated endocytosis” and “clathrin-independent endocytosis”.
Fluorescent imaging techniques play an important role in the visualization of nanomaterials in cells and living organisms. The most frequently used method for incorporating fluorescent dye molecules into nanoparticles and inorganic materials, is through reactive moieties that are conjugated to the nanomaterial.26–28 Nanomaterials with intense fluorescence properties can be located in cells.
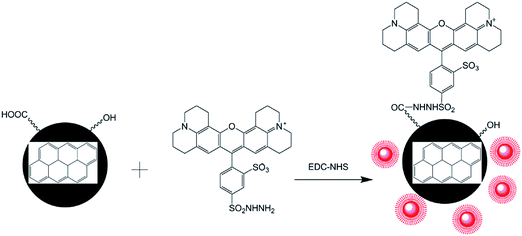
In this paper, a method for preparing CNPs by the electrochemical oxidation of graphite plates was established in deionized water with some modifications. The physical properties and chemical structures of CNPs were determined. Then, a strategy for preparing FCNPs was developed via the covalent attachment of a fluorescent dye (Fig. 1). Cellular uptake by the two cell types was investigated. These findings will provide a fundamental understanding of how CNPs entering into cells and affecting cell behaviors and functions for further study.
2 Methods
2.1 Reagents and materials
4′,6-Diamidino-2-phenylindole (DAPI) was purchased from Sigma-Aldrich (St. Louis, USA). Texas Red hydrazide (TRH) was obtained from Thermo Fisher Scientific (Waltham, USA). N-Hydroxysuccinimide (NHS), 1-(3-dimethylaminopropyl)-3-ethylcarbodiimide hydrochloride (EDC·HCl) and paraformaldehyde were purchased from Aladdin (Shanghai, China). All other chemicals and solvents were of analytical grade.2.2 Preparation of CNPs
CNPs were prepared according to the method of Cui et al. with some modifications.19 A customized glass box without lid was used as an electrolytic cell, in which two high purity graphite plates (10 × 10 × 0.5 cm, 99.999%) were immersed in deionized water containing 0.1% ethylene glycol, as the anode and the counter electrode, respectively. The deepness of the graphite electrode immersed in aqueous solution was 7.0 cm and distance between two electrodes was 1 cm. The voltage was set at 16 V and current of 0.2 A was employed on graphite electrodes for 9 days at room temperature.2.3 Characterization of CNPs
Element analysis of CNPs was conducted with an Elementar device (Vario EL cube, Germany) in CHNS and O mode, respectively. TEM images were taken on a Tecnai G2/F20 microscope (FEI, USA) operated at 200 kV. The size distribution and zeta potential of CNPs in aqueous solution were estimated using a Nano Plus apparatus (Nanoplus-3, Germany). The solid-state nuclear magnetic resonance (ssNMR) spectra were collected on a Bruker Avance 400 MHz spectrometer. Powder X-ray diffraction (XRD) was performed using a PANalytical X'Pert PRO diffractometer with focused Cu Kα1 X-rays. The specific surface areas were determined by the Brunauer–Emmett–Teller method (BET, Micromeritics Tristar-II, USA). The maximum BET surface area of sample was calculated according to the following equation:
 | (1) |
2.4 Cytotoxicity of CNPs
The A549 cell viability upon exposure to CNPs was examined by cell counting kit-8 (CCK-8) assay.29 According to the instructions, 0.1 mL of cells was seeded in 96-well microplates at a density of 5 × 10⁴ cells per mL in 1640 medium, containing 10% FBS and 1% penicillin–streptomycin. After 24 h to achieve cell attachment, the cells were incubated with CNPs for 24 h. Then, the nanoparticles were removed, and the cells were washed with PBS for three times. 0.01 mL of CCK-8 solution and 0.1 mL of 1640 cell culture medium was then added to each well and incubated for 2 h at 37 °C. The plates were then tested by a microplate reader (Spectra max190, Molecular Devices) at 450 nm. Eight replicate wells were used per concentration, and the experiment was repeated at least three times. The results are presented as the mean ± standard deviation (SD).The BY-2 cell viability was measured by 2,3,5-triphenyltetrazolium chloride (TTC) assay with some modifications.30 Briefly, BY-2 cells (fresh weight of approximately 2.0 g) were seeded in a culture flask with 40 mL of Murashige–Skoog (MS) medium. The cells were incubated with CNPs for 24 h. Then, 5 mL of the cell suspensions and 2 mL TTC solution (0.4%) were pipetted into a centrifuge tube, which was placed in the dark for 3–6 h. Then, 5 mL ethanol (95%) was added to each centrifuge tube and vibrated for 9 h after removing the supernatant at room temperature. The ethanol supernatant was collected and the absorbance at 485 nm was determined by a UV-visible spectrophotometer. The experiment was repeated at least three times. The results are presented as the mean ± standard deviation (SD).
2.5 Synthesis of FCNPs
FCNPs were prepared via EDC-NHS chemistry.31 First, 4 mL of EDC·HCl (100 mM) and 4 mL of NHS (10 mM) was added to 200 mL of a CNPs solution (0.05 mg mL−1). The mixture was stirred for 4 h in the dark at room temperature, which was followed by adding the TRH solution (0.1 mL, 5 mg mL−1). The reaction was stopped after stirring for another 4 h. The resulting FCNPs were purified by centrifugation at 8000g, using Nanosep filters (Pall Nanosep) with a molecular weight cut-off of 3 kDa to remove impurities.2.6 Characterization of FCNPs
UV-visible absorption spectra and fluorescence spectra were recorded on UV-visible spectrometer (Cary 100, Agilent Technologies, USA) and a Lumina fluorescence spectrometer (Thermo Scientific, USA), respectively. FT-IR spectra were collected in transmission mode on a Nicolet IS50FT-IR spectrometer (Thermo Scientific, USA). X-ray photoelectron spectra (XPS) were carried out using an AXIS Supra X-ray photoelectron spectrometer.2.7 Cellular uptake studies
2.8 Confocal microscopy studies
Fluorescence images of the cells incubated with FCNPs were captured on a Leica TCS SP8 scanning confocal laser microscope (Leica Microsystems) with an excitation wavelength of 552 nm and a measurement range of 610–670 nm. DAPI fluorescence was excited at 405 nm and measured at 420–480 nm.2.9 Image analysis
Confocal fluorescence images were analyzed using ImageJ software (US National Institutes of Health).23 Values represent as the mean ± standard deviation (SD) according to analysis of 20 randomly selected cells.2.10 Statistics
Statistical Package for the Social Sciences (SPSS) version 13 was employed for statistical analysis. Statistical comparisons were performed by analysis of variance (ANOVA).3 Results and discussion
3.1 Characterization of CNPs
The current profile and pH variations are shown in Fig. 2. The cell current increased rapidly and the pH value of the solution decreased consistently. The electrolyte solution became black after 9 days. The solvent was evaporated by vacuum freezing (FreeZone 2.5Plus, Labconco) after freezing the solution at −70 °C to obtain the CNPs. The composition of the powder was determined by an Elementar device. As shown in Table 1, The CNPs were composed of C, H, O, N and S, with atomic mass percentages of 43.440, 2.820, 49.810, 0.010 and 0.403, respectively. The atomic mass percentages of N and S in the CNPs composition were negligible because they may originate from impurities of graphite. The solution (0.05 mg mL−1) was dropped on a carbon-coated copper grid and examined by TEM. As shown in Fig. 3A, CNPs exhibited particulate morphology, and the average size of the particles was approximately 30 nm. The particle size was analyzed by dynamic light scattering (DLS), and size distribution was in the range of 18 to 70 nm (Fig. 3B). The size distribution determined by DLS was consistent with that determined from the TEM results. The particles carried a net negative charge, with a zeta potential of 28.2 mV (Fig. 3C). According to the FT-IR spectrum of CNPs in Fig. 7C, the characteristic peaks were the absorption band at 1700 cm−1, corresponding to the C![[double bond, length as m-dash]](https://www.rsc.org/images/entities/char_e001.gif) O stretching of carboxyl groups, and the very strong and broad absorption band corresponding to O–H stretching of carboxylic acid at 2500–3100 cm−1. The C–O stretching vibration was located at 1200 cm−1 and the stretching vibrations of –OH group appeared as a broad band at 3400 cm−1. Thus, the results of FT-IR spectroscopy indicated that the CNPs contained abundant oxygen-containing groups, such as carboxyl and hydroxyl groups.
O stretching of carboxyl groups, and the very strong and broad absorption band corresponding to O–H stretching of carboxylic acid at 2500–3100 cm−1. The C–O stretching vibration was located at 1200 cm−1 and the stretching vibrations of –OH group appeared as a broad band at 3400 cm−1. Thus, the results of FT-IR spectroscopy indicated that the CNPs contained abundant oxygen-containing groups, such as carboxyl and hydroxyl groups.
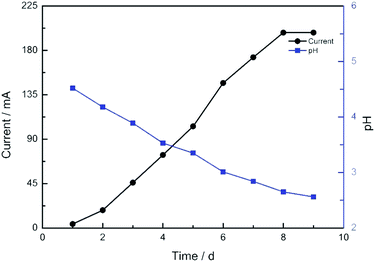 | ||
| Fig. 2 The current profile and pH variation of the electrochemical cell after the voltage of 16 V was applied. | ||
| Elemental composition | C | H | O | N | S |
| Atomic mass percentage (%) | 43.440 | 2.820 | 49.810 | 0.010 | 0.403 |
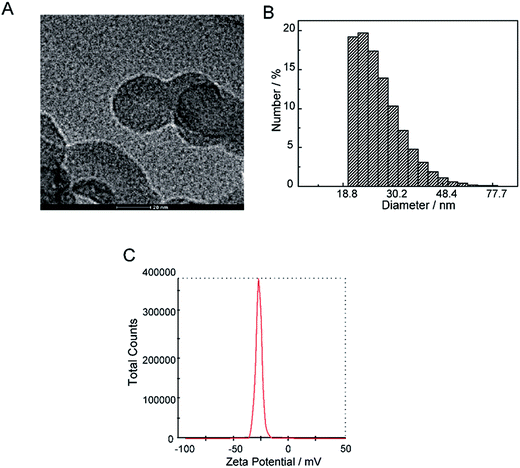 | ||
| Fig. 3 Physical chemical properties of CNPs. (A) TEM images of CNPs. (B) Hydrodynamic diameter of CNPs was measured by dynamic light scattering. (C) Zeta potential of CNPs. | ||
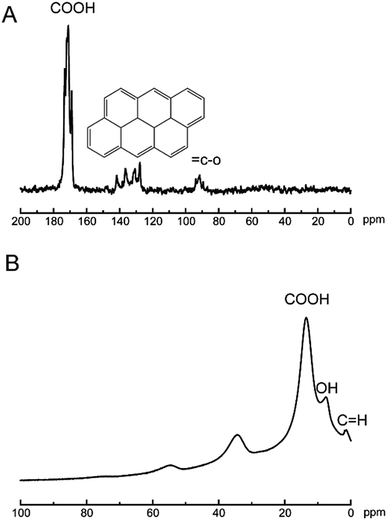
The analysis technics of ssNMR are proved to be useful in the nanomaterials world.35–37 To date, the chemical composition of GO sheets was completed using 1D 13C ssNMR.38 Herein, technics of ssNMR were applied to characterization of the CNPs. In Fig. 4A, the typical feature of 13C signals at 170 ppm was assigned to carboxylic acids, and 120–140 ppm was corresponding to basal graphitic sp2 carbons, and 80 ppm was attributed to carbon binding with hydroxyl groups. In Fig. 4B, the feature of 1H signals at 16, 8, 2 ppm was corresponding to carboxylic acids, hydroxyl groups and basal graphitic sp2 hydrogen, respectively. Undoubtedly, ssNMR is powerful in addressing the structural information of multidimensional materials. The XRD pattern of CNPs was shown in Fig. S1.† The breadth of this diffraction peak was correlated to degree of the amorphous nature of the CNPs. The CNPs still showed crystalline structure, referring to the diffraction peak breadth. The low-angle spacing increasing compared to graphite, with an interlayer spacing closer to 3.4 Å as reported.38 After oxidation process, the intensity of diffraction line (26.23 = 2θ(°)) finally disappeared, which is the characteristic peak of graphite. Simultaneously, the intensity of the diffraction peak at 10.5° appeared with oxidation. The other peaks in Fig. S1a† could be explained by the fact that oxidation of graphite resulted in oxygen intercalation into layer spacing to change topological structure of graphitic or cause vacancy defects in the carbon lattice.39
When voltage is applied to graphite, graphite sheets peel off and this exfoliation process produces very thin graphitic flakes, which in some cases consist of nanoparticles or a single atomic layer. The mechanism by which oxygen can be incorporated into a graphene layer to form graphene oxide is relatively well known, in which oxidation results in the formation of epoxy and hydroxyl groups.40 The preparation of CNPs was speculated to occur during these graphite oxidation processes. During the oxidation of graphite, two epoxides may form on the opposite ends of a hexagon, and meanwhile the strain generated by the cooperative alignment of the epoxy groups could cause cleavage of the epoxy groups. Binding of a new epoxy group could be accompanied by cleavage of the present epoxy groups. Given that an open epoxy ring is substantially weaker than a closed ring, cleavage of the epoxy groups generates –COOH groups, and the formation of these –COOH groups was responsible for the consistent decrease of the pH value of the CNPs solution. It is supposed that the generation mechanism of hydroxyl groups on the surface of CNPs was in accordance with the formation of COOH. Graphite is used as a main source for the formation of CNPs, and ethylene glycol is chosed as a dispersing agent to prevent particles aggregation. Therefore, the CNPs solution with ethylene glycol was more stable over a few months compared with CNPs solution without ethylene glycol. In addition, the stability of CNPs solution ascribed to the existence of abundant hydrophilic groups of carboxyl and hydroxyl groups.
3.2 Pore structure characterization
The nitrogen gas adsorption–desorption isotherm of CNPs were shown in Fig. 5A. At the extremely low relative pressure, the low adsorbing capacity of N2 was due to pores exhibiting micro-pore filling. The multilayer adsorption appeared with the relative pressure increasing. The uptrend of adsorption isotherm indicated transition from the monolayer to multilayer, which could reflect the existence of mesopores and macropores. In the desorption process, as the relative pressure decreased, the quantity of gas adsorption reduced.41 Meanwhile, the desorption curve was drived to go accordance with the adsorption curve. The hysteresis loop between the adsorption and desorption was attributed to the existence of mesopores and macropores. The distribution of pore diameters was from 1 to 200 nm, but the pore volumes were very low (the inset in Fig. 5A). As pore diameters increased drastically, the pore volumes had no changes compared with the micropores (d < 2 nm), which could attribute to the slit pores (meso-macropores) caused by the stack of particle materials, not on the surface of CNPs.42 In Fig. 5B, the calculated value of BET surface area according to the eqn (1) was very low. Hence, combined the quantities of N2 adsorption with pore volumes, it was speculated that there were mainly micropores existence on CNPs.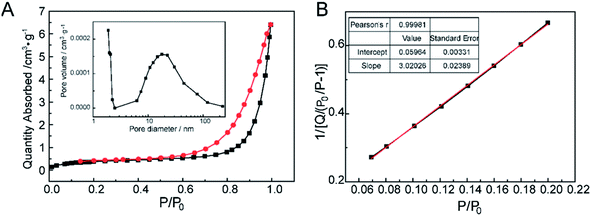 | ||
| Fig. 5 The pore structure characterization of CNPs. (A) N2 adsorption/desorption isotherms and the pore distribution as an inset. (B) BET surface area of CNPs. | ||
3.3 Cytotoxicity of CNPs
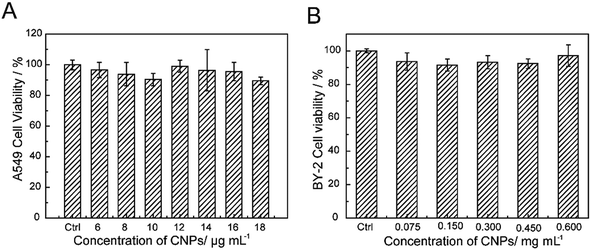
The cytotoxicity of the CNPs was investigated through incubating with A549 cells and BY-2 cells. Furthermore, the cell viability upon exposure to CNPs was investigated by CCK-8 assay and TTC assay (Fig. 6A and B). No obvious reduction in viability was observed after incubation with the CNPs. Even at a concentration of 18 μg mL−1, the A549 cell viability was still above 90%, indicating the low toxicity and excellent biocompatibility of CNPs. For the BY-2 cells, the concentration was increased to 0.600 mg mL−1, and no adverse effects were observed. The low toxicity of CNPs to A549 cells and BY-2 cells indicated that the CNPs are compatible with cells. In our present work, we also discovered an interesting result in which the CNPs promoted the growth of tobacco callus instead of having an adverse effect. Other researchers have reported that cell growth was promoted when tobacco cells were exposed to SWCNTs.43.4 Characterization of FCNPs
Though CNPs themselves exhibit little fluorescence, the negatively charged of COOH groups can covalently bind with the positively charged –NH2 groups of a fluorescent dye. The fluorescent dye TRH was chosen for labeling of the CNPs. A schematic illustration of TRH binding on the surface of the CNPs to produce FCNPs is shown in Fig. 1. To evaluate the formation of FCNPs, characterization by UV-vis absorbance spectroscopy, fluorescence spectroscopy, FT-IR spectroscopy and XPS analysis was performed. The UV-vis absorption spectra of the CNPs and FCNPs are shown in Fig. 7A. Obvious differences were observed between the spectra of the CNPs and FCNPs. The FCNPs showed a relatively strong absorption within 550–650 nm as a characteristic peak (the inset in Fig. 7A), which is in agreement with the maximum excitation wavelength of 585 nm determined for the FCNPs (Fig. 7B). As shown in Fig. 7B, The FCNPs showed high intensity of excitation and emission peaks, which supported the formation of FCNPs. Compared with the FT-IR spectra of the CNPs, the new characteristic peak located at 1644 cm−1 was assigned to the –C![[double bond, length as m-dash]](https://www.rsc.org/images/entities/char_e001.gif) O groups of the amido bond I bands, and another new peak at 1567 cm−1 could be assigned to the NH groups of the amido bond II bands (in Fig. 7C). Moreover, C–N bonds were also observed according to the peak at 1400 cm−1. Thus, the FT-IR spectra clearly illustrated the formation of FCNPs.
O groups of the amido bond I bands, and another new peak at 1567 cm−1 could be assigned to the NH groups of the amido bond II bands (in Fig. 7C). Moreover, C–N bonds were also observed according to the peak at 1400 cm−1. Thus, the FT-IR spectra clearly illustrated the formation of FCNPs.
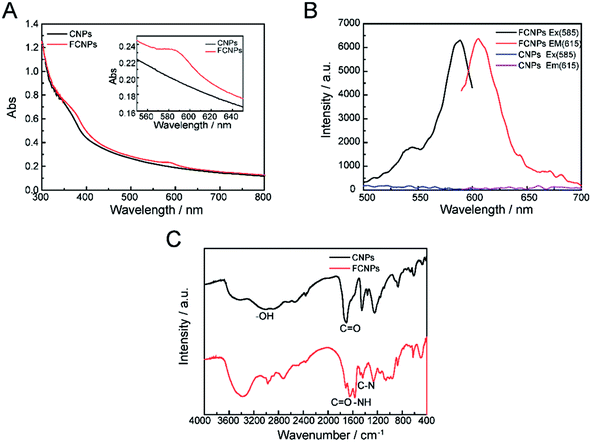 | ||
| Fig. 7 Characterization of FCNPs. (A) UV-vis absorption spectra, (B) fluorescent spectra and (C) FT-IR spectra of CNPs and FCNPs. | ||
XPS analysis also provided information about the elemental composition of the FCNPs. As shown in Fig. S2A,† the CNPs exhibited two typical peaks corresponding to C and O. In Fig. S2B,† the peaks located at 284.6, 285.6 and 289.3 eV were attributed to C–C, C–O and C![[double bond, length as m-dash]](https://www.rsc.org/images/entities/char_e001.gif) O bonds, respectively. As illustrated in Fig. S2C,† the peaks in the O spectrum at 529.5, 530.7 eV were ascribed to O–H and C–O bonds, respectively. Compared with the spectra of the CNPs, obvious changes were observed in the XPS spectra of the FCNPs, which contained three predominant peaks for C, O and N, as shown in Fig. S2A.† A new peak corresponding to N was identified in Fig. S2F,† revealing the presence of alkyl amide O
O bonds, respectively. As illustrated in Fig. S2C,† the peaks in the O spectrum at 529.5, 530.7 eV were ascribed to O–H and C–O bonds, respectively. Compared with the spectra of the CNPs, obvious changes were observed in the XPS spectra of the FCNPs, which contained three predominant peaks for C, O and N, as shown in Fig. S2A.† A new peak corresponding to N was identified in Fig. S2F,† revealing the presence of alkyl amide O![[double bond, length as m-dash]](https://www.rsc.org/images/entities/char_e001.gif) C–N bonds at 396.1 eV, and alkyl ammonium C–N bonds at 398.4 eV.43 Overall, the results of XPS analysis were consistent with those of FT-IR, which further demonstrated the formation of FCNPs. The fluorescence emission quantum yield (QY) for FCNPs was measured to be in the range of 3.21% with rhodamine B as a reference in aqueous solution. The lifetime of FCNPs was 1.1552 ns (τ1) and 4.2517 ns (τ2).
C–N bonds at 396.1 eV, and alkyl ammonium C–N bonds at 398.4 eV.43 Overall, the results of XPS analysis were consistent with those of FT-IR, which further demonstrated the formation of FCNPs. The fluorescence emission quantum yield (QY) for FCNPs was measured to be in the range of 3.21% with rhodamine B as a reference in aqueous solution. The lifetime of FCNPs was 1.1552 ns (τ1) and 4.2517 ns (τ2).
An abundant of –OH and –COOH groups were present on the CNPs, which made surface functionalization possible. Fluorescent dyes with –NH2 groups were covalently conjugated to the CNPs using EDC-NHS chemistry. The primary aliphatic amine of the red-fluorescent TRH dye can be coupled to aldehydes and ketones to form a Schiff base with an excitation λmax of 585 nm and an emission λmax of 610 nm. The carboxylic acids of proteins and other water-soluble biopolymers can also be coupled to this molecule in aqueous solution. This method has been widely recognized as an effective approach to improving the fluorescence intensity. Conjugated nanoparticles are formed by binding to highly fluorescent polymers to form nanoparticles with extremely intensive fluorescence.
3.5 Cellular uptake research by confocal microscopy
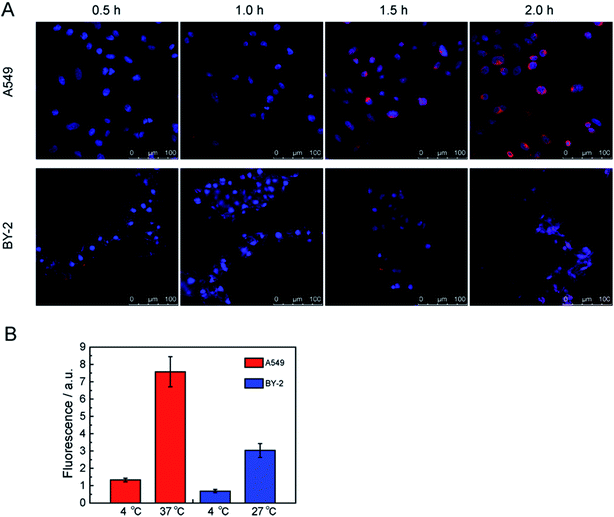
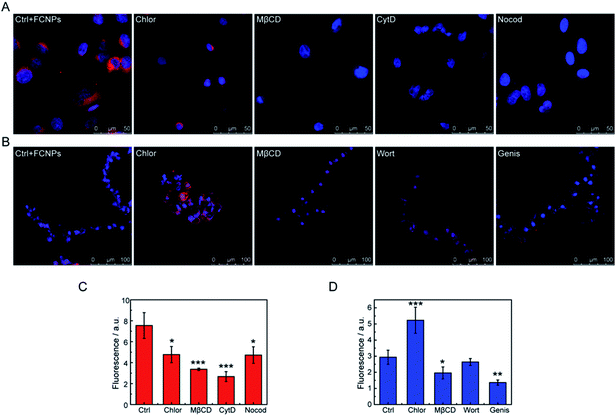
Due to the merits of the FCNPs, including their good colloidal stability, and intense fluorescence after labeling with fluorescent dye, these particles could be applied for determining the mechanisms of cellular uptake. At first, it was necessary to know the FCNPs uptake route and final intracellular location. Therefore, we characterized the time-course and the location of FCNPs in cells, and we conducted experiments in which cells were incubated in FCNPs. The transport of FCNPs across the cell membrane and into the cells was visualized by confocal microscopy (Fig. 8A). The emission wavelengths of the FCNPs and the cell nucleus dye DAPI were set in two color channels, which are depicted in red and blue, respectively. At the initial stages (0.5 h incubated with FCNPs), the weak fluorescence signal appeared around the cell nucleus. One hour later, the fluorescence signal became intensive, indicating FCNPs internalization into cells. After 0.5 h incubated with FCNPs, the FCNPs appeared to be more accessible to A549 cells, in which FCNPs mainly were around the cell nucleus, while FCNPs distributed on the cell surface and around the cell nucleus in BY-2 cells. After incubation for 2 h, the FCNPs absorbed by the A549 cells can be easily seen inside the cells (Fig. 8A and S3A†). Therefore, it was suitable to observation the FCNPs into cells with the time-course of 2 hours. The image of BY-2 cells was also collected (Fig. 8A and S3B†). The cell images indicated that the FCNPs penetrated the cell membranes and were mainly located in cell nucleus and cytoplasm in A549 cells, and aggregated around cell nucleus in BY-2 cells. Thus, the FCNPs were shown to efficiently enter A549 cells and BY-2 cells.A549 cells were incubated at 4 and 37 °C for 2 h (4 and 27 °C for BY-2 cells) to determine the energy dependence of FCNPs internalization. When we incubated A549 or BY-2 cells with FCNPs at 4 °C, it's hardly to detect the existence of FCNPs in both types of cells, indicating that FCNPs entered cells through energy-dependent endocytosis (Fig. 8B). At 4 °C, energy-dependent endocytic transport was repressed. Similar results have been published for other types of nanoparticles such as silicas and polymer dots.23,44,45 We further investigated endocytic processes of FCNPs.
The FCNPs within the cells were not individual nanoparticles but rather large aggregates, which was not due to a lack of colloidal stability. According to previous reports, these nanoparticles are taken in by specific endocytosis pathways via packaging many nanoparticles together instead of individual nanoparticles.46,47 The location of the FCNPs around cell nucleus in A549 cells was the same as that in the BY-2 cells, but absorption by the plant cells was more complicated because of the plant cell wall.
However, details on the processes of endocytosis have not been known. Thus, to elucidate the endocytic mechanisms, endocytosis inhibitors (chlorpromazine, methyl-β-cyclodextrin, cytochalasin D, and nocodazole for A549 cells; chlorpromazine, methyl-β-cyclodextrin, wortmannin, and genistein for BY-2 cells) were added to the culture medium before the FCNPs treatment. Table 2 shows the mechanism affected by each inhibitor. For A549 cells (Fig. 9A and C), the four inhibitors could block cellular uptake of the FCNPs. Chlorpromazine and nocodazole decreased FCNPs incorporation significantly (p < 0.05), while cytochalasin D and methyl-β-cyclodextrin decreased FCNPs incorporation extremely significantly (p < 0.001), and more than 50% of the FCNPs was blocked from entering the cells compared to the control group. These results indicated that the endocytic pathways were dependent on the microfilaments action (affected by cytochalasin D), microtubule function (affected by nocodazole), and caveolin-mediated endocytosis (affected by methyl-β-cyclodextrin). It is interesting to note that similar results that the uptake of polystyrene nanoparticles was inhibited by methyl-β-cyclodextrin in A549 cells, with an average diameter of 40 nm.25 Macropinocytosis depends on the microtubule function, which needs GTPases to mediate the activation of specific plasma membrane domains.48 In the present study, the introduction of cytochalasins D and nocodazole, which inhibit the activity of microfilaments through the polymerization of actin, reduced FCNPs uptake in the A549 cells. Chlorpromazine not only affected the passage of FCNPs across the membrane into cells, but also induced an abnormal of cell morphology along with aging of the cell nucleus. Taken together, the four inhibitors treatments changed the fluorescence signals in cells, suggesting that caveolin-mediated endocytosis, macropinocytosis and clathrin-dependent endocytosis were involved in the trafficking of FCNPs. Thus, the A549 cells may employ multiple endocytotic pathways in uptake of external nanomaterials.49,50
| Inhibitor | Affected mechanism | Target |
|---|---|---|
| Chlorpromazine | Clathrin-dependent endocytosis | Alteration of clathrin-coat assembly, membrane fluidity and permeability |
| Methyl-β-cyclodextrin | Clathrin-independent endocytosis | Caveolae and lipid raft internalizations |
| Cytochalasin D | Macropinocytosis | Blockage polymerization of actins avoiding microfilaments action and inhibition of other endocytosis routes |
| Nocodazole | Macropinocytosis | Inhibition of microtubule function involved in intracellular vesicle trafficking |
| Wortmannin | Phagocytosis | PI3K (selective) and other kinases as myosin light chain kinase and PI4K |
| Genistein | Clathrin-independent endocytosis | Inhibition of Src tyrosine kinases and caveolae dynamic |
For the BY-2 cells (Fig. 9B and D), treatment with genistein very significantly decreased FCNPs uptake into cells (p < 0.01) and methyl-β-cyclodextrin significantly decreased FCNPs internalization (p < 0.05). However, chlorpromazine seemed to increase the entry of the FCNPs through other mechanisms, which may be due to cytoskeletal alterations of the cells that make this structure more accessible for FCNPs to cross the membrane. Wortmannin did not decrease the FCNPs incorporation in the BY-2 cells, and thus phagocytosis and caveolae-mediated uptake are not involved in the FCNPs uptake under these experimental conditions. The doses of methyl-β-cyclodextrin and genistein used in this study had statistically significant effects on the BY-2 cells, thus suggesting that clathrin-independent endocytosis is involved in the FCNPs incorporation, in agreement with the mechanism by which nano beads enter BY-2 cells, while wortmannin had different effects on the incorporation of FCNPs (no effect) and nano beads (inhibition effect) into BY-2 cells, probably due to the different properties between nanomaterials.33
The FCNPs were absorbed by the A549 mammalian cells and BY-2 plant cells via different endocytosis pathways. When FCNPs attach on the exterior cell membrane, FCNPs-cell dynamic interactions and a series of endocytosis processes are triggered immediately. The endocytosis processes include membrane invaginating and then wrapping of FCNPs. In general, the endocytosis pathways of nanoparticles or macromolecules may be various routes, depending upon their physicochemical properties (size, shapes and surface charge, etc.). Moreover, the charge properties on the particles are also related to adhesion forces with cell membrane. As previously reported, cellular uptake of nanoparticles also depends on ligand-receptor binding which could be inhibited by chemicals. In addition, the dose of each inhibitor chosen must be taken into account after considering the previous studies performed by different research groups. Although some inhibitors induced cell damage under the experimental conditions, the results proved that several endocytic pathways are involved in FCNPs uptake, depending on the membrane of cell type and effects of the inhibitors on the cells. Understanding various endocytic processes of inhibitors was helpful to elucidate the mechanism of cellular uptake of FCNPs.
It's necessary to study CNPs characteristics in-depth, such as particle size, external surface chemistry, which is the basis to understand CNPs interaction with cells and any future biological application. In the present work, CNPs are proven are biocompatible in cells, and can be alternatives to semiconductor nanoparticles, such as SiO2 nanoparticles. The pathway of cellular uptake of CNPs will reflect proteins depending on, which might supply some information for a design of substance delivery system. Moreover, the mechanisms of cellular uptake will provide insight into the effect of CNPs on cell function. In addition, these labelling applications indicate that CNPs could also be applied in subcellular targeting. In the future, the CNPs may be used as carrier for delivery medicine target to cells.
4 Conclusions
In summary, we have prepared CNPs through the oxidation of graphite in aqueous solution. TEM observations revealed that the CNPs had spherical morphology with an average size of 30 nm, consistent with the results of DLS analysis. The chemical structures of CNPs were established with graphitic sp2 hybridization carbons and COOH and OH groups on the surface. The CNPs exhibited biocompatibility in two cell lines. Hence, the hydrophilic CNPs can be applied in biological research. The UV-vis absorbance spectra, fluorescence spectra, FT-IR and XPS results indicated the formation of FCNPs. Cellular imaging by confocal microscopy indicated that the FCNPs could enter A549 cells and BY-2 cells. Then, the incorporation of this nanomaterial into A549 and BY-2 cells was evaluated in the presence of inhibitors. The results demonstrated that several processes are involved in the FCNPs uptake, depending on the cell type. The FCNPs mainly entered A549 cells through caveolin-mediated endocytosis and macropinocytosis, and clathrin-dependent endocytosis was also involved in the trafficking of the FCNPs. Meanwhile, clathrin-independent endocytosis was involved in the incorporation of FCNPs in BY-2 cells. These findings help to understand the interactions at the interface between FCNPs and different cell lines, which could bring to focus on their use in various applications in further studies.Conflicts of interest
The authors declare that they have no competing interests.Acknowledgements
The authors gratefully acknowledge the Zhengzhou University Modern Analysis and Computing center for help with utilizing measurement facilities.References
- Q. L. Liu, Y. Y. Zhao, Y. L. Wan, J. P. Zheng and X. J. Zhang, ACS Nano, 2010, 10, 5743–5748 CrossRef PubMed.
- K. H. Park, M. Chhowalla, Z. Iqbal and F. Sesti, J. Biol. Chem., 2003, 278, 50212–50216 CrossRef CAS PubMed.
- M. Ghorbanpour and J. Hadian, Carbon, 2015, 94, 749–759 CrossRef CAS.
- M. V. Khodakovskaya, K. D. Silva, A. S. Biris, E. Dervishi and H. Villagarcia, ACS Nano, 2012, 6, 2128–2135 CrossRef CAS PubMed.
- M. C. Martinez-Ballesta, L. Zapata, N. Chalbi and M. Carvajal, J. Nanobiotechnol., 2016, 14, 1–14 CrossRef PubMed.
- F. Nitze, M. Mazurkiewicz, A. Malolepszy, A. Mikolajczuk, P. Kędzierzawski, C.-W. Tai, G. Hu, K. J. Kurzydłowski, L. Stobinski, A. Borodzinski and T. Wågberg, Electrochim. Acta, 2012, 63, 323–328 CrossRef CAS.
- M. Kucki, L. Diener, N. Bohmer, C. Hirsch, H. F. Krug, V. Palermo and P. Wick, J. Nanobiotechnol., 2017, 15, 46 CrossRef PubMed.
- N. A. Anjum, N. Singh, M. K. Singh, Z. A. Shah, A. C. Duarte, E. Pereira and I. Ahmad, J. Nanopart. Res., 2013, 15, 1–12 Search PubMed.
- H. Liu, T. Ye and C. Mao, Angew. Chem., Int. Ed., 2007, 46, 6473–6475 CrossRef CAS PubMed.
- S. C. Ray, A. Saha, N. R. Jana and R. Sarkar, J. Phys. Chem. C, 2009, 113, 18546–18551 CrossRef CAS.
- L. Zhou, K. Dong, Z. Chen, J. Ren and X. Qu, Carbon, 2015, 82, 479–488 CrossRef CAS.
- V. Sharma, A. K. Saini and S. M. Mobin, J. Mater. Chem. B, 2016, 4, 2466–2476 RSC.
- S. K. Bhunia, A. Saha, A. R. Maity, S. C. Ray and N. R. Jana, Sci. Rep., 2013, 3, 1473 CrossRef PubMed.
- T. Wang, M. Zou, H. Jiang, Z. Ji, P. Gao and G. Cheng, Eur. J. Pharm. Sci., 2011, 44, 653–659 CrossRef CAS PubMed.
- H. Ali, S. K. Bhunia, C. Dalal and N. R. Jana, ACS Appl. Mater. Interfaces, 2016, 8, 9305–9313 CrossRef CAS PubMed.
- M. Lan, J. Zhang, Y. S. Chui, P. Wang, X. Chen, C. S. Lee, H. L. Kwong and W. Zhang, ACS Appl. Mater. Interfaces, 2014, 6, 21270–21278 CrossRef CAS PubMed.
- M. Lan, J. Zhang, Y.-S. Chui, H. Wang, Q. Yang, X. Zhu, H. Wei, W. Liu, J. Ge, P. Wang, X. Chen, C.-S. Lee and W. Zhang, J. Mater. Chem. B, 2015, 3, 127–134 RSC.
- Z. Yuan, Z. Zhang, X. Wang, L. Li, K. Cai and H. Han, Nanoscale, 2017, 9, 9921–9937 RSC.
- A. L. Cui, G. X. Feng, Y. F. Zhao, H. Z. Kou, H. Li, G. H. Zhu, H. S. Hwang, H. C. Oh, Y. J. Kwon and D. C. Lee, Electrochem. Commun., 2009, 11, 409–412 CrossRef CAS.
- H. Yue, W. Wei, Z. Yue, B. Wang, N. Luo, Y. Gao, D. Ma, G. Ma and Z. Su, Biomaterials, 2012, 33, 4013–4021 CrossRef CAS PubMed.
- E. M. Luther, C. Petters, F. Bulcke, A. Kaltz, K. Thiel, U. Bickmeyer and R. Dringen, Acta Biomater., 2013, 9, 8454–8465 CrossRef CAS PubMed.
- R. Chen, T. A. Ratnikova, M. B. Stone, S. Lin, M. Lard, G. Huang, J. S. Hudson and P. C. Ke, Small, 2010, 6, 612–617 CrossRef CAS PubMed.
- Y. Han, X. Li, H. Chen, X. Hu, Y. Luo, T. Wang, Z. Wang, Q. Li, C. Fan, J. Shi, L. Wang, Y. Zhao, C. Wu and N. Chen, ACS Appl. Mater. Interfaces, 2017, 9, 21200–21208 CrossRef CAS PubMed.
- J. Linares, M. C. Matesanz, M. Vila, M. J. Feito, G. Goncalves, M. Vallet-Regi, P. A. Marques and M. T. Portoles, ACS Appl. Mater. Interfaces, 2014, 6, 13697–13706 CrossRef CAS PubMed.
- D. A. Kuhn, D. Vanhecke, B. Michen, F. Blank, P. Gehr, A. Petri-Fink and B. Rothen-Rutishauser, Beilstein J. Nanotechnol., 2014, 5, 1625–1636 CrossRef PubMed.
- G. M. Mortimer, K. S. Jack, A. W. Musumeci, D. J. Martin and R. F. Minchin, Mater. Sci. Eng., C, 2016, 61, 674–680 CrossRef CAS PubMed.
- Q. M. Kainz, A. Schätz, A. Zöpfl, W. J. Stark and O. Reiser, Chem. Mater., 2011, 23, 3606–3613 CrossRef CAS.
- B. Liao, P. Long, B. He, S. Yi, Q. Liu and R. Wang, Carbon, 2014, 73, 155–162 CrossRef CAS.
- C. Ma, X. Zhang, L. Yang, Y. Wu, H. Liu, X. Zhang and Y. Wei, Mater. Sci. Eng., C, 2016, 68, 37–42 CrossRef CAS PubMed.
- R. Muilu-Mäkelä, J. Vuosku, L. Hamberg, H. Latva-Mäenpää, H. Häggman and T. Sarjala, Plant Cell, Tissue Organ Cult., 2015, 122, 709–726 CrossRef.
- Q. Dou, N. M. Idris and Y. Zhang, Biomaterials, 2013, 34, 1722–1731 CrossRef CAS PubMed.
- M. Swierczewska, K. Y. Choi, E. L. Mertz, X. Huang, F. Zhang, L. Zhu, H. Y. Yoon, J. H. Park, A. Bhirde, S. Lee and X. Chen, Nano Lett., 2012, 12, 3613–3620 CrossRef CAS PubMed.
- V. Bandmann, J. D. Müller, T. Köhler and U. Homann, FEBS Lett., 2012, 586, 3626–3632 CrossRef CAS PubMed.
- V. Belli, D. Guarnieri, M. Biondi, F. Della Sala and P. A. Netti, Colloids Surf., B, 2017, 149, 7–15 CrossRef CAS PubMed.
- A. R. MacIntosh, K. J. Harris and G. R. Goward, Chem. Mater., 2015, 28, 360–367 CrossRef.
- A. Marchetti, J. Chen, Z. Pang, S. Li, D. Ling, F. Deng and X. Kong, Adv. Mater., 2017, 29, 1605895 CrossRef PubMed.
- I. A. Vacchi, C. Spinato, J. Raya, A. Bianco and C. Menard-Moyon, Nanoscale, 2016, 8, 13714–13721 RSC.
- W. Gao, L. B. Alemany, L. Ci and P. M. Ajayan, Nat. Chem., 2009, 1, 403–408 CrossRef CAS PubMed.
- B. Gurzęda, T. Buchwald, M. Nocuń, A. Bąkowicz and P. Krawczyk, RSC Adv., 2017, 7, 19904–19911 RSC.
- J. L. Li, K. N. Kudin, M. J. McAllister, R. K. Prud'homme, I. A. Aksay and R. Car, Phys. Rev. Lett., 2006, 96, 176101 CrossRef PubMed.
- K. Liu, M. Ostadhassan, J. Zhou, T. Gentzis and R. Rezaee, Fuel, 2017, 209, 567–578 CrossRef CAS.
- Y. M. Shulga, S. A. Baskakov, E. I. Knerelman, G. I. Davidova, E. R. Badamshina, N. Y. Shulga, E. A. Skryleva, A. L. Agapov, D. N. Voylov, A. P. Sokolov and V. M. Martynenko, RSC Adv., 2014, 4, 587–592 RSC.
- W. J. Wang, X. Hai, Q. X. Mao, M. L. Chen and J. H. Wang, ACS Appl. Mater. Interfaces, 2015, 7, 16609–16616 CrossRef CAS PubMed.
- H. Herd, N. Daum, A. T. Jones, H. Huwer and H. Ghandehari, ACS Nano, 2013, 7, 1961–1973 CrossRef CAS PubMed.
- C. Orellana-Tavra, S. A. Mercado and D. Fairen-Jimenez, Adv. Healthcare Mater., 2016, 5, 2261–2270 CrossRef CAS PubMed.
- Q. Cui, Y. Hou, Y. Wang, X. Li, Y. Liu, X. Ma, Z. Wang, W. Wang, J. Tao, Q. Wang, M. Jiang, D. Chen, X. Feng and G. Bai, J. Nanobiotechnol., 2017, 15, 27 CrossRef PubMed.
- S. Sinha, K. Kosaraju and S. Aravamudhan, J. Nano Res., 2015, 34, 41–47 CAS.
- J. O. Agola, P. A. Jim, H. H. Ward, S. Basuray and A. Wandinger-Ness, Clin. Genet., 2011, 80, 305–318 CrossRef CAS PubMed.
- F. Guo, N. Ma, Y. Horibe, S. Kawanishi, M. Murata and Y. Hiraku, Toxicol. Appl. Pharmacol., 2012, 260, 183–192 CrossRef CAS PubMed.
- W. Sun, N. Fang, B. G. Trewyn, M. Tsunoda, I. I. Slowing, V. S. Lin and E. S. Yeung, Anal. Bioanal. Chem., 2008, 391, 2119–2125 CrossRef CAS PubMed.
Footnote |
| † Electronic supplementary information (ESI) available. See DOI: 10.1039/c8ra06665e |
| This journal is © The Royal Society of Chemistry 2018 |

