 Open Access Article
Investigation of dynamical properties of methane in slit-like quartz pores using molecular simulation
Lilong Yang a,
Xiang Zhou
 a,
Kewei Zhangb,
Fanhua Zeng
 *a and
Zhouhua Wangc
aPetroleum Systems Engineering, Faculty of Engineering and Applied Science, University of Regina, Regina, Saskatchewan S4S 0A2, Canada. E-mail: fanhua.zeng@uregina.ca; Fax: +1-306-585-4855; Tel: +1-306-337-2526
bGuangzhou Marine Geological Survey, Guangzhou, Guangdong 510075, China
cState Key Laboratory of Oil and Gas Reservoir Geology and Exploitation, Southwest Petroleum University, Chengdu, Sichuan 610500, PR China
First published on 2nd October 2018
Abstract
The dynamical properties of adsorption media confined in micropores play an important role in the adsorptive separation of fluids. However, a problem is that it is difficult to directly use approaches based on experimental measurements. Molecular simulation has been an effective tool for investigating the diffusion of fluids on the microscale in recent years. In this work, the diffusion properties of methane in quartz were mainly investigated from a microscale viewpoint using MD (molecular dynamics) methods, and this paper primarily discusses the influence of parameters such as pressure, temperature, pore size and water content on the diffusion and thermodynamic parameters of methane in slit-like quartz pores. The results demonstrate that the transport ability of quartz pores decreases with an increase in pressure in pores of a fixed size at a certain temperature and increases with an increase in pore size or temperature at a fixed pressure, which is related to changes in the interaction between methane molecules and quartz. In the pressure range used in the simulation, the average isosteric heat of adsorption of methane increases with an increase in pressure and is in the range of 6.52–10.794 kJ mol−1. Therefore, the gas adsorption behavior is classed as physical adsorption because the heat of adsorption is significantly lower than the minimum heat of gas adsorption for chemisorption. The increase in the total adsorption entropy is caused by an increase in temperature due to an increase in internal energy, which brings about a reduction in the interactions between gas molecules and walls of quartz. However, with an increase in pore size the total adsorption entropy increases, for which an explanation may be that in pores of a larger size methane molecules are adsorbed at higher-energy sites and generate a higher isosteric heat, which causes a reduction in interactions between the adsorbate and adsorbent. Regarding the influence of different water contents on the diffusion of methane, it was demonstrated that with an increase in moisture the mobility of methane molecules initially increases and then decreases, which is related to the distance between gas molecules.
1 Introduction
In 2017, the EIA (US Energy Information Administration) reported that the world's consumption of natural gas, consisting primarily of methane, will increase by 43% from 2015 to 2040, because natural gas has become an attractive fuel for the electric power and industrial sectors in both OECD (Organization for Economic Co-operation and Development) and non-OECD countries. In the US, China, and Canada, tight oil resources and shale resources play an important role in natural gas supplies. As of 2015, shale gas accounted for 50% of the US natural gas production. According to data analysis by the US Energy Information Administration, shale gas in the US is expected to account for 70% of the US natural gas production in 2040, and shale resource developments in China are expected to account for nearly 50% of domestic natural gas production by 2040 to meet the demand for natural gas consumption.1 Thus, shale gas will be one of the most important sources of energy in the near future. As we know, shale gas reservoirs mainly contain free gas, dissolved gas, and adsorbed gas. Curtis (2002) stated that the maximum amount of adsorbed gas is up to 85% in American shale reservoirs.2 Therefore, it is essential for researchers to study the adsorption characteristics of methane to find advanced recovery techniques for the improvement of shale and tight oil resources to meet the growing demand for energy.In order to more accurately determine the petrophysical properties of rock samples from shale gas reservoirs, X-ray diffraction (XRD) is used to analyze the rock mineralogy for the evaluation of shale. It was found that there was an abundant amount of quartz minerals in some shale samples.3 Yingjie et al. (2015) conducted geochemical tests to investigate the effects of composition on the capacity of the gas reservoir in the Qaidam Basin, China, and suggested that the quartz content of the shale is up to 87%.4 An investigation of the pore structure and fracture characteristics of the organic-rich Yanchang Formation shale in the Ordos Basin demonstrated that the quartz content of the shale ranged from 17.10% to 72.33% and represented the main component of the shale.5 Some researchers (Ross and Marc Bustin) investigated the shale composition of Western Canadian shale gas reservoirs from different geologic periods and suggested that the average content of quartz mineral phases is over 44%.6 Therefore, it is meaningful for researchers to observe the characteristics of the gas adsorption capacity of quartz in shale gas reservoirs. Recently, some scholars have applied experimental and theoretical methods to study the adsorption behavior of methane in nanoporous pure quartz. Xiong et al. (2017) observed the influence of different pore sizes on the methane adsorption capacity of quartz pores using experimental methods.7 Ji et al. (2013) and Liang et al. (2016) observed the impact of environmental factors that included temperature and pressure on the adsorption behavior of CH4 in quartz.8,9 Xiong et al. (2016) used molecular simulation to investigate the impact of environmental factors on the CH4 adsorption ability of quartz pores on the microscale.10 However, most researchers did not study in greater depth to investigate the dynamical properties that reflect the internal features of microscopic systems in quartz pores.
An observation of the impact of different factors on the dynamical properties of adsorption media could provide a fundamental understanding of the internal behavior of fluids in adsorbents for researchers. Cracknell et al. (1995) investigated transport diffusivity in slit-shaped pores of different sizes using a computerized molecular dynamics (MD) method, which showed that the self-diffusion of methane was a function of its concentration for different pore sizes.11 Titiloye and Skipper (2001) studied the distribution and mobility of methane particles in the interlayers of a sodium montmorillonite clay hydrate using a molecular simulation, which suggested that interlayer mobility has a strong relationship with moisture and burial depth.12 Cao and Wu (2004) studied the influences of different temperatures and pressures under subcritical and supercritical conditions on the behavior of the diffusion coefficient of methane in single-walled carbon nanotubes (SWNTs) by combining GCMC (grand canonical Monte Carlo) and ideal MD methods, which suggested that kinetic energy and intermolecular interactions play a critical part in the mobility of methane molecules below a supercritical temperature.13 Yang and Zhang (2005) investigated the structure and diffusion behaviour of CO2 in different clay-like slit pores via a classical MD method, which demonstrated the distribution of the inner molecular layer and the relationship of the diffusion coefficient of CO2 with various slit pores.14 Fathi and Akkutlu (2009) studied the influence of surface diffusion on the macroscale transport of gas in a low-permeability formation and found that surface diffusion is an important factor that affects the eventual recovery of gas.15 Bhatia and Nicholson (2012) observed the influences of different methane densities on the dynamical behavior of methane in silica nanopores at different pore sizes and temperatures using an MD simulation method.16 Li et al. (2013) investigated the density profile and divergent behavior of an RTIL (room-temperature ionic liquid) close to the surface of silica and carbon using a molecular simulation, which revealed the interfacial potential profile and the confinement of temperature-dependent diffusion within silica or carbon pores.17 Sharma, Namsani, and Singh (2015) studied the influences of different pore sizes and pressures on the dynamical behavior of ethane and methane in montmorillonite nanopores and suggested that the diffusion coefficient of methane is lower than that of ethane at a lower pressure.18 Huang et al. (2014) and Sui and Yao (2016) observed the influences of pressure, slit pore size, temperature, and concentration on the diffusion behavior of different fluids in slit-like pores using a molecular dynamics method.19,20 According to the above review, these studies suggest that it is effective to use molecular simulation methods to study the dynamical properties of a flue gas on an adsorbent. Furthermore, not enough reports provide specific information on dynamical properties on pure minerals.
This study mainly used MD simulations based on equilibrium configurations, which can be determined from a GCMC simulation, to observe the dynamical behavior of a gas in a quartz pore. Firstly, the structures of nanopores were built using a molecular simulation. On the basis of the first step, the dynamical properties in quartz pores were investigated to determine how factors including the pressure, temperature, pore size, and water content affect the diffusion behaviour and thermodynamic parameters in quartz for the purpose of providing a theoretical basis and instructional guidance for enhancing the production of shale gas in shale gas reservoirs.
2 Establishment and validation of the model
2.1 Models
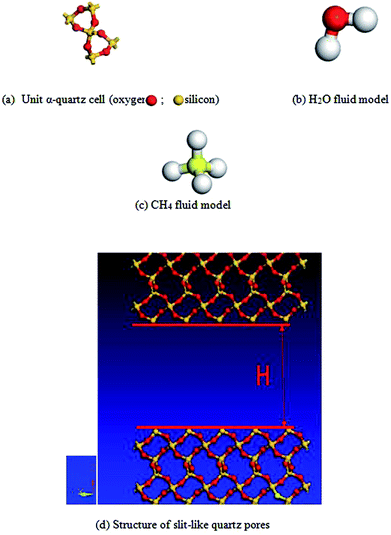
Methane exists mainly in an adsorbed state in micropores in sandstone, and diffusion is an important way to produce gas in micropores. Therefore, it is important to study the microscale mechanism and diffusion of CH4 in slit-like quartz pores. In this paper, using the Materials Studio software package for the structure of the alpha quartz unit cell (4.91 Å e 4.91 Å × 5.402 Å) enabled the construction of an adsorbent structure. In addition, a model of the CH4/H2O fluid was established using the Materials Studio (MS) software package. A simulation of the quartz unit cell was set up in a square box with cyclicity in the x and y directions on the basis of the unit cell of quartz crystals. The quartz model comprised a 6a × 5b × 5z supercell structure in the x, y, and z directions. Therefore, the range of the model of the quartz supercell structure can be determined (x = 2.946 nm, y = 2.455 nm and z = 2.521 nm), and S, which is the area of the crystal surface in the porous structure, is 6.261 × 10⁻¹⁸ m2. In order to calculate the different pore diameters of quartz in the model of the supercell structure, a void was added in the z direction according to the simulation unit cell. The pore height (H) was determined by simulating a vacuum, and we used different lengths in combination with H to obtain different pore sizes (such as 1 nm, 2 nm, 2.5 nm, 4 nm, and 6 nm). Different schematic representations of the vacuum and fluid models are presented in Fig. 1.2.2 Calculation method and scheme design
In this simulation, we used the Condensed-Phase Optimized Molecular Potential for Atomistic Simulation Studies (COMPASS) field, which was mentioned by previous researchers.21,22 This force field includes a covalent-bond model, an ion model, a quasi-ion model, and a metal model that can describe different molecular systems. The covalent-bond model is applicable to all organic molecules and inorganic covalently bonded molecular systems, including small molecules and macromolecules. The force field is the same as those used in CFF-type force fields. The function forms consist of two parts: (a) valence terms and (b) non-bonding interactions. The valence terms include diagonal and off-diagonal cross-coupling terms that involve the bond stretching energy Eb, bond angle bending energy Eθ, bond torsion energy Eφ, bond out-of-plane angle bending energy Eχ and cross-coupling terms energy Ecross:| Ebond = Eb + Eθ + Eφ + Eχ + Ecross | (1) |
 | (2) |
 | (3) |
 | (4) |
 | (5) |
 | (6) |
For non-bonding interactions, the van der Waals (vdW) term energy Eij was included, which comprises the Lennard-Jones 9-6 function23 and the electrostatic interaction energy Eelec:
 | (7) |
 | (8) |
For similar atom pairs, the Lennard-Jones 9-6 parameters are given, whereas for dissimilar atom pairs, a 6th order combination law is used to determine the values of the off-diagonal parameters:24
 | (9) |
 | (10) |
In the COMPASS field, partial atomic charges are used to represent electrostatic interactions. In the force field, the bond increment δij is used to represent the charge separation between two valence-bonded atoms, and i and j are used as atomic parameters. For atom i, the partial charge is the sum of all charge bond increments δij:24
 | (11) |
In the simulation, MD methods based on the GCMC method were used. The GCMC method was employed to fill the pores with methane molecules and was launched using the sorption module in the MS software package. In this work, it is worth mentioning that the grand canonical ensemble refers to the chemical potential of the system in the process of the simulation. In the process of a GCMC simulation, the acceptance probability of three kinds of particles in the system is a function of the chemical potential. The relationship between the chemical potential and the fugacity is as follows:25
 | (12) |
To study the different factors that influence the transport properties and density profiles of methane molecules in slit-like pores, a molecular dynamics method needed to be employed in this work. In the MD simulations, the simulated pressure was up to 30 MPa, and each simulation used a certain pressure value corresponding to a temperature value, which was carried out using the Forcite module in the MS software package. In the MD simulations, the COMPASS force field was used. The simulation used the Ewald&Group method to calculate the coulombic force interactions, and the van der Waals forces were calculated by an atomic-interaction-based method. Each MD simulation was carried out using an NVT ensemble (the atom number N, volume V, and temperature T stay the same in the system) with a dynamic time of 1 ns and a time step of 1 ns, which included a structural equilibration time of 100 ps and a calculation time of 900 ps for methane molecules. The Andersen thermostat was used to control the temperature. Finally, a molecular equilibrium configuration that was built up at intervals of 100 steps in each simulation process was obtained to calculate the dynamical behavior of methane and study the density distributions of methane.
In order to study the dynamical properties of methane molecules, this work mainly chose various factors, which included pressure, temperature, pore size, and water saturation, to study the transport ability and thermodynamic parameters of gas molecules in slit-like quartz pores. The simulation program included: (1) using different pressures, including 5 MPa, 9 MPa, 13 MPa, 17 MPa, 21 MPa, and 30 MPa, to investigate the diffusion and heat of adsorption in slit-like quartz pores; (2) choosing different temperatures, including 30 °C, 60 °C, 90 °C, 100 °C, and 120 °C, to study the diffusion and adsorption entropy in pores; (3) choosing different pore sizes (1 nm, 2 nm, 3 nm, 4 nm, 6 nm, and 8 nm) at different pressures to simulate the adsorption entropy and diffusion of methane; and (4) using different water contents of 2%, 4%, 8% and 16% at various pressures to study the diffusion and average heat of adsorption of methane.
2.3 Model validation
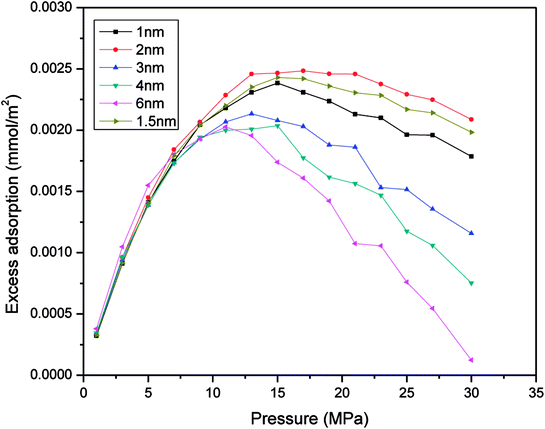
To prove the feasibility of the molecular simulation method of studying gas adsorption in nanometre pores, this work chose different pore sizes, including 1 nm, 2 nm, 3 nm, 4 nm, and 6 nm, to determine the adsorption capacity for excess methane at 60 °C in each simulation. Then, the conclusions were used for a comparison with an earlier study on organic and inorganic shale. Because the simulation temperature is above the critical temperature of the gas, the adsorption behaviour of the gas on quartz comprises supercritical adsorption. Therefore, Gibbs suggested a formula for the excess amount adsorbed via supercritical adsorption. The relevant equation27 is as follows:| Mex = mab − ρgVad | (13) |
| Mex = N − ρgVp/MS | (14) |
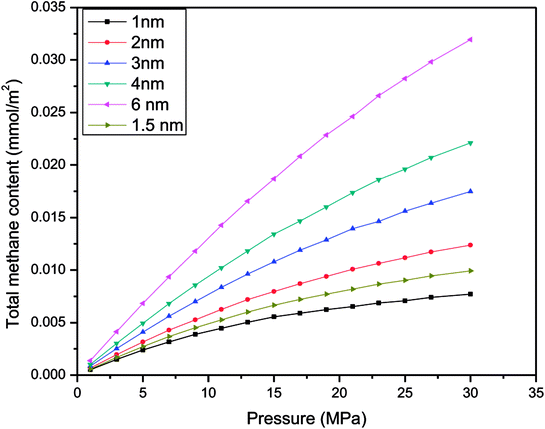 | ||
| Fig. 2 Relationship between the excess adsorbed amount of CH4 and the pressure for various sizes of slit-like pores. | ||
| Pore size (H)/nm | Pmax/MPa (this work) |
|---|---|
| 1 | 15 |
| 1.5 | 17 |
| 2 | 17 |
| 3 | 13 |
| 4 | 15 |
| 6 | 11 |
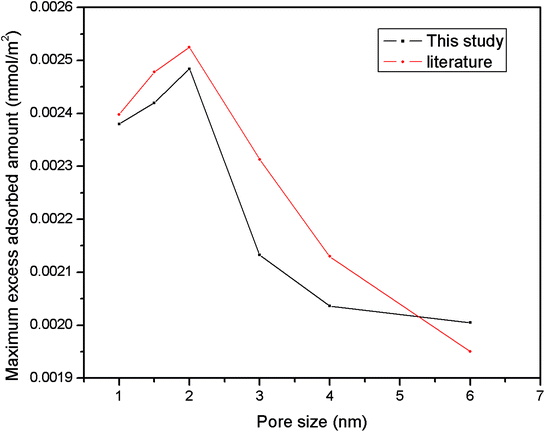 | ||
| Fig. 4 Comparison of the maximum excess adsorbed amount in this work with literature results from previous papers.10,32 | ||
3 Results and discussion
3.1 Variation in energy of the methane adsorption system in quartz
Fig. 5 illustrates the relationship between the energy of the methane adsorption system and different pressures in slit-like quartz pores. In each simulation, we found that the valence terms do not make a contribution to the adsorption of methane in quartz. However, the total energy of the adsorption system is contributed by non-bonding interactions. In addition, we obtained the result that the van der Waals (vdW) term energy plays an important role in supplying the total energy to the adsorption system, and the electrostatic interaction energy is zero in non-bonding interactions. In other words, the electrostatic interaction energy does not make a contribution during the process of adsorption in each simulation, but the van der Waals (vdW) term energy makes a major contribution to the main energy in the adsorption system. Moreover, that contribution does not depend on the pressure and pore size, which indicates that the process of methane adsorption comprises a physical adsorption process in each simulation. When physical adsorption processes occur in an adsorption system, the system releases heat. Consequently, the energy of the system will decrease. From Fig. 5, we can draw the conclusion that the energy of the system will decrease as the pressure increases. Furthermore, the total energy of the adsorption system has no relationship with an increase in pore size.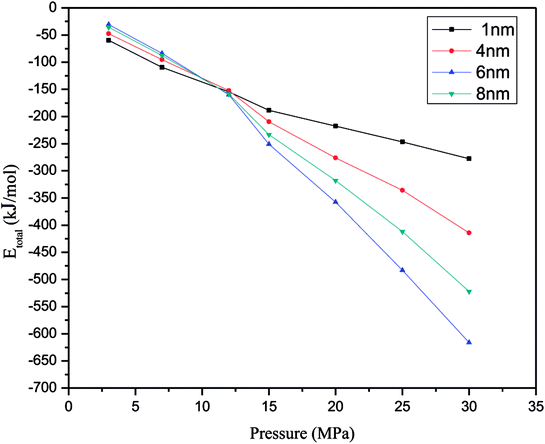 | ||
| Fig. 5 Change in Etotal of the adsorption system at various pressures (Etotal represents the total energy in the system). | ||
3.2 Properties of methane in a slit pore
 | (15) |
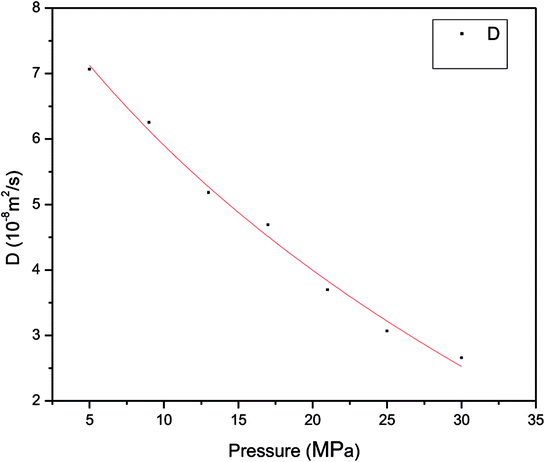 | ||
| Fig. 6 Relationship between diffusion coefficient of methane and pressure in pores with a size of 1 nm at 60 °C. | ||
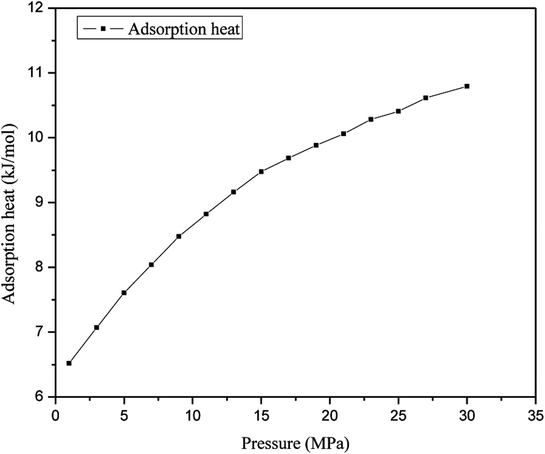
The heat of adsorption is an important thermodynamic parameter for the adsorption of gas molecules on an adsorbent.35 The heat of adsorption of methane in nanopores at different pressures is illustrated in Fig. 7, which shows that the heat of adsorption of the gas increases with an increase in pressure. In this simulation, the heat of adsorption of methane has a minimum value of 6.52 kJ mol−1, which corresponds to a pressure of 1 MPa, in contrast with the maximum heat of adsorption of methane, which corresponds to a pressure of 30 MPa and is 10.794 kJ mol−1; hence, the gas adsorption behavior is classed as physical adsorption because the heat of adsorption is significantly lower than the minimum heat of gas adsorption for chemisorption. The heat of adsorption of methane at a low pressure is much lower than that of methane at a higher pressure, which indicates that the interaction between methane and quartz is weaker at a lower pressure. The heat of adsorption increases as the pressure increases, for the reason that at a lower pressure a sufficient number of high-energy adsorption sites could support the adsorption of gas molecules on the surface of quartz and produce heat of adsorption, which suggests that this can provide energy to facilitate the molecular motion of methane. However, as the pressure increases more methane molecules are adsorbed and the high-energy adsorption sites are occupied, and the heat of adsorption generated on quartz decreases. The above findings are in accordance with a previous work, which stated that methane gas is first adsorbed at higher-energy positions and is then adsorbed at lower-energy positions with an increase in pressure.32 Moreover, the interaction forces between methane and quartz increase at a higher pressure, which will constrain the mobility of methane molecules. Therefore, the increase in the adsorption enthalpy is a vital factor when the slit-like pores are filled by methane molecules at a higher pressure.
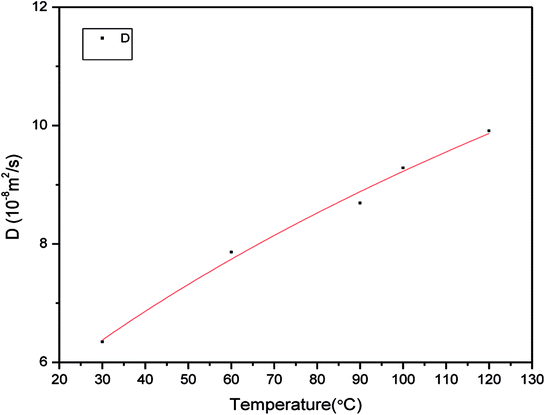 | ||
| Fig. 8 Relationship between self-diffusion coefficient of methane and temperature in pores with a size of 3 nm at 21 MPa. | ||
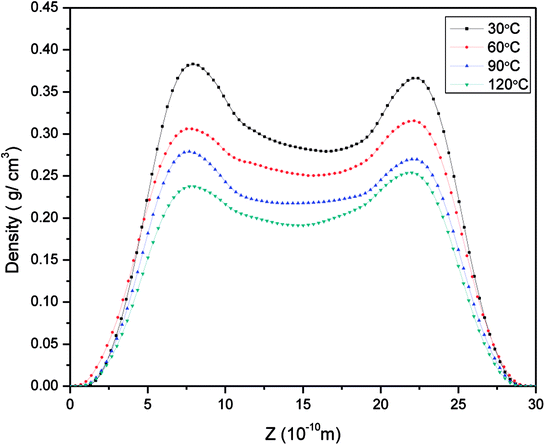 | ||
| Fig. 9 Density distribution of methane in pores with a size of 3 nm at 21 MPa at different temperatures. | ||
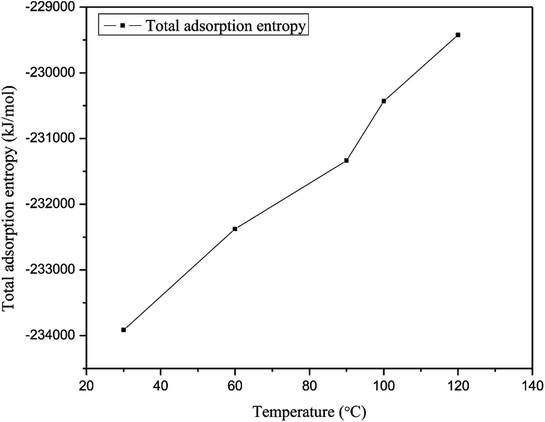
The adsorption entropy is also an important thermodynamic parameter for the adsorption of gas molecules because it reveals restrictions on the motion of adsorbed gas molecules.39 The adsorption entropy of methane was determined to demonstrate the interaction between methane and quartz. Fig. 10 illustrates the curve for the adsorption entropy on slit-like quartz as a function of different temperatures. In this simulation, the adsorption entropy for the adsorption of methane has a minimum value of −2.34 × 10⁵ kJ mol−1, which corresponds to a temperature of 30 °C, whereas the maximum adsorption entropy of methane, which corresponds to a temperature of 120 °C, is −2.29 × 10⁵ kJ mol−1. The total adsorption entropy of methane at a high temperature is significantly greater than that of methane at a low temperature, which indicates that the interaction between methane and quartz is weak at a high temperature. The total adsorption entropy increases as the temperature increases, the explanation for which may be that as the temperature increases the motion of gas molecules is more prominent and there is an increase in internal energy because of the increases in potential energy and kinetic energy. Hence, the total increase in entropy with an increase in temperature results in an increase in the mobility of the gas that is due to the reduction in interactions between methane molecules and quartz.
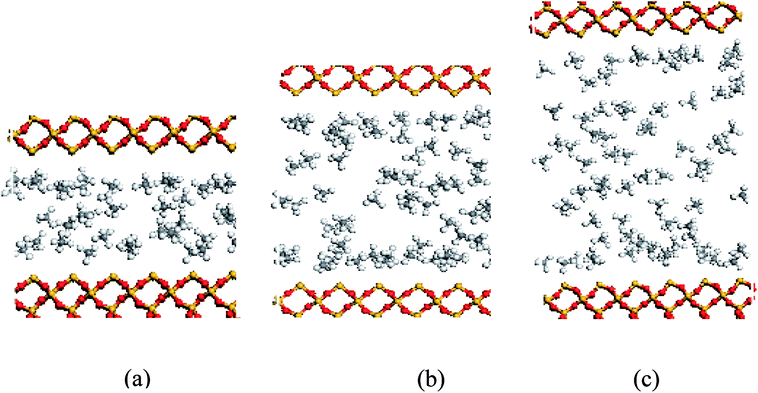 | ||
| Fig. 12 Snapshots of methane molecules obtained for a pore size of (a) 10 Å, (b) 20 Å, and (c) 30 Å. | ||
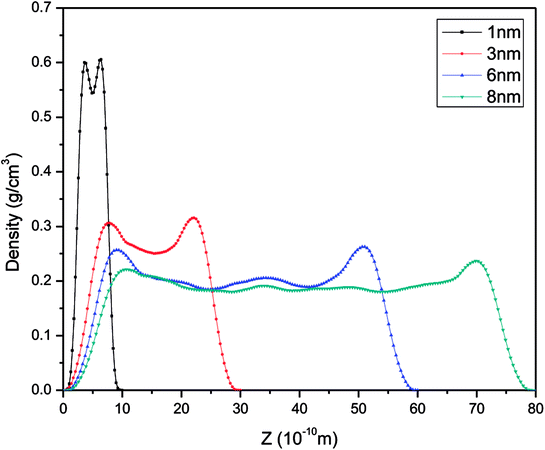
In order to study further the mobility of methane molecules in nanopores, we investigated the density distributions of methane at a bulk pressure of 21 MPa for various pore sizes, as can be seen in Fig. 13. First of all, we obtained the result that the density at the pore centre is notably low for different pore sizes and remains almost constant for larger pore sizes. The constant density occurs because in this location methane molecules can be freely transported and the impact of the surface can be ignored. In addition, we can see a decrease in the density of the contact layer with an increase in pore size, which is in accordance with the molecular configuration of methane displayed in Fig. 12. Methane molecules accumulate close to the pore walls and form a molecular layer because of the interaction forces between the molecules and the pore surface. In addition, we determined that the density distribution of methane decreases with an increase in pore size. These findings are in agreement with those of preceding investigations on gas adsorption in inorganic nanopores18 and sodium montmorillonite clay hydrates.12 Xiong et al. demonstrated that a monolayer forms in micropores and a multilayer forms in macropores by using molecular simulations.10 However, this study shows that the monolayer that forms has no relationship with the pore size in this simulation. These results are different from the results of previous works, but both of these also have certain similarities, which may be due to the use of different study methods.
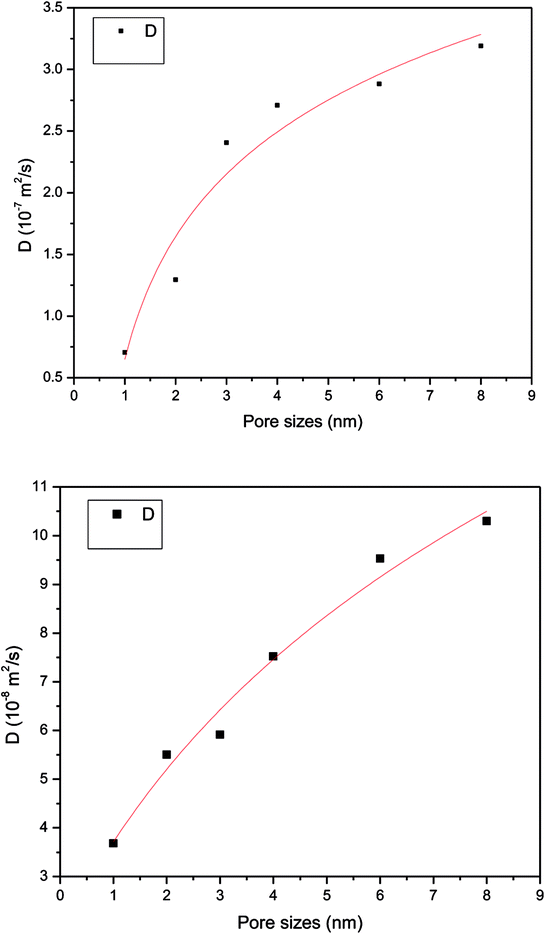
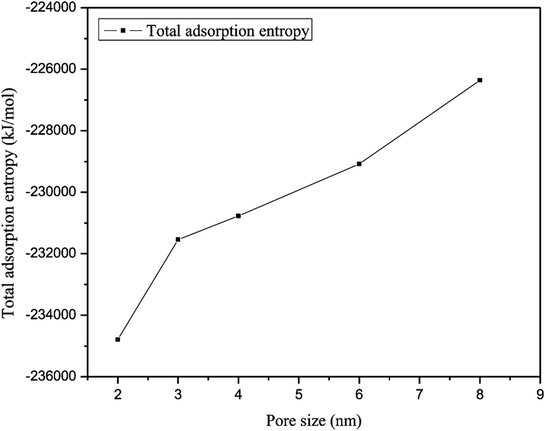
The total adsorption entropy of methane in slit-like quartz as a function of various pore sizes at the same pressure is illustrated in Fig. 14, which shows that an increase in the adsorption entropy of methane is caused by an increase in pore size. As shown in Fig. 14, the total adsorption entropy of CH4 has a minimum value of −2.35 × 10⁵ kJ mol−1, which corresponds to a nanopore size of 2 nm, whereas the maximum adsorption entropy of methane, which corresponds to a nanopore size of 8 nm, is −2.263 × 10⁵ kJ mol−1. The total adsorption entropy of methane in small pores is significantly lower than that of methane in large pores, which suggests that the interaction between CH4 molecules and the surface of quartz is strong in large pores. Xiong et al. (2006) observed the influence of different pore sizes on the potential energy distribution in quartz and found that gas molecules could be adsorbed at lower-energy positions in micropores; when the pores are macropores, gas molecules could mainly be adsorbed at higher-energy positions and the isosteric heat is higher, which suggests that smaller pores exhibit stronger interactions between methane molecules and quartz.10 Therefore, the increase in the total adsorption entropy results in a reduction in interactions between the adsorbent and adsorbate, and hence the motion of gas molecules increases with an increase in pore size.
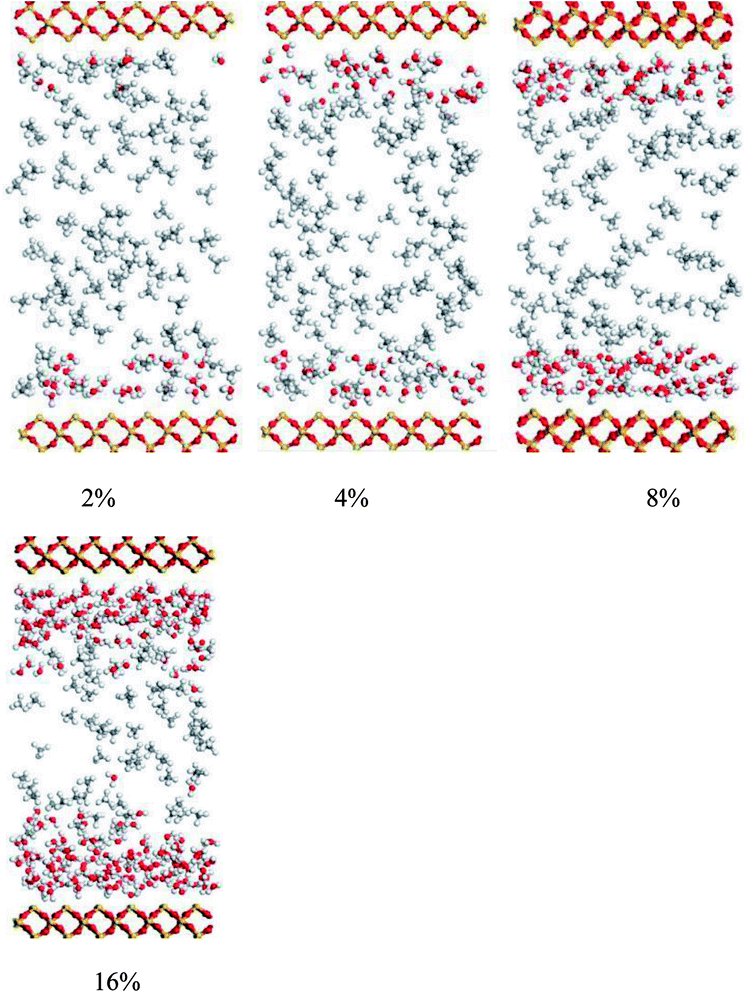
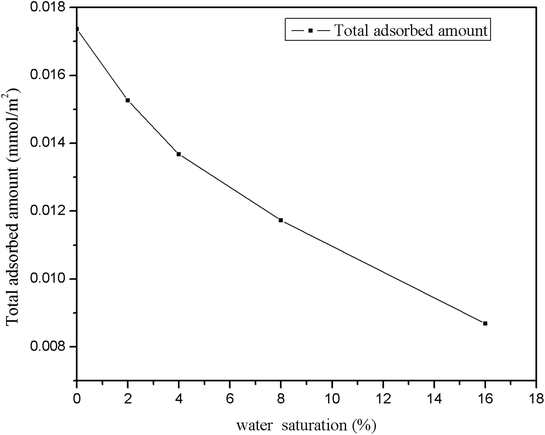
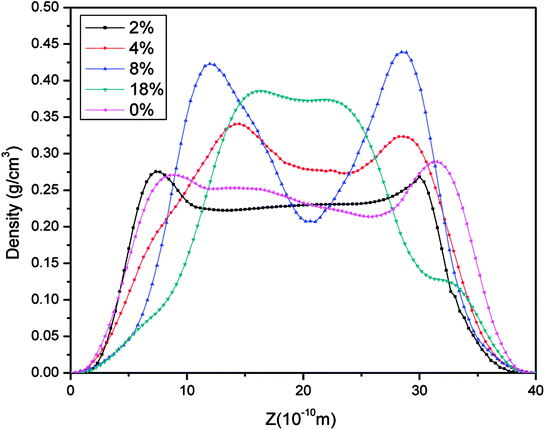
The density distributions of methane with different water saturations in pores are displayed in Fig. 17. This shows that the density distribution has a close relationship with the water content. Firstly, the figure shows that the density profiles are almost symmetric about the pore center for different water contents. Secondly, it shows that the density distribution of the gas with a low water content is similar to the density profile without moisture, which indicates that slight water saturation in the pores has a weak influence on the gas distribution. However, with an increase in the water content the area available for the motion of gas molecules in nanopores decreases and the water molecules occupy the surfaces of pores, which leads to an increase in the distance between wall surfaces and gas molecules, as can be seen in Fig. 15, and hence most gas molecules accumulate on the surface of water molecules. In addition, we observe that the density of methane close to the surface of water increases with an increase in the water content. This may be explained by the fact that the speed of accumulation of methane on the surface close to water molecules is higher than that of the dispersion of gas molecules. When the water molecules occupy more space in nanopores, the area available for the motion of gas molecules becomes narrower, which results in an increase in the interaction force between gas molecules. Thus, it can be observed in Fig. 17 that methane becomes tightly packed at a higher water saturation. In summary, the methane density distribution has a close relationship with the moisture content.
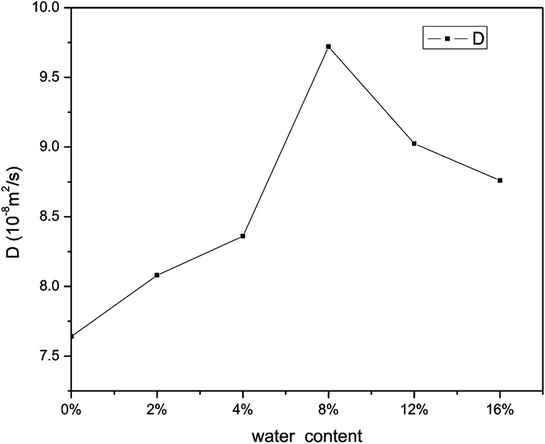
Fig. 18 shows the effect on the diffusion coefficient of methane of different water contents. As can be seen, the diffusion coefficient of methane increases and then decreases with an increase in water saturation. From this figure, it is found that an increase in the water content leads to an increase in the diffusion coefficient of methane when the water content is in the range from 0 to 8 wt%. This is mainly because the surface of the quartz is surrounded by water molecules and the space available for the adsorption of methane decreases with an increase in the number of water molecules. Consequently, the interaction force between the pore walls and methane decreases, which results in an increase in the mobility of methane. This finding is similar to that of a previous report12 on hydrated sodium montmorillonite clays. When the water saturation exceeds 8 wt%, the diffusion coefficient of methane displays a decreasing trend. This may be explained by the fact that the water molecules occupy more space in the limited quartz pores with an increase in the water content, and the space available for the motion of methane molecules decreases, which suggests that the distances between methane molecules decrease. As a result, the interaction force between methane molecules makes a great contribution, as the diffusion ability decreases owing to the increase in the interaction force between methane molecules. In summary, the diffusion of methane has a close relationship with the water content.
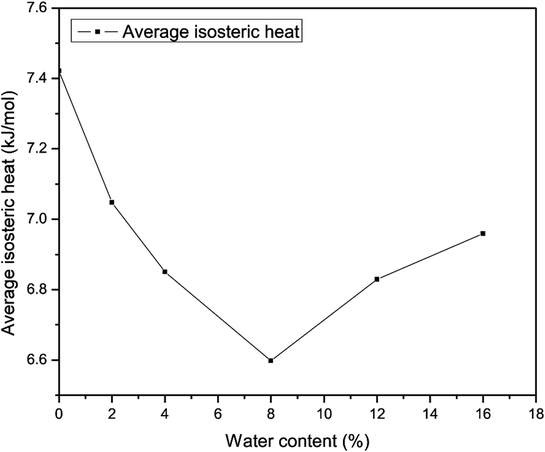
The average heat of adsorption of methane was investigated to determine the interaction between CH4 molecules and quartz. Fig. 19 presents the average heat of adsorption of methane for different water contents. It demonstrates that the average isosteric heat of adsorption of methane that corresponds to a water content of 8% has a minimum value of 6.6 kJ mol−1, whereas the average heat of adsorption of methane without water reaches a maximum at 7.42 kJ mol−1. In addition, it shows that the average heat of adsorption of methane first decreases and then increases with an increase in the water content. The explanation may be that at a lower water content methane molecules could gradually be adsorbed at high-energy sites and produce heat that accelerates the motion of gas molecules. With an increase in the water content, the water molecules will occupy the surface of quartz, which could prevent methane molecules from being adsorbed at high-energy sites, and the isosteric heat generated will decrease, which causes a reduction in the mobility of gas molecules. As the amount of water molecules increases, the simulation system needs an increase in adsorption enthalpy to ensure that methane molecules fill the slit-like pores.
4 Conclusion
In this study, environmental factors (such as temperature and pressure) were comprehensively considered in terms of their effect on the diffusion of methane and changes in thermodynamic parameters on quartz from a microscale viewpoint. In this study, GCMC and MD methods were used to study the influences of pressure, temperature, and pore size on the dynamical properties of methane in pores of different diameters in quartz. The following conclusions were reached:(a) The process of methane adsorption comprises a physical adsorption process in which the average isosteric heat and total adsorption entropy are less than 42 kJ mol−1 in each adsorption system, and the process of methane absorption is a process that releases heat. Thus, the total energy of the adsorption system exhibits a decreasing trend.
(b) An increase in the pressure causes a reduction in the diffusion coefficient of methane, which is related to a change in the interaction forces between methane and quartz.
(c) The heat of adsorption increases with an increase in pressure, for which the reason may be that CH4 molecules are adsorbed at higher-energy sites and produce isosteric heat at a lower pressure, which increases the mobility of methane molecules. However, the high-energy sites are gradually occupied with an increase in pressure and the heat generated in quartz decreases, which leads to an increase in adsorption enthalpy in the simulation system.
(d) Temperature is a factor that has a positive effect on the diffusion coefficient and changes in entropy, for which the reason may be that an increase in temperature causes increases in the kinetic energy and potential energy of gas molecules, and thus the internal energy increases. Therefore, the adsorption entropy increases with an increase in temperature, which suggests that the reduction in interactions between CH4 molecules and quartz results in an increase in the diffusion coefficient of methane molecules.
(e) With an increase in pore size, methane molecules are gradually adsorbed at higher-energy sites and produce more heat, which results in an increase in the adsorption entropy; moreover, the diffusion ability of methane increases owing to a decrease in interaction forces between quartz and gas molecules.
(f) From microstructural observations, water molecules accumulate on the surface of the quartz wall, which leads to a reduction in the space available for the adsorption of methane, and the methane adsorption capacity is reduced. In addition, the diffusion ability of methane is affected by different water contents, which demonstrates that with an increase in moisture the diffusion coefficient of methane first increases and then decreases, which is related to the distance between gas molecules.
Conflicts of interest
There are no conflicts to declare.References
- EIA, International Energy Outlook 2017 Overview, U.S. Energy Inf. Adm., 2017, vol. IEO2017, no. 2017, p. 143 Search PubMed.
- J. B. Curtis, Fractured shale-gas systems, Am. Assoc. Pet. Geol. Bull., 2002, 86(11), 1921–1938 CAS.
- L. Ji, T. Zhang, K. L. Milliken, J. Qu and X. Zhang, Experimental investigation of main controls to methane adsorption in clay-rich rocks, Appl. Geochem., 2012, 27(12), 2533–2545 CrossRef CAS.
- L. Yingjie, L. Xiaoyuan, W. Yuelong and Y. Qingchun, Effects of composition and pore structure on the reservoir gas capacity of Carboniferous shale from Qaidam Basin, China, Mar. Pet. Geol., 2015, 62, 44–57 CrossRef.
- F. L. X. Liu, F. L. J. Xiong and F. L. L. Liang, Journal of Natural Gas Science and Engineering Investigation of pore structure and fractal characteristics of organic- rich Yanchang formation shale in central China by nitrogen adsorption/desorption analysis, J. Nat. Gas Sci. Eng., 2015, 22(April 2011), 62–72 CrossRef.
- D. J. K. Ross and R. Marc Bustin, The importance of shale composition and pore structure upon gas storage potential of shale gas reservoirs, Mar. Pet. Geol., 2009, 26(6), 916–927 CrossRef CAS.
- J. Xiong, X. Liu, L. Liang and Q. Zeng, Adsorption of methane in organic-rich shale nanopores: An experimental and molecular simulation study, Fuel, 2017, 200, 299–315 CrossRef CAS.
- J. Ji, L. ; Ma, X. ; Xia and Y. ; Qiu, relationship between methane adsorption capacity of clay minerals and micropore volume, Earth Science - Journal of China University of Geosciences, 2014, 37(5), 1043–1050 Search PubMed.
- L. Liang, D. Luo, X. Liu and J. Xiong, Experimental study on the wettability and adsorption characteristics of Longmaxi Formation shale in the Sichuan Basin, China, J. Nat. Gas Sci. Eng., 2016, 33, 1107–1118 CrossRef CAS.
- J. Xiong, K. Liu, X. Liu, L. Liang and Q. Zeng, Molecular simulation of methane adsorption in slit-like quartz pores, RSC Adv., 2016, 6(112), 110808–110819 RSC.
- R. F. Cracknell, D. Nicholson and K. E. Gubbins, Molecular dynamics study of the self-diffusion of supercritical methane in slit-shaped graphitic micropores, J. Chem. Soc., Faraday Trans., 1995, 91(9), 1377 RSC.
- J. O. Titiloye and N. T. Skipper, Molecular dynamics simulation of methane in sodium montmorillonite clay hydrates at elevated pressures and temperatures, Mol. Phys., 2001, 99(10), 899–906 CrossRef CAS.
- D. Cao and J. Wu, Self-diffusion of methane in single-walled carbon nanotubes at sub- and supercritical conditions, Langmuir, 2004, 20(9), 3759–3765 CrossRef CAS PubMed.
- X. Yang and C. Zhang, Structure and diffusion behavior of dense carbon dioxide fluid in clay-like slit pores by molecular dynamics simulation, Chem. Phys. Lett., 2005, 407(4–6), 427–432 CrossRef CAS.
- E. Fathi and I. Y. Akkutlu, Nonlinear Sorption Kinetics and Surface Diffusion Effects on Gas Transport in Low-permeability Formations, SPE Annu. Tech. Conf. Exhib., 2009,(2003), 1–10 Search PubMed.
- S. K. Bhatia and D. Nicholson, Adsorption and diffusion of methane in silica nanopores: A comparison of single-site and five-site models, J. Phys. Chem. C, 2012, 116(3), 2344–2355 CrossRef CAS.
- S. Li, K. S. Han, G. Feng, E. W. Hagaman, L. Vlcek and P. T. Cummings, Dynamic and structural properties of room-temperature ionic liquids near silica and carbon surfaces, Langmuir, 2013, 29(31), 9744–9749 CrossRef CAS PubMed.
- A. Sharma, S. Namsani and J. K. Singh, Molecular simulation of shale gas adsorption and diffusion in inorganic nanopores, Mol. Simul., 2015, 41(October), 414–422 CrossRef CAS.
- P.-H. Huang, S.-C. Hung and M.-Y. Huang, Molecular dynamics investigations of liquid-vapor interaction and adsorption of formaldehyde, oxocarbons, and water in graphitic slit pores, Phys. Chem. Chem. Phys., 2014, 16(29), 15289–15298 RSC.
- H. Sui and J. Yao, Effect of surface chemistry for CH4/CO2 adsorption in kerogen: A molecular simulation study, J. Nat. Gas Sci. Eng., 2016, 31, 738–746 CrossRef CAS.
- H. Sun, COMPASS: An ab Initio Force-Field Optimized for Condensed-Phase ApplicationssOverview with Details on Alkane and Benzene Compounds, J. Phys. Chem. B, 1998, 5647(98), 7338–7364 CrossRef.
- H. Sun, P. Ren and J. R. Fried, The COMPASS force field: parameterization and validation for phosphazenes, Comput. Theor. Polym. Sci., 1998, 8(1–2), 229–246 CrossRef CAS.
- S. Lifson, a. T. Hagler and P. Dauber, Consistent Force Field Studies of Intermolecular Forces in Hydrogen-Bonded Crystals. 1. Carboxylic Acids, Amides and the C=O⋯H-Hydrogen Bonds, J. Am. Chem. Soc., 1979, 101, 5111–5121 CrossRef CAS.
- M. Waldman and A. T. Hagler, New combining rules for rare gas van der waals parameters, J. Comput. Chem., 1993, 14(9), 1077–1084 CrossRef CAS.
- G. Qin and S. He, “Molecular Dynamics Simulation on Modeling Shale Gas Transport and Storage Mechansims in Complex Nano-Pore Structure in Organic Matters,” Unconventional Resources Technology Conference (URTEC), 2015 Search PubMed.
- R. Stryjek and J. H. Vera, An improved Peng—Robinson equation of state for pure compounds and mixtures, Can. J. Chem. Eng., 1986, 64(2), 323–333 CrossRef CAS.
- S. Sircar, Excess properties and thermodynamics of multicomponent gas adsorption, J. Chem. Soc., Faraday Trans. 1, 1985, 81(7), 1527–1540 RSC.
- J. Xiong, X. Liu, L. Liang and Q. Zeng, Adsorption behavior of methane on kaolinite, Ind. Eng. Chem. Res., 2017, 56(21), 6229–6238 CrossRef CAS.
- H. Sun, H. Zhao, N. Qi and Y. Li, Simulation to Enhance Shale Gas Recovery Using Carbon Dioxide in Silica Nanopores with Different Sizes, Energy Technol., 2017, 250100, 1–8 Search PubMed.
- M. Gasparik, P. Bertier, Y. Gensterblum, A. Ghanizadeh, B. M. Krooss and R. Littke, Geological controls on the methane storage capacity in organic-rich shales, Int. J. Coal Geol., 2014, 123, 34–51 CrossRef CAS.
- F. Yang, Z. Ning, R. Zhang, H. Zhao and B. M. Krooss, Investigations on the methane sorption capacity of marine shales from Sichuan Basin, China, Int. J. Coal Geol., 2015, 146, 104–117 CrossRef CAS.
- J. Xiong, X. Liu, L. Liang and Q. Zeng, Adsorption of methane in organic-rich shale nanopores: An experimental and molecular simulation study, Fuel, 2017, 200, 299–315 CrossRef CAS.
- J. Xiong, X. Liu and L. Liang, Experimental study on the pore structure characteristics of the Upper Ordovician Wufeng Formation shale in the southwest portion of the Sichuan Basin, China, J. Nat. Gas Sci. Eng., 2015, 22, 530–539 CrossRef CAS.
- M. Helbæk, B. Hafskjold, D. K. Dysthe and G. H. Sørland, Self-Diffusion Coefficients of Methane or Ethane Mixtures with Hydrocarbons at High Pressure by NMR, J. Chem. Eng. Data, 1996, 41(3), 598–603 CrossRef.
- T. Zhang, G. S. Ellis, S. C. Ruppel, K. Milliken and R. Yang, Effect of organic-matter type and thermal maturity on methane adsorption in shale-gas systems, Org. Geochem., 2012, 47, 120–131 CrossRef CAS.
- P. A. Witherspoon and D. N. Saraf, Diffusion of Methane, Ethane, Propane, and n-Butane in Water from 25 to 43°, J. Phys. Chem., 1965, 69(11), 3752–3755 CrossRef CAS.
- G. Liu, Z. Zhao, M. Sun, J. Li, G. Hu and X. Wang, New insights into natural gas diffusion coefficient in rocks, Pet. Explor. Dev., 2012, 39(5), 597–604 CrossRef.
- K. Mosher, J. He, Y. Liu, E. Rupp and J. Wilcox, Molecular simulation of methane adsorption in micro- and mesoporous carbons with applications to coal and gas shale systems, Int. J. Coal Geol., 2013, 109–110, 36–44 CrossRef CAS.
- X. Xia, S. Litvinov and M. Muhler, Consistent approach to adsorption thermodynamics on heterogeneous surfaces using different empirical energy distribution models, Langmuir, 2006, 22(19), 8063–8070 CrossRef CAS PubMed.
- Z. Zhai, X. Wang, X. Jin, L. Sun, J. Li and D. Cao, Adsorption and diffusion of shale gas reservoirs in modeled clay minerals at different geological depths, Energy Fuels, 2014, 28(12), 7467–7473 CrossRef CAS.
- J. Xiong, X. Liu, L. Liang and Q. Zeng, Methane Adsorption on Carbon Models of the Organic Matter of Organic-Rich Shales, Energy Fuels, 2017, 31(2), 1489–1501 CrossRef CAS.
| This journal is © The Royal Society of Chemistry 2018 |

