DOI:
10.1039/C8RA06712K
(Paper)
RSC Adv., 2018,
8, 32044-32054
Speciation of lanthanide ions in the organic phase after extraction from nitrate media by basic extractants†
Received
9th August 2018
, Accepted 7th September 2018
First published on 14th September 2018
Abstract
A speciation study was carried out for lanthanide complexes formed in the organic phase after solvent extraction with quaternary ammonium and phosphonium nitrate extractants. These extractants are liquid at room temperature and were applied in their undiluted form. A comparison was made between the quaternary compound trihexyl(tetradecyl)phosphonium nitrate, the nitrate form of the commercial extractant Cyphos IL 101, and Aliquat 336 nitrate, the nitrate form of the commercial trialkylmethylammonium chloride extractant Aliquat 336 (alkyl = mixture of C8 and C10 chains). The structures of the lanthanide complexes across the entire lanthanide series (with the exception of promethium) were determined by a combination of solvent extraction techniques, FTIR, NMR, high-resolution steady-state luminescence spectroscopy, luminescence life time measurements, elemental analysis and EXAFS spectroscopy. The results suggest that the lanthanide ions form an anionic nitrate complex in the organic phase by coordinating with five bidentate nitrate ligands. Charge neutralization is provided by two counter cations of the extractant present in the outer coordination sphere of the complex. Furthermore, it is suggested that the pentanitrato complex is the sole lanthanide species that is formed in significant concentrations in the organic phase.
Introduction
The lanthanides comprise a group of 15 chemical elements ranging from lanthanum (Z = 57) to lutetium (Z = 71). The 4f orbitals, which are sequentially filled from lanthanum to lutetium, are shielded from the nucleus by the fully occupied and more highly energetic 5s and 5p orbitals.1 Together with scandium and yttrium, the lanthanides form the group of the rare-earth elements (REEs). Due to their similar electronic structure and ion size, all lanthanide ions have comparable chemical and physical properties. Rare-earth ores contain a mixture of lanthanides which need to be separated in order to isolate the pure metals, which are used in applications such as permanent magnets, lamp phosphors, catalysts and optical glass.2,3 Industrial separation of lanthanides is done by solvent extraction.4–7 A metal-rich aqueous phase is brought into contact with an immiscible organic phase, containing an extractant, a diluent and often also a modifier.8–10 The extractant is a metal-coordinating ligand and the diluent is used to increase the solubility of the complex and to decrease the viscosity of the organic phase. The metals distribute between the two phases based on their affinity for the aqueous phase (interactions with water and/or the complexing agent) or the organic phase (interactions with the extractant and/or the diluent). In general, extractants are divided in three distinct classes: (1) acidic extractants for which the extraction is pH-dependent, (2) neutral extractants, where neutral species containing electron-donating groups such as oxygen coordinate to the metal ion, and (3) basic extractants which extract anionic metal complexes. Due to their similar chemical properties, the separation between neighbouring lanthanides is difficult and often more than 100 extraction stages are required to obtain one lanthanide in high purity (>99.9%).11 Acidic extractants are preferred by industry to separate the lanthanides into individual elements because they can extract lanthanides from chloride solutions. This has the advantage that HCl can be used to dissolve the mixed lanthanide oxide starting materials, which is cheaper than HNO3.11 In the case of basic extractants, only nitrate- or thiocyanate-based extractants show significant lanthanide extraction and are therefore less exploited in industry. Nevertheless, they offer a high potential, such as no need for accurate pH control and less consumption of chemicals due to easy stripping with water. Furthermore, our group has recently provided a solution to extract lanthanides also from chloride solution with ammonium and phosphonium nitrate and thiocyanate extractants, based on a concept called “split-anion extraction”.12
In general, the ionic radius of the lanthanides decreases with increasing atomic number (lanthanide contraction) and the charge density increases, so that the electrostatic interaction between the lanthanide and the extractant present in the organic phase increases across the lanthanide series. If conditions are kept constant, this results in higher extraction efficiencies for the heavy lanthanides compared to the lighter lanthanides. This is the so-called “positive sequence” for solvent extraction. There are a few exceptions to this rule. In the case of extraction with carboxylic acids diluted in apolar solvents, the structure of the complex changes across the lanthanide series. This results in an optimum in the plot of extraction efficiency as a function of the atomic number Z, as shown by Preston and du Preez.13,14 2-Bromo-3,5,5-trimethylhexanoic acid extracts heavy lanthanides as monomeric complexes of the form of Ln(A)3(HA)3, while the light lanthanides are extracted as dimeric (Ln(A)3(HA)3)2 complexes. An optimum in the extraction efficiency along the lanthanide series is also found for the neutral extractants tri-n-octylphosphine oxide (TOPO) and tri-n-butylphosphate (TBP) and basic trialkylmethylammonium chloride extractants, e.g. Aliquat 336.11,15,16
A surprising example is the extraction of lanthanide ions by basic extractants having nitrate anions, such as Aliquat 336 in the nitrate form, [A336][NO3], where the highest extraction efficiency is observed for La3+, and the lowest for Lu3+.11,16 The reverse extraction behaviour is called the “negative sequence”. In contrast, lanthanide extraction with basic extractants in the thiocyanate form, such as Aliquat 336 thiocyanate [A336][SCN], follow a normal positive sequence. This difference in behaviour could be exploited to separate the lanthanide ions with solvent extraction, as shown by Larsson and Binnemans.17 Preston and Du Preez suggested that this remarkable negative sequence might be due to steric hindrance of the nitrate in the lanthanide complex, resulting in lower stability constants for the nitrato complexes of the smaller heavy lanthanides compared to the larger light lanthanides.16 However, they did not provide experimental proof to support their hypothesis. Attempts to gain more insight into the extraction mechanism focus mainly on the structural analysis of the lanthanide complex in the aqueous phase or on slope analysis.18–20 To the best of our knowledge, a speciation study of the lanthanide complex in the organic phase is not available for this type of extraction systems yet.
In this paper, the structure of the lanthanide complexes formed upon extraction with basic nitrate extractants is investigated. Two common basic extractants are considered: the quaternary compound trihexyl(tetradecyl)phosphonium nitrate [P66614][NO3] and the quaternary ammonium nitrate extractant Aliquat nitrate [A336][NO3]. [P66614][NO3] is the nitrate form of Cyphos IL 101, whereas [A336][NO3] is the nitrate form of Aliquat 336 (trialkylmethylammonium chloride, with a mixture of C8 and C10 alkyl chains) (Fig. 1). The different lanthanide complexes are studied by solvent extraction techniques, FTIR, NMR, luminescent life time measurements, high-resolution luminescence spectroscopy, elemental analysis and EXAFS.21 Promethium was not studied due to the lack of stable isotopes.
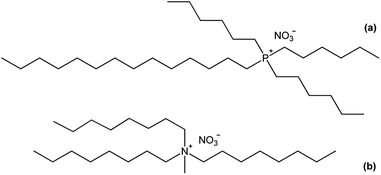 |
| | Fig. 1 Chemical structure of (a) trihexyl(tetradecyl)phosphonium nitrate [P66614][NO3] and (b) trioctylmethylammonium nitrate, the main component of Aliquat 336 in the nitrate form, [A336][NO3]. | |
Experimental
Chemicals
Praseodymium(III) nitrate hexahydrate (99.9%), samarium(III) nitrate hexahydrate (99.9%), europium(III) nitrate hexahydrate (99.9%), gadolinium(III) nitrate hexahydrate (99.9%), dysprosium(III) nitrate hexahydrate (99.9%), holmium(III) nitrate hydrate (99.9%), ytterbium(III) nitrate pentahydrate (99.9%), lutetium(III) nitrate hydrate (99.9%) and lutetium(III) chloride hexahydrate (99.9%) were obtained from STREM Chemicals (Newburyport, MA, US). Cerium(III) nitrate hexahydrate (99.9%) and terbium(III) nitrate pentahydrate (99.99%), Aliquat® 336 (88–90% purity), ammonium nitrate (99.9%), nitric acid (65%), Triton-X 100 and deuterium oxide (99.9%) were obtained from Sigma-Aldrich (Overijse, Belgium). Lanthanum(III) nitrate hexahydrate (99.9%), neodymium(III) nitrate hexahydrate (99.9%) and thulium(III) nitrate pentahydrate (99.9%) were purchased from Alfa Aesar (Karlsruhe, Germany) and erbium(III) nitrate pentahydrate (99.9%) from GFS Chemicals (Powell, OH, US). Trihexyl(tetradecyl)phosphonium chloride (Cyphos® IL 101, [P66614]Cl) was purchased from Cytec Industries (Faulquemont, France). ICP standard solutions (Ce, Pr, Nd, Sm, Ho, Er, Y: 1000 μg mL−1 in 3–5% HNO3 and the rare-earth mixture of 50 μg mL−1 in 3–5% HNO3) were obtained from Chem-Lab (Zedelgem, Belgium). Toluene, hydrochloric acid (∼37%) and absolute ethanol were obtained from Fisher Scientific (Hampton, NH, US). The silicone solution in isopropanol was ordered from SERVA Electrophoresis (Heidelberg, Germany). Ultrapure water (18.2 MΩ cm) was used for all dilutions and produced using a Sartorius Arium Pro Ultrapure Water System.
Extraction experiments
Trihexyl(tetradecyl)phosphonium nitrate, [P66614][NO3], and Aliquat 336 nitrate (trialkylmethylammonium nitrate, [A336][NO3]) were synthesized via a metathesis reaction with NH4NO3 starting from Cyphos IL 101 and Aliquat 336, respectively. The Cyphos IL 101 and Aliquat 336 were each contacted three times with a 10 mol L−1 NH4NO3 solution in a 1![[thin space (1/6-em)]](https://www.rsc.org/images/entities/char_2009.gif) :
:![[thin space (1/6-em)]](https://www.rsc.org/images/entities/char_2009.gif) 1 aqueous-to-organic (A/O) volume ratio while stirring vigorously. Subsequently, the organic phase was washed with water to remove the remaining salt impurities. The presence of chloride in the water-saturated organic phase was ruled out by total-reflection X-ray fluorescence (TXRF) spectroscopy.22,23 All extraction experiments were performed by mixing an aqueous lanthanide nitrate solution (various concentrations) with water-saturated [P66614][NO3] or [A336][NO3] in a 1
1 aqueous-to-organic (A/O) volume ratio while stirring vigorously. Subsequently, the organic phase was washed with water to remove the remaining salt impurities. The presence of chloride in the water-saturated organic phase was ruled out by total-reflection X-ray fluorescence (TXRF) spectroscopy.22,23 All extraction experiments were performed by mixing an aqueous lanthanide nitrate solution (various concentrations) with water-saturated [P66614][NO3] or [A336][NO3] in a 1![[thin space (1/6-em)]](https://www.rsc.org/images/entities/char_2009.gif) :
:![[thin space (1/6-em)]](https://www.rsc.org/images/entities/char_2009.gif) 1 A/O volume ratio. Higher lanthanide loadings in the organic phase were obtained by applying higher A/O volume ratios. Extraction equilibrium was reached by shaking the mixtures at 70 °C for 4 h in a TMS-200 Thermoshaker (Nemus Life, Sweden) operating at 1700 rpm. A Heraeus Megafuge 1.0 centrifuge was used to speed up phase disengagement. The glass vials used for extraction were always first pretreated by cleaning with HCl (37%) for 1 h at 60 °C to avoid leaching of metal ions present in the glass (Fe, Pb) during the extractions. The lanthanide concentration in the aqueous phase was measured with inductively coupled plasma optical emission spectroscopy (ICP-OES) and the concentration in the organic phase was calculated using the mass balance. The extraction of the lanthanides was quantified by calculating the distribution ratio DLn:
1 A/O volume ratio. Higher lanthanide loadings in the organic phase were obtained by applying higher A/O volume ratios. Extraction equilibrium was reached by shaking the mixtures at 70 °C for 4 h in a TMS-200 Thermoshaker (Nemus Life, Sweden) operating at 1700 rpm. A Heraeus Megafuge 1.0 centrifuge was used to speed up phase disengagement. The glass vials used for extraction were always first pretreated by cleaning with HCl (37%) for 1 h at 60 °C to avoid leaching of metal ions present in the glass (Fe, Pb) during the extractions. The lanthanide concentration in the aqueous phase was measured with inductively coupled plasma optical emission spectroscopy (ICP-OES) and the concentration in the organic phase was calculated using the mass balance. The extraction of the lanthanides was quantified by calculating the distribution ratio DLn:| |
 | (1) |
where [Ln]org and [Ln]aq are the lanthanide concentration in the organic and aqueous phase, respectively. The separation between two lanthanides is calculated using the separation factor  :
:| |
 | (2) |
Analysis techniques
The lanthanide concentration in the aqueous phase of the extraction experiments was measured with ICP-OES on a Perkin-Elmer Optima 8300 spectrometer. The samples were diluted 100 times in 2 vol% HNO3. Calibration solutions of 0.01 and 1 mg L−1 were prepared by diluting the ICP standard rare-earth mixture (50 μg mL−1 in 3–5% HNO3) in 2 vol% HNO3. Scandium and indium (5 mg L−1) were added as internal standard to the samples and calibration solutions to check for matrix effects. Total reflection X-ray fluorescence (TXRF) spectroscopy was performed on a Bruker Picofox S2 spectrometer to determine the chloride content of the synthesized [P66614][NO3] and [A336][NO3] and to measure the lanthanide concentration in the organic phase for determination of the maximum loading. A 20 mg aliquot was dissolved in 1 mL of absolute ethanol. A 100 μL aliquot of this solution was mixed with 100 μL of an internal standard solution of a neighbouring lanthanide (1000 μg mL−1) and diluted to 1 mL with ethanol. The quartz sample carriers were pretreated with 30 μL of silicone solution in isopropanol and dried for 30 min at 60 °C, prior to addition of the sample on the carrier (1 μL) and again drying for 30 min at 60 °C. The samples were measured for 500 s. The carbon, hydrogen and nitrogen content (wt%) of the metal loaded [P66614][NO3] phase was determined by CHN analysis using a Thermo Scientific Interscience Flash 2000 elemental analyser. Quantitative 31P NMR was performed to determine the phosphorus content in the metal-loaded [P66614][NO3] phase by adding benzyltriphenylphosphonium chloride as a standard to the sample, diluted in DMSO. 31P NMR spectra were recorded on a Bruker Ascend 400 spectrometer operating at 162 MHz. The d1 parameter of the measurement was optimized to 20 s. The P concentration was calculated based on the integration of the peaks of [P66614][NO3] (δ = 33.76 ppm) and the standard (δ = 23.16 ppm). Photoluminescence spectroscopy was performed on a Horiba Jobin Yvon Fluorolog-3 spectrofluorimeter equipped with a double-grating monochromator in both the excitation and emission sides, coupled to a R928P Hamamatsu photomultiplier and a 450 W Xe arc lamp as the excitation source. The luminescence lifetimes were measured by a pulsed Xe lamp with variable repetition rate and elaborated with standard software fitting procedures. Fourier-transform infrared spectra were recorded on a Bruker Vertex 70 spectrometer and analysed with the Bruker OPUS software (version 7.5). The liquid samples were measured directly, without sample preparation, using the attenuated total reflectance module (Platinum ATR). Extended X-ray Absorption Fine Structure (EXAFS) spectra were collected at the Dutch-Belgian Beamline (DUBBLE, BM26A) of the European Synchrotron Radiation Facility (ESRF) in Grenoble (France). The energy of the X-ray beam was tuned by a double-crystal monochromator operating in fixed-exit mode using a Si(111) crystal pair for measurements on the LIII-lines of Nd, Sm, Eu, Gd, Tb, Dy, Ho, Er, Tm, Yb and Lu and a Si(311) crystal pair for measurements on the K-edge of La (38![[thin space (1/6-em)]](https://www.rsc.org/images/entities/char_2009.gif) 925 eV) and Ce (40
925 eV) and Ce (40![[thin space (1/6-em)]](https://www.rsc.org/images/entities/char_2009.gif) 443 eV). The measurements were done in transmission mode using Ar/He gas filled ionization chambers at ambient pressure for the LIII edges and Ar/Kr filled ionization chambers for the K edges. A brass sample holder with Kapton windows and a flexible polymeric spacer (VITON) was used. Standard procedures were applied for pre-edge subtraction and data normalization in order to isolate the EXAFS function (χ). The EXAFS oscillations, isolated by a smoothing spline using the program VIPER, were k4-weighed and Fourier transformed using a Gaussian rounded ends window function.24 The data were fitted in R + Δ (Å) space using the ab initio code FEFF 7.0, which was used to calculate the theoretical phase and amplitude functions of the model that was subsequently used in the non-linear least-squares refinement of the experimental data.25 The input used for FEFF 7.0 was manually constructed and consisted of the targeted lanthanide in the centre position, with one bidentate nitrate in its first coordination sphere at a distance corresponding to lanthanide pentanitrato crystal structures.26 Estimated errors are shown between parentheses and calculated by VIPER. The amplitude reduction factor S0 was fixed at 0.9 for the La and Ce samples and at 1.1 for all other samples. [P66614]3[LuCl6] was used as a reference compound and was prepared by dissolving 100 mg of LuCl3·6H2O in 5 mL Cyphos IL 101 and drying at a Schlenk line for two days at 60 °C.
443 eV). The measurements were done in transmission mode using Ar/He gas filled ionization chambers at ambient pressure for the LIII edges and Ar/Kr filled ionization chambers for the K edges. A brass sample holder with Kapton windows and a flexible polymeric spacer (VITON) was used. Standard procedures were applied for pre-edge subtraction and data normalization in order to isolate the EXAFS function (χ). The EXAFS oscillations, isolated by a smoothing spline using the program VIPER, were k4-weighed and Fourier transformed using a Gaussian rounded ends window function.24 The data were fitted in R + Δ (Å) space using the ab initio code FEFF 7.0, which was used to calculate the theoretical phase and amplitude functions of the model that was subsequently used in the non-linear least-squares refinement of the experimental data.25 The input used for FEFF 7.0 was manually constructed and consisted of the targeted lanthanide in the centre position, with one bidentate nitrate in its first coordination sphere at a distance corresponding to lanthanide pentanitrato crystal structures.26 Estimated errors are shown between parentheses and calculated by VIPER. The amplitude reduction factor S0 was fixed at 0.9 for the La and Ce samples and at 1.1 for all other samples. [P66614]3[LuCl6] was used as a reference compound and was prepared by dissolving 100 mg of LuCl3·6H2O in 5 mL Cyphos IL 101 and drying at a Schlenk line for two days at 60 °C.
Results and discussion
Extraction
The distribution ratios for the trivalent lanthanide ions are known to show a decreasing trend across the lanthanide series upon extraction with the extractants [P66614][NO3] and [A336][NO3] from a nitrate feed solution.11,16 As shown in Fig. 2, the distribution ratios indeed decreased when going from low atomic numbers (La, Z = 57) to high atomic numbers (Lu, Z = 71), confirming the negative sequence. The decreasing trend was more pronounced at high NH4NO3 concentrations in the aqueous phase. At high nitrate concentrations, the distribution ratios showed a clear tetrad effect.27,28 This behaviour is typically seen in several lanthanide extraction system and divides the lanthanides into four tetrads, with Gd (Z = 64) being the common element of the two central tetrads. Furthermore, it can be seen that the distribution ratios increased with an increasing nitrate concentration in the aqueous phase, with a larger increase for the lanthanides with low atomic number compared to the ones with a high atomic number. Consequently, the slope of the plot changed with increasing nitrate concentration, resulting in improved selectivity for extraction of the lanthanides with a low atomic number over those with a high atomic number, as a function of the nitrate concentration.
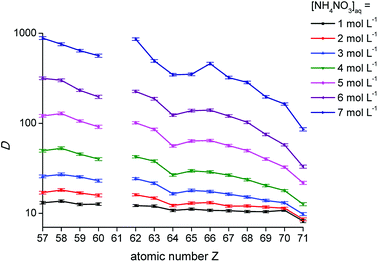 |
| | Fig. 2 Distribution ratios (D) as a function of the atomic number of the lanthanides for the extraction with [P66614][NO3] for different NH4NO3 concentrations in the aqueous phase. [Ln3+]aq,in = 0.01 mol L−1, A/O 1![[thin space (1/6-em)]](https://www.rsc.org/images/entities/char_2009.gif) : :![[thin space (1/6-em)]](https://www.rsc.org/images/entities/char_2009.gif) 1. 1. | |
Systematic research in the CSD
A systematic research of the Cambridge Structural Database (CSD) was performed to get a first idea of the coordination of nitrate to the extracted lanthanide ions in the organic phase. Lanthanide crystal structures containing at least four bidentate nitrate ligands, including structures with five and six nitrates and/or other ligands, were extracted from the database. An overview of the different structures is presented in the ESI (Fig. S2†). One must be aware of the fact that crystal structures are not necessarily representative for the structure of the complexes in the liquid state. For La3+, Ce3+, Pr3+ and Nd3+, the majority of the isolated nitrato complexes contained six bidentate nitrate ligands with a coordination number of twelve. For Sm3+, Eu3+, Gd3+ and Dy3+ complexes with six nitrate ions have been isolated, but the number of complexes with four or five nitrates was larger. For Tb3+, Ho3+, Er3+, Yb3+, Tm3+ and Lu3+, only complexes with four or five nitrate ions have been reported. In general, the lighter lanthanides mostly occur as hexanitrato complexes, [Ln(NO3)6]3−, while the heavier lanthanides mainly form pentanitrato complexes [Ln(NO3)5]2−.
Fourier-transform infrared (FTIR) spectroscopy
FTIR spectroscopy was used to determine the mode in which the nitrate anions coordinate to the extracted trivalent lanthanide ion in the organic phase. Nitrate can coordinate to a metal ion in three different ways: monodentate, bidentate bridging and bidentate chelating (Fig. 3).
 |
| | Fig. 3 Different coordination modes of the nitrate ion: (a) monodentate, (b) bidentate bridging and (c) bidentate chelating. | |
The transmittance of the organic phase was recorded in the range between 4000 and 400 cm−1 as a function of the Pr3+, Nd3+, Ho3+ and Er3+ loading in the organic phase. Similar bands were observed for all four lanthanides. Therefore, the spectrum of Nd3+ is discussed in more detail. The full spectrum of Nd3+ can be found in the ESI (Fig. S3†). Bands corresponding to the vibration modes of the cation of the extractant did not show an increase in intensity or shift in wavenumber upon metal loading, indicating that the extractant cation is not directly coordinating to the metal centre. The vibration modes of the cation include the CH2 stretching mode in the region 2850–2950 cm−1 and the CH2 rocking mode at 719 cm−1 (Fig. 4). A band attributed to the bending mode of H2O can be found at 1630 cm−1. The intensity of this band decreased with increasing metal loading, due to the decrease of the water content in the organic phase at higher metal loadings. This decrease in water content is attributed to the formation of an anionic lanthanide complex with a lower charge density than the nitrate ion, leading to a weaker anion hydration in the organic phase. The majority of the remaining bands can be attributed to the vibration of the nitrate anion.29–34 A combination band of the symmetrical stretch and in-plane bending of the nitrate can be found in the region 1730–1770 cm−1. This band is split upon loading of the organic phase with Nd3+ into two bands, at 1770 cm−1 and 1720 cm−1. This is attributed to the reduction of the local symmetry of the nitrate anion from D3h in the non-coordinated form, to C2v or lower for the metal-coordinated nitrate. The splitting of this doubly degenerate combination band into two separate bands is a measure for the coordination mode. In this case, the size of the gap was 43 cm−1, which is an indication for the bidentate coordination of the nitrate anion to the metal cation. A monodentate coordination would be characterized by a gap in the order of only 10 cm−1.30 Additionally, a comparison was made with the spectra of Er3+ and Ho3+ at the highest loading (Fig. 5). Both bands were shifted towards lower wavenumbers with increasing atomic number of the lanthanide. This might be explained by a weakening of the O–N bond in the nitrate ligand due to an increase in electron transfer to the Ln3+ metal ion with increasing charge density. Furthermore, two bands appear in the spectrum of Nd3+ upon increasing loading, at 1150 cm−1 and 725 cm−1 and their intensity increased with increasing metal loading (Fig. 4). They correspond to the symmetrical stretching and symmetrical bending of NO2 respectively and are not IR active in the free, non-coordinated nitrate ligand. Upon coordination, the symmetry of the nitrate decreases and they become IR active.29 The band at 1335 cm−1 was shifted to 1295 cm−1 upon coordination and was attributed to the asymmetric stretching of NO2. The band of the out-of-plane rocking of NO2 appeared at 829 cm−1 in the non-coordinated nitrate and is shifted to 816 cm−1 upon loading of the organic phase. The band in the region 1464–1480 cm−1 was attributed to the N–O stretching vibration. Finally, several isosbestic points were observed in the spectra upon increasing metal loading, e.g. at 825, 1333 and 1392 cm−1. An isosbestic point indicates the presence of one single equilibrium between two species, in this case the non-coordinated and the coordinated nitrate ligand. Consequently, only one species is formed upon coordination of nitrate to the extracted lanthanide ion at high metal loadings. Notice that at low metal loadings, differences in the FTIR spectra were rather difficult to distinguish. Thus, based on these results one must be careful when drawing conclusions about the number of different lanthanide-nitrate species present at low metal loadings.
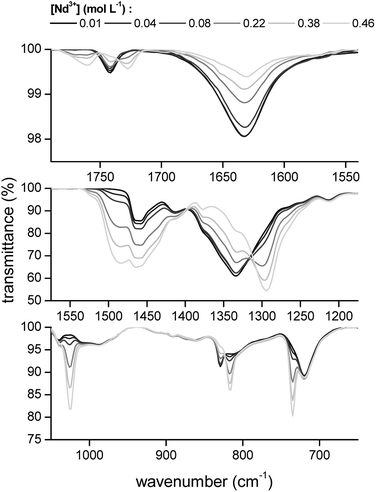 |
| | Fig. 4 FTIR spectra of the [P66614][NO3] phase after extraction of increasing concentrations of Nd3+ from a nitrate solution. | |
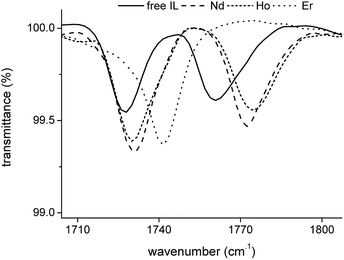 |
| | Fig. 5 FTIR spectra of the fully loaded [P66614][NO3] phase after extraction of Nd3+, Ho3+ and Er3+ from a nitrate solution. | |
Photoluminescence spectroscopy
Complementary to FTIR, Eu3+ luminescence emission spectra were recorded to gain insight into the local symmetry and structure of the Eu3+ nitrate complex in the organic phase. A comparison was made between [P66614][NO3] and [A336][NO3] and between the water-saturated and the dried organic phase. Furthermore, the influence of the metal loading in the organic phase on the spectrum was investigated. All spectra showed the same transitions and relative intensities, both in the Eu3+ loaded [A336][NO3] and [P66614][NO3] and as a function of the Eu3+ loading (Fig. 6). This indicates that the same species is present at both low and high metal loadings and in both organic phases, which confirms that the cation of the studied extractants did not affect the speciation. Furthermore, the Eu3+ emission spectrum in dried [P66614][NO3] is the same as in water-saturated [P66614][NO3]. Most likely, no water molecules are directly coordinated to the Eu3+ ion, assuming that all water is evaporated from the sample. The 5D0 → 7F0 transition is very weak and shows only one peak, indicating that only one species is present. Due to the non-degeneracy of the 5D0 and 7F0 levels, only one peak is expected for a single species in solution. The peak for the 5D0 → 7F1 transition is weak and split. In an icosahedral environment, this transition is not split, while in a hexagonal, tetragonal and trigonal symmetry, it is split into one non-degenerate and two degenerate levels.35 The hexanitrato complex (CN = 12) is expected to have an octahedral or icosahedral-like geometry, while the pentanitrato complex (CN = 10) would show a trigonal bipyramidal type of symmetry.36 The hypersensitive transition 5D0 → 7F2 is very intense and sharp, which indicates that the Eu3+ complex does not contain an inversion centre. The high intensity of this transition thus indicates the presence of a trigonal bipyramidal pentanitrato europate(III) complex with bidentate coordinating nitrate ligands in a D3h symmetry. Furthermore, the fact that this transition shows a very narrow peak and is not split gives additional evidence for a D3h symmetry. The 5D0 → 7F3 transition is very weak and the 5D0 → 7F4 transition is weak. For five bidentate nitrate ions to be compatible with a trigonal bipyramid (CN = 5) as an idealized coordination polyhedron, each nitrate ion must be considered to occupy one of the five coordination places in the trigonal bipyramid and the total coordination number of the europium complex would be CN = 10 (Fig. 7).
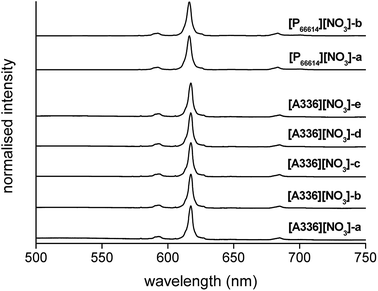 |
| | Fig. 6 Emission spectra (λex = 464 nm) of [A336][NO3] loaded with increasing concentrations of Eu3+ (0.1 to 0.3 mol L−1, sample [A336][NO3]-a to [A336][NO3]-e), and [P66614][NO3] loaded with Eu3+ (0.5 mol L−1), water-saturated ([P66614][NO3]-a) and dry ([P66614][NO3]-b), by extraction from a nitrate solution. | |
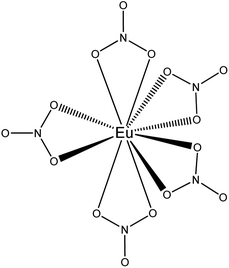 |
| | Fig. 7 Schematic representation of the trigonal bypiramidal pentanitratoeuropium complex Eu(NO3)52−. The bipyramid is formed by the position of the nitrogen atoms. | |
The hydration number q of the metal complex in the organic phase was determined using luminescence lifetime decay measurements of Eu3+ and Tb3+. The luminescence decay curves were recorded for the loaded organic phase in H2O and D2O medium, at low and high metal loadings, 0.05 mol L−1 and 0.5 mol L−1, respectively (Fig. S4–S6†). All curves were fitted well by a mono-exponential decay function, indicating that each sample contained only one species. The calculated lifetimes (ms) are presented in Table 1. The hydration number q was calculated using the Horrocks–Sudnick formula (3):
| |
 | (3) |
with
τH2O and
τD2O the luminescence lifetimes in the H
2O and D
2O sample, respectively, and
A equal to 1.05 (molecules ms) for Eu
3+ and 4.2 (molecules ms) for Tb
3+.
35,37 Supkowski and Horrocks derived a modified formula, based on literature data of several Eu
3+ complexes in solution, which takes into account additional quenching of the
5D
0 state of Eu
3+ by other interactions apart from the coordinated water molecules in the first coordination sphere, including bulk water in the sample.
38 However, the samples studied in this work are ionic liquid samples, hence they do not contain water in the bulk. Therefore, the hydration number in these samples is correctly estimated by the original Horrocks–Sudnick equation.
Table 1 Lifetimes of Eu3+ and Tb3+ luminescence in the organic phase by extraction with [P66614][NO3] in H2O and D2O
| Sample |
τH2O (ms) |
τD2O (ms) |
q |
| Eu3+ 0.05 mol L−1 |
1.13 |
1.26 |
0.1 ± 0.5 |
| Tb3+ 0.05 mol L−1 |
1.30 |
1.36 |
0.1 ± 0.5 |
| Tb3+ 0.5 mol L−1 |
1.43 |
1.44 |
0.0 ± 0.5 |
Maximum loading
Further evidence for the exact stoichiometry of the lanthanide nitrato complex in the organic phase was provided by analyzing the elemental composition of the organic phase at maximum loading. First, the conditions required for maximum loading of the organic phase were estimated by contacting [P66614][NO3] in a 4![[thin space (1/6-em)]](https://www.rsc.org/images/entities/char_2009.gif) :
:![[thin space (1/6-em)]](https://www.rsc.org/images/entities/char_2009.gif) 1 A/O phase ratio with an aqueous solution containing an excess of lanthanide (0.5 mol L−1) at varying nitrate concentrations (between 0 and 8 mol L−1). La3+ and Ho3+ were arbitrarily selected as representatives for the light and heavy lanthanides, respectively. A comparison between Ca(NO3)2 and NH4NO3 was made to evaluate the influence of the salting-out effect of the cation. The results are summarized in Fig. 8. The theoretical lanthanide concentration in the organic phase in case of pentanitrato complex formation was calculated to be approximately 0.7 mol kg−1. For the formation of hexanitrato complexes, the concentration would be around 0.5 mol kg−1. The loading curve of La3+ extracted from NH4NO3 does not approach the line of either the penta- or hexanitrato complex which means that NH4NO3 is not a good salting-out agent to fully extract the lanthanide ions. Ammonium ions have only weak salting-out or even salting-in properties.39 Therefore, the results were compared with extraction from Ca(NO3)2 solution, since Ca2+ is a much better salting-out agent. The metal loading in the organic phase indeed increased significantly. A plateau value was reached for Ho3+, but not for La3+, indicating that a maximum might not be reached for La3+. The maximum loading of Ho3+ reached the theoretical value of the formation of a pentanitrato complex, while the loading of La3+ was slightly higher than the theoretical value for the formation of hexanitrato complexes. In any case, the results show that conditions close to maximum loading of both lanthanide ions were reached by salting-out with a Ca(NO3)2 solution with a concentration higher than 3 mol L−1.
1 A/O phase ratio with an aqueous solution containing an excess of lanthanide (0.5 mol L−1) at varying nitrate concentrations (between 0 and 8 mol L−1). La3+ and Ho3+ were arbitrarily selected as representatives for the light and heavy lanthanides, respectively. A comparison between Ca(NO3)2 and NH4NO3 was made to evaluate the influence of the salting-out effect of the cation. The results are summarized in Fig. 8. The theoretical lanthanide concentration in the organic phase in case of pentanitrato complex formation was calculated to be approximately 0.7 mol kg−1. For the formation of hexanitrato complexes, the concentration would be around 0.5 mol kg−1. The loading curve of La3+ extracted from NH4NO3 does not approach the line of either the penta- or hexanitrato complex which means that NH4NO3 is not a good salting-out agent to fully extract the lanthanide ions. Ammonium ions have only weak salting-out or even salting-in properties.39 Therefore, the results were compared with extraction from Ca(NO3)2 solution, since Ca2+ is a much better salting-out agent. The metal loading in the organic phase indeed increased significantly. A plateau value was reached for Ho3+, but not for La3+, indicating that a maximum might not be reached for La3+. The maximum loading of Ho3+ reached the theoretical value of the formation of a pentanitrato complex, while the loading of La3+ was slightly higher than the theoretical value for the formation of hexanitrato complexes. In any case, the results show that conditions close to maximum loading of both lanthanide ions were reached by salting-out with a Ca(NO3)2 solution with a concentration higher than 3 mol L−1.
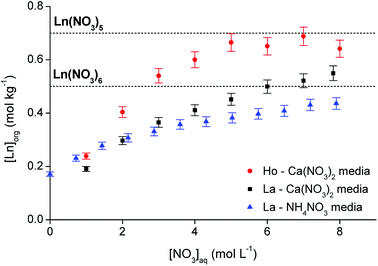 |
| | Fig. 8 Loading of [P66614][NO3] by extraction of Ho3+ and La3+ from a Ca(NO3)2 and NH4NO3 solution as a function of the nitrate concentration. 4![[thin space (1/6-em)]](https://www.rsc.org/images/entities/char_2009.gif) : :![[thin space (1/6-em)]](https://www.rsc.org/images/entities/char_2009.gif) 1 A/O phase ratio, [Ln3+]aq,in = 0.5 mol L−1, [NO3−]aq = 0–8 mol L−1. The two dashed lines indicate the theoretical maximum loading in case of Ln(NO3)52− or Ln(NO3)63− complexes. 1 A/O phase ratio, [Ln3+]aq,in = 0.5 mol L−1, [NO3−]aq = 0–8 mol L−1. The two dashed lines indicate the theoretical maximum loading in case of Ln(NO3)52− or Ln(NO3)63− complexes. | |
Besides La3+ and Ho3+, also the extraction of Nd3+, Pr3+, Eu3+, Er3+ and Lu3+ with [P66614][NO3] was characterized at maximum loading conditions (3.5 mol L−1 Ca(NO3)2). The composition of the dried organic phase after extraction was determined by three techniques: TXRF for the lanthanide concentration, CHN elemental analysis for the wt% carbon, hydrogen and nitrogen in the sample and quantitative 31P NMR for determining the relative ratio P/Ln. All these results were compared with the theoretical values of both the formation of lanthanide pentanitrato and lanthanide hexanitrato in the organic phase (Table S1† and Fig. 9). The experimental P/Ln ratio was close to a value of 2 for all tested lanthanides, except for La3+ (2.7). A P/Ln ratio of 2 means that two extractant cations are required to neutralize the lanthanide nitrate complex. Thus, the lanthanide should be coordinated by five nitrate ligands. It is likely that the higher ratio found for La should not be explained by the formation of a nitrato complex with a higher charge, but by the fact that the organic phase was not maximally loaded with La3+. CHN analysis showed that the mass fraction of carbon and hydrogen are very close to the theoretical value of a pentanitrato complex. The mass fraction of nitrogen is scattered between the theoretical value for the pentanitrato and hexanitrato complexes.
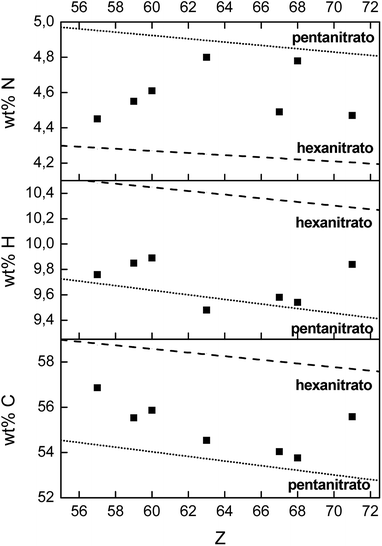 |
| | Fig. 9 CHN elemental analysis of the dried [P66614][NO3] phase, after full loading by extraction of La3+, Pr3+, Nd3+, Eu3+, Ho3+, Er3+ and Lu3+ from a 3.5 mol L−1 Ca(NO3)2 solution (4![[thin space (1/6-em)]](https://www.rsc.org/images/entities/char_2009.gif) : :![[thin space (1/6-em)]](https://www.rsc.org/images/entities/char_2009.gif) 1 A/O phase ratio, [Ln3+]aq,in = 0.5 mol L−1). The dashed line and the dotted line indicate the theoretical value of hexanitrato and pentanitrato complexes, respectively. 1 A/O phase ratio, [Ln3+]aq,in = 0.5 mol L−1). The dashed line and the dotted line indicate the theoretical value of hexanitrato and pentanitrato complexes, respectively. | |
EXAFS
EXAFS was used as a complementary technique to confirm the presence of lanthanide pentanitrato complexes [Ln(NO3)5]2− in the organic phase. X-ray absorption spectra were recorded on the LIII-edge of the lanthanides Nd to Lu, and on the K-edge of La and Ce. The EXAFS function was extracted from the data and Fourier transformed to obtain the pseudo-radial distribution function. The Fourier transform consisted of two shells, at around R + Δ = 2 Å and 4 Å, respectively. The first shell, closest to the lanthanide centre, corresponded to the coordinating oxygen atom Oc and the nitrogen atom N of the nitrate ligand, and is mainly formed by the single scattering paths Ln–Oc and Ln–N. The second shell corresponded to the third, non-coordinating, oxygen atom of the nitrate ligand, Onc and contained contributions of the Ln–Onc single scattering path, the three-leg scattering path Ln–Onc–N and the four-leg scattering path Ln–Onc–N–Onc. The Fourier transform was first fitted using a model based on one bidentate nitrate ligand coordinated to the lanthanide center and the five scattering paths described above, Ln–Oc, Ln–N, Ln–Onc, Ln–Onc–N and Ln–Onc–N–Onc. The results for the Lu sample are summarized in Table 2, Fig. 10 and 11.
Table 2 Fitting results of the [Lu(NO3)5]2− complex in the organic phase obtained by fitting the five-path model to the two coordination shells of the Fourier transform, between R + Δ = 0 and 4.46 Å. Errors are mentioned in between brackets
| Scattering path |
N |
r (Å) |
σ2 (Å2) |
| Lu–Oc |
9.9(2) |
2.395(2) |
0.011(1) |
| Lu–N |
5.0(2) |
2.852(4) |
0.008(1) |
| Lu–Onc |
5.0(2) |
4.049(3) |
0.008(1) |
| Lu–N–Onc |
9.9(2) |
4.049(3) |
0.008(1) |
| Lu–N–Onc–N |
9.9(2) |
4.059(3) |
0.008(1) |
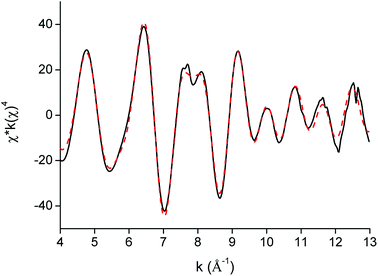 |
| | Fig. 10 EXAFS function (black) and five-path model (red dotted) of the [Lu(NO3)5]2− complex extracted to the organic phase. | |
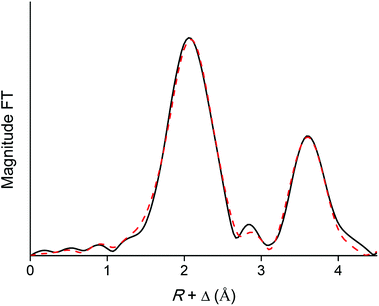 |
| | Fig. 11 Fourier transform (black) and model (red dotted) of the EXAFS function of the [Lu(NO3)5]2− complex extracted to the organic phase. The five-path model was fitted to the Fourier transform between R = 0 and 4.46 Å. | |
The data quality of the lighter lanthanides is lower than that of lutetium, due to the lower energies of the LIII-edge (Fig. 12 and Fig. 13). This complicates obtaining a good fit of the second coordination shell in the Fourier transform. However, the Ln–O and Ln–N bond distances of the coordinating oxygen atoms and the nitrogen atom of the nitrate ligands, together with the coordination number can be accurately deduced by fitting only the first coordination shell of the Fourier transform (Fig. 13), using only the single scattering paths Ln–Oc and Ln–N. The fitting results of all measured lanthanides are summarized in Table S2.† No data are available for Pr, since the signal-to-noise ratio of the Pr data set was too poor for a correct analysis due to limitations of the beam line. For the heavy lanthanides, a coordination number of 10 was found, while the fitting results of the lighter lanthanides suggest the higher coordination number of 12.
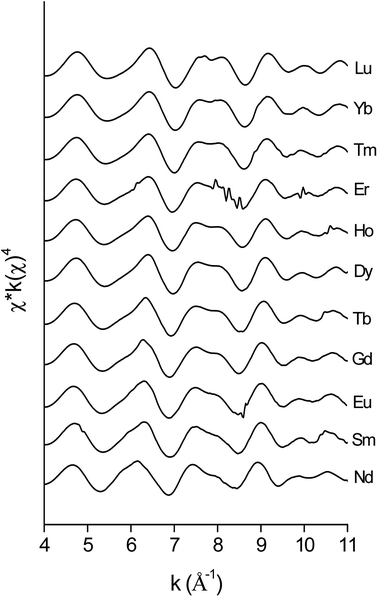 |
| | Fig. 12 EXAFS functions, recorded on the LIII-edge of the [Ln(NO3)5]2− complexes of various lanthanides in the organic phase. | |
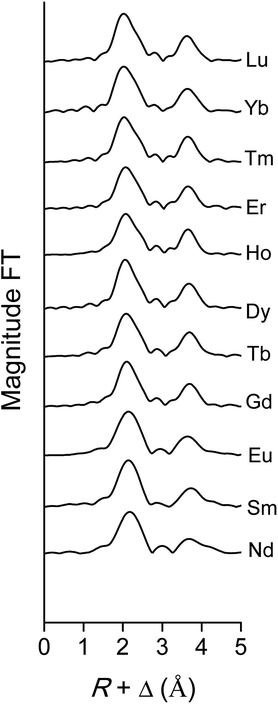 |
| | Fig. 13 Fourier transform of the EXAFS function, recorded on the LIII-edge, of the [Ln(NO3)5]2− complexes of various lanthanides in the organic phase. | |
The fitted coordination number is highly dependent on the amplitude reduction factor S0,40 which was set arbitrarily to 1.1 for all lanthanides, except La and Ce, based on the EXAFS fitting results of the [P66614]3[LuCl6] reference compound. Since La and Ce were measured on the K-edge, S0 was arbitrarily set to 0.9. Consequently, the fitted coordination number is not a good reflection of the number of nitrate ligands coordinated to the lanthanide center. On the other hand, the Ln–Oc and Ln–N bond distances also provide information on the coordination number. Therefore, the fitted bond distances were compared to literature values of crystal structures of pentanitrato and hexanitrato lanthanide complexes (Table S3†).26,41–49 The crystal structures were extracted from the Cambridge Structural Database (CSD). Average distances and their corresponding standard deviations were calculated with the Mercury software. A graphical representation of the experimental and literature data is presented in Fig. 14. For all measured lanthanide ions except La, our experimental values corresponded best to the bond distances of pentanitrato crystal structures. La seems to deviate from this general trend. The value of both the La–Oc and La–N distances are close to the literature value of the hexanitrato complex. Unfortunately, a crystal structure containing a lanthanum pentanitrato moiety could not be found in the CSD.
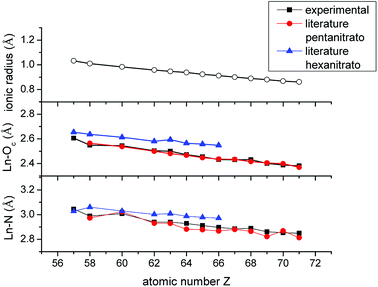 |
| | Fig. 14 Comparison between the ionic radius of the trivalent lanthanide ions Ln3+ (coordination number 6), the Ln–Oc and Ln–N interatomic distances determined experimentally with EXAFS and the corresponding literature values of [Ln(NO3)5]2− and [Ln(NO3)6]3− crystal structures. Error bars are not shown since they are too small. A detailed list of errors can be found in the ESI (Table S2†). | |
Combination of the results of the different techniques
A systematic review of the crystal structures in the Cambridge Structural Database indicated that the heavy lanthanides generally tend to form pentanitrato complexes in the solid form, while the majority of the reported complexes with the lighter lanthanides are hexanitrato complexes. However, the crystal structures do not necessarily reflect the coordination in liquid form. Lanthanide speciation after extraction to the organic phase could be different from what is observed in crystal structure. Unfortunately, no single analysis technique allows to unambiguously determine the exact speciation of all lanthanides in the organic phase and a combination of complementary analytical techniques was applied. FTIR indicated that the cation of the extractant has little effect on the speciation of Nd3+ (light lanthanide), so the cation does not intrude the first coordination sphere of the lanthanide ion. The wavenumber, shifts and splitting patterns of the absorption bands in the FTIR spectra indicate that all nitrate ions coordinate to the lanthanide ions in a bidentate fashion. Furthermore, it was shown that only one species is formed at high metal loadings, as was evident from the presence of several isosbestic points in the FTIR spectra. No conclusions could be drawn on the number of species at low loadings since the differences in intensities were too small. The FTIR spectra of Ho3+ and Er3+, both heavy lanthanides, showed similar features as Nd3+. This is a first indication that the speciation of the light and heavy lanthanides is rather similar. Photoluminescence spectroscopy provided further evidence for the presence of only one species at low loadings. The 5D0 → 5F0 emission line of the Eu3+ nitrate complex was not split, and the same emission spectrum was recorded for both high and low Eu3+ loadings. Furthermore, Eu3+ and Tb3+ emission lifetime measurements showed a mono-exponential decay. This is a clear indication that only one species is present in the organic phase, regardless of the lanthanide concentration. The comparison between the [P66614][NO3] and [A336][NO3] emission spectra confirmed that the cation of the extractant has little influence on the speciation of the lanthanide ion. Furthermore, very similar spectra were observed for both wet and dry samples. This indicated that removal of water had no influence on the speciation of the lanthanide and that no water molecules are coordinating to the lanthanide ion. From the lifetime measurements, the hydration number of Eu3+ and Tb3+ was calculated to be close to zero, again confirming that no water is coordinated to the lanthanide ion. From the intensities and the splitting pattern of the Eu3+ emission lines, it was elucidated that Eu3+ is most probably present as a bidentate pentanitrato complex in the organic phase, which is an important conclusion. Unfortunately, this conclusion applies to Eu3+ only and cannot simply be extrapolated to the other lanthanides. Elemental analysis (CHN analysis, quantitative 31P NMR and TXRF analysis) of the organic phase at maximum loading by extraction further confirmed the presence of a pentanitrato complex for the lanthanides Pr, Nd, Ho, Er and Lu. The ratio P/Ln was very close to a value of 2. The pentanitrato complex would have a charge of −2 and should thus be neutralized by two phosphonium cations. The relative carbon, hydrogen and nitrogen contents of the maximally loaded organic phases were close to the theoretical values of the pentanitrato complex [P66614]2[Ln(NO3)5]. On the other hand, the results on La were inconclusive, probably because maximum loading was not achieved. EXAFS measurements provided confirmation that the pentanitrato complex is formed in the organic phase for all lanthanides, except La. A large systematic error exists for the measured number of scattering paths (neighbours) due to the arbitrary estimation of the amplitude reduction factor. Therefore, the measured bond distances are a much better indication of the coordination number of the complex. These match best with the reported bond distances for pentanitrato complexes for all tested lanthanides except La. Furthermore, the measured bond distances confirmed that all nitrate ligands coordinate in a bidentate fashion. Duvail and coworkers suggested a Ln–N distance of 3.70 Å and 3.57 Å for Nd3+ and Dy3+ respectively in case of monodentate coordination and 3 Å and 2.88 Å in case of bidentate coordination.19 The latter corresponds best to our measured distances of 3.008 Å and 2.897 Å for Nd3+ and Dy3+ respectively.
As indicated in the above discussion, it is not possible to draw a final conclusion about the stoichiometry of lanthanum. However, the extraction experiments in Fig. 2 showed a steady decrease in D value when going from left to right across the lanthanide series. This suggests the same speciation for all investigated lanthanides. When a change in speciation would occur across the lanthanide series, this would be clearly visible as a discontinuity in the separation factors and D values as a function of the atomic number. On the other hand, the elemental composition of the loaded organic phase with CHN, 31P NMR and TXRF suggested the presence of 6 nitrate anions per extracted La3+. It could be argued that this is caused by the fact that the organic phase was not maximally loaded. Moreover, the bond distances La–Oc and La–N deduced from the EXAFS experiments corresponded well to the bond distances in the crystal structures of hexanitrato complexes. However, no crystal structure of a lanthanide pentanitrato complex could be found for comparison. Finally, in previous work of our group, it was suggested that the stoichiometry of the La3+ complex was different from that of Sm3+ based on a different viscosity of the organic phase upon extraction of both metal ions.50 In retrospect, this viscosity difference was more likely due to the experimental conditions rather than to a difference in speciation of the metal ions. Although having a significant influence on the viscosity, the water content in the organic phase was not controlled or monitored. In addition, the co-extraction of other metal ions was not taken into account. Because of the many contradictory arguments, the speciation of La3+ in the organic phase remains inconclusive, but it is expected to be the same as the other lanthanides.
In the introduction, it was mentioned that the negative sequence of the extraction of the lanthanides with nitrate is assumed to be due to steric effects. Our study did not aim at verifying this hypothesis, but it might provide a first insight into the matter. In Fig. 13, the decrease in the bond distances Ln–Oc and Ln–N is plotted as a function of the atomic number and compared with the ionic radii of the trivalent lanthanide ions Ln3+ with coordination number 6.51 The plot of the bond distances is continually parallel with the plot of the ionic radii. If steric effects would influence the coordination of nitrate ions to the lanthanides, it is expected that the bond distance plot would most likely diverge from the ionic radius plot when steric crowding becomes relevant. Based on these observations, the speciation of the lanthanides in the organic phase is most likely not influenced by steric effects and hence not the cause of the negative sequence. From this, it is clear that this work was only the start and much more research will be required to finally give an answer to the remarkable extraction behaviour of the lanthanides in basic nitrate extractants.
Conclusions
The structure of the lanthanide complexes extracted by an undiluted quaternary phosphonium nitrate and a quaternary ammonium nitrate extractant was investigated by a combination of complementary speciation techniques including FTIR, photoluminescence spectroscopy, luminescence lifetime measurements, elemental analysis (CHN and TXRF), quantitative 31P NMR and EXAFS. It was suggested that the speciation is the same for the entire lanthanide series. The results for La3+ are inconclusive, but the speciation is expected to be identical to that of the other trivalent lanthanides. The lanthanide ions are suggested to form a sole species in the organic phase, namely the pentanitrato complex [Q]2[Ln(NO3)5], in which five nitrate ligands are bidentately coordinated to the lanthanide ion. The anionic complex is neutralized by two extractant cations Q+. The lanthanide complexes do not contain any coordinating water ligands. This work provides a first insight into the negative lanthanide extraction sequence.
Conflicts of interest
There are no conflicts to declare.
Acknowledgements
The authors thank the KU Leuven (projects GOA/13/008 and IOF-KP RARE3), the FWO Flanders (postdoctoral fellowship to TVDH), Flemish Agency for Innovation and Entrepreneurship (PhD fellowship to BO) and the Brazilian Science without Border program from CNPq (postdoctoral fellowship to ERS) for funding. The research leading to these results received funding from the European Research Council (ERC) under the European Union's Horizon2020 Research and Innovation Programme: Grant Agreement 694078—Solvometallurgy for critical metals (SOLCRIMET).
Notes and references
- S. Cotton, Lanthanide and Actinide Chemistry, John Wiley & Sons Ltd, West Sussex, England, 2006 Search PubMed.
- L. Gijsemans, F. Forte, B. Onghena and K. Binnemans, RSC Adv., 2018, 8, 26349–26355 RSC.
- T. Vander Hoogerstraete, B. Blanpain, T. Van Gerven and K. Binnemans, RSC Adv., 2014, 4, 64099–64111 RSC.
- F. Xie, T. A. Zhang, D. Dreisinger and F. Doyle, Miner. Eng., 2014, 56, 10–28 CrossRef.
- M. Van de Voorde, K. Van Hecke, K. Binnemans and T. Cardinaels, RSC Adv., 2018, 8, 20077–20086 RSC.
- D. Avdibegović, M. Regadío and K. Binnemans, RSC Adv., 2018, 8, 11886–11893 RSC.
- S. Riaño, M. Petranikova, B. Onghena, T. Vander Hoogerstraete, D. Banerjee, M. R. S. Foreman, C. Ekberg and K. Binnemans, RSC Adv., 2017, 7, 32100–32113 RSC.
- Y. Marcus and A. S. Kertes, Ion Exchange and Solvent Extraction of Metal Complexes, Wiley-Interscience, London, 1969 Search PubMed.
- J. Rydberg, M. Cox, C. Musikas and G. R. Choppin, Solvent extraction principles and practice, Marcel Dekker, New York, NY, 2nd edn., 2004 Search PubMed.
- T. Sekine and Y. Hasegawa, Solvent extraction chemistry: fundamentals and applications, Marcel Dekker, New York, NY, 1977 Search PubMed.
- N. Krishnamurthy and C. K. Gupta, Extractive Metallurgy of Rare Earths, CRC Press, Boca Raton, FL, 2004 Search PubMed.
- K. Larsson and K. Binnemans, Green Chem., 2014, 16, 4595–4603 RSC.
- J. S. Preston, Solvent Extr. Ion Exch., 1994, 12, 29–54 CrossRef.
- A. C. du Preez and J. S. Preston, Solvent Extr. Ion Exch., 1992, 10, 207–230 CrossRef.
- N. V. Thakur, Miner. Process. Extr. Metall. Rev., 2000, 21, 277–306 CrossRef.
- J. S. Preston and A. C. Du Preez, in Solvent Extraction 1990, ed. T. Sekine, Elsevier, Amsterdam, 1992, pp. 883–894 Search PubMed.
- K. Larsson and K. Binnemans, Hydrometallurgy, 2015, 156, 206–214 CrossRef.
- S. Andersson, K. Eberhardt, C. Ekberg, J.-O. Liljenzin, M. Nilsson and G. Skarnemark, Radiochim. Acta, 2006, 94, 469 Search PubMed.
- M. Duvail, A. Ruas, L. Venault, P. Moisy and P. Guilbaud, Inorg. Chem., 2010, 49, 519–530 CrossRef PubMed.
- C. Bonal, J.-P. Morel and N. Morel-Desrosiers, J. Chem. Soc., Faraday Trans., 1998, 94, 1431–1436 RSC.
- M. Atanassova, V. Kurteva and I. Dukov, RSC Adv., 2016, 6, 81250–81265 RSC.
- T. Vander Hoogerstraete, S. Jamar, S. Wellens and K. Binnemans, Anal. Chem., 2014, 86, 3931–3938 CrossRef PubMed.
- T. Vander Hoogerstraete, S. Jamar, S. Wellens and K. Binnemans, Anal. Chem., 2014, 86, 1391–1394 CrossRef PubMed.
- K. V. Klementev, J. Phys. D: Appl. Phys., 2001, 34, 209–217 CrossRef.
- M. Newville, J. Synchrotron Radiat., 2001, 8, 96–100 CrossRef PubMed.
- H. Cui, T. Otsuka, A. Kobayashi, N. Takeda, M. Ishikawa, Y. Misaki and H. Kobayashi, Inorg. Chem., 2003, 42, 6114–6122 CrossRef PubMed.
- D. F. Peppard, G. W. Mason and S. Lewey, J. Inorg. Nucl. Chem., 1969, 31, 2271–2272 CrossRef.
- I. Persson, P. D'Angelo, S. DelPanfilis, M. Sandström and L. Eriksson, Chem.–Eur. J., 2008, 14, 3056–3066 CrossRef PubMed.
- J. I. Bullock, J. Inorg. Nucl. Chem., 1967, 29, 2257–2264 CrossRef.
- A. B. P. Lever, E. Mantovani and B. S. Ramaswamy, Can. J. Chem., 1971, 49, 1957–1964 CrossRef.
- D. J. Goebbert, E. Garand, T. Wende, R. Bergmann, G. Meijer, K. R. Asmis and D. M. Neumark, J. Phys. Chem. A, 2009, 113, 7584–7592 CrossRef PubMed.
- A. C. Menzies, Proc. R. Soc. London, Ser. A, 1931, 134, 265–277 CrossRef.
- E. J. Duff, M. N. Hughes and K. J. Rutt, J. Chem. Soc. A, 1969, 2126–2128, 10.1039/J19690002126.
- F. A. Miller and C. H. Wilkins, Anal. Chem., 1952, 24, 1253–1294 CrossRef.
- K. Binnemans, Coord. Chem. Rev., 2015, 295, 1–45 CrossRef.
- J. C. G. Bunzli, B. Klein, G. O. Pradervand and P. Porcher, Inorg. Chem., 1983, 22, 3763–3768 CrossRef.
- W. D. Horrocks and D. R. Sudnick, J. Am. Chem. Soc., 1979, 101, 334–340 CrossRef.
- R. M. Supkowski and W. D. Horrocks Jr, Inorg. Chim. Acta, 2002, 340, 44–48 CrossRef.
- D. Dupont, D. Depuydt and K. Binnemans, J. Phys. Chem. B, 2015, 119, 6747–6757 CrossRef PubMed.
- S. Calvin, XAFS for Everyone, CRC Press, Boca Raton, FL, 2013 Search PubMed.
- C. Yan, Y. Zhang, S. Gao, B. Li, C. Huang and G. Xu, J. Alloys Compd., 1995, 225, 385–389 CrossRef.
- A. R. Al-Karaghouli and J. S. Wood, J. Chem. Soc., Dalton Trans., 1973, 2318–2321, 10.1039/DT9730002318.
- C. Huang, B. Li, Q. Yang, S. Tian and G. Xu, Acta Sci. Nat. Univ. Pekin., 1984, 45 Search PubMed.
- N. Tang, Y. Zhao, L. He, W.-L. Yuan and G.-H. Tao, Dalton Trans., 2015, 44, 8816–8823 RSC.
- Y. Zhao, L. He, N. Tang, S. Qin, G.-H. Tao and F.-X. Liang, Eur. J. Inorg. Chem., 2015, 2015, 542–551 CrossRef.
- L. Zhang, Y. Zhou, L. Xu, Z. Yu, I. A. Razak, S. Chantrapromma, H.-K. Fun and X. You, Inorg. Chem. Commun., 2001, 4, 368–371 CrossRef.
- T. Kawasaki, S. Okumura, Y. Sasaki and Y. Ikeda, Bull. Chem. Soc. Jpn., 2013, 87, 294–300 CrossRef.
- S.-Y. Zhang, J.-S. Liao, W.-J. Xu, F.-Y. Liang, G.-H. Peng, S.-J. Liu, H.-R. Wen and Z.-Y. Du, New J. Chem., 2017, 41, 9963–9968 RSC.
- M. del C. Fernández-Fernández, R. Bastida, A. Macías, P. Pérez-Lourido, C. Platas-Iglesias and L. Valencia, Inorg. Chem., 2006, 45, 4484–4496 CrossRef PubMed.
- T. Vander Hoogerstraete and K. Binnemans, Green Chem., 2014, 16, 1594–1606 RSC.
- R. Shannon, Acta Crystallogr., Sect. A: Cryst. Phys., Diffr., Theor. Gen. Crystallogr., 1976, 32, 751–767 CrossRef.
Footnote |
| † Electronic supplementary information (ESI) available. See DOI: 10.1039/c8ra06712k |
|
| This journal is © The Royal Society of Chemistry 2018 |
Click here to see how this site uses Cookies. View our privacy policy here.  Open Access Article
 *,
Eleonora Papagni,
Ernesto Rezende Souza,
Dipanjan Banerjee,
Koen Binnemans
 and
Tom Vander Hoogerstraete

![[thin space (1/6-em)]](https://www.rsc.org/images/entities/char_2009.gif) :
:![[thin space (1/6-em)]](https://www.rsc.org/images/entities/char_2009.gif) 1 aqueous-to-organic (A/O) volume ratio while stirring vigorously. Subsequently, the organic phase was washed with water to remove the remaining salt impurities. The presence of chloride in the water-saturated organic phase was ruled out by total-reflection X-ray fluorescence (TXRF) spectroscopy.22,23 All extraction experiments were performed by mixing an aqueous lanthanide nitrate solution (various concentrations) with water-saturated [P66614][NO3] or [A336][NO3] in a 1
1 aqueous-to-organic (A/O) volume ratio while stirring vigorously. Subsequently, the organic phase was washed with water to remove the remaining salt impurities. The presence of chloride in the water-saturated organic phase was ruled out by total-reflection X-ray fluorescence (TXRF) spectroscopy.22,23 All extraction experiments were performed by mixing an aqueous lanthanide nitrate solution (various concentrations) with water-saturated [P66614][NO3] or [A336][NO3] in a 1![[thin space (1/6-em)]](https://www.rsc.org/images/entities/char_2009.gif) :
:![[thin space (1/6-em)]](https://www.rsc.org/images/entities/char_2009.gif) 1 A/O volume ratio. Higher lanthanide loadings in the organic phase were obtained by applying higher A/O volume ratios. Extraction equilibrium was reached by shaking the mixtures at 70 °C for 4 h in a TMS-200 Thermoshaker (Nemus Life, Sweden) operating at 1700 rpm. A Heraeus Megafuge 1.0 centrifuge was used to speed up phase disengagement. The glass vials used for extraction were always first pretreated by cleaning with HCl (37%) for 1 h at 60 °C to avoid leaching of metal ions present in the glass (Fe, Pb) during the extractions. The lanthanide concentration in the aqueous phase was measured with inductively coupled plasma optical emission spectroscopy (ICP-OES) and the concentration in the organic phase was calculated using the mass balance. The extraction of the lanthanides was quantified by calculating the distribution ratio DLn:
1 A/O volume ratio. Higher lanthanide loadings in the organic phase were obtained by applying higher A/O volume ratios. Extraction equilibrium was reached by shaking the mixtures at 70 °C for 4 h in a TMS-200 Thermoshaker (Nemus Life, Sweden) operating at 1700 rpm. A Heraeus Megafuge 1.0 centrifuge was used to speed up phase disengagement. The glass vials used for extraction were always first pretreated by cleaning with HCl (37%) for 1 h at 60 °C to avoid leaching of metal ions present in the glass (Fe, Pb) during the extractions. The lanthanide concentration in the aqueous phase was measured with inductively coupled plasma optical emission spectroscopy (ICP-OES) and the concentration in the organic phase was calculated using the mass balance. The extraction of the lanthanides was quantified by calculating the distribution ratio DLn:
 :
:
![[thin space (1/6-em)]](https://www.rsc.org/images/entities/char_2009.gif) 925 eV) and Ce (40
925 eV) and Ce (40![[thin space (1/6-em)]](https://www.rsc.org/images/entities/char_2009.gif) 443 eV). The measurements were done in transmission mode using Ar/He gas filled ionization chambers at ambient pressure for the LIII edges and Ar/Kr filled ionization chambers for the K edges. A brass sample holder with Kapton windows and a flexible polymeric spacer (VITON) was used. Standard procedures were applied for pre-edge subtraction and data normalization in order to isolate the EXAFS function (χ). The EXAFS oscillations, isolated by a smoothing spline using the program VIPER, were k4-weighed and Fourier transformed using a Gaussian rounded ends window function.24 The data were fitted in R + Δ (Å) space using the ab initio code FEFF 7.0, which was used to calculate the theoretical phase and amplitude functions of the model that was subsequently used in the non-linear least-squares refinement of the experimental data.25 The input used for FEFF 7.0 was manually constructed and consisted of the targeted lanthanide in the centre position, with one bidentate nitrate in its first coordination sphere at a distance corresponding to lanthanide pentanitrato crystal structures.26 Estimated errors are shown between parentheses and calculated by VIPER. The amplitude reduction factor S0 was fixed at 0.9 for the La and Ce samples and at 1.1 for all other samples. [P66614]3[LuCl6] was used as a reference compound and was prepared by dissolving 100 mg of LuCl3·6H2O in 5 mL Cyphos IL 101 and drying at a Schlenk line for two days at 60 °C.
443 eV). The measurements were done in transmission mode using Ar/He gas filled ionization chambers at ambient pressure for the LIII edges and Ar/Kr filled ionization chambers for the K edges. A brass sample holder with Kapton windows and a flexible polymeric spacer (VITON) was used. Standard procedures were applied for pre-edge subtraction and data normalization in order to isolate the EXAFS function (χ). The EXAFS oscillations, isolated by a smoothing spline using the program VIPER, were k4-weighed and Fourier transformed using a Gaussian rounded ends window function.24 The data were fitted in R + Δ (Å) space using the ab initio code FEFF 7.0, which was used to calculate the theoretical phase and amplitude functions of the model that was subsequently used in the non-linear least-squares refinement of the experimental data.25 The input used for FEFF 7.0 was manually constructed and consisted of the targeted lanthanide in the centre position, with one bidentate nitrate in its first coordination sphere at a distance corresponding to lanthanide pentanitrato crystal structures.26 Estimated errors are shown between parentheses and calculated by VIPER. The amplitude reduction factor S0 was fixed at 0.9 for the La and Ce samples and at 1.1 for all other samples. [P66614]3[LuCl6] was used as a reference compound and was prepared by dissolving 100 mg of LuCl3·6H2O in 5 mL Cyphos IL 101 and drying at a Schlenk line for two days at 60 °C.


![[thin space (1/6-em)]](https://www.rsc.org/images/entities/char_2009.gif) :
:![[thin space (1/6-em)]](https://www.rsc.org/images/entities/char_2009.gif) 1 A/O phase ratio with an aqueous solution containing an excess of lanthanide (0.5 mol L−1) at varying nitrate concentrations (between 0 and 8 mol L−1). La3+ and Ho3+ were arbitrarily selected as representatives for the light and heavy lanthanides, respectively. A comparison between Ca(NO3)2 and NH4NO3 was made to evaluate the influence of the salting-out effect of the cation. The results are summarized in Fig. 8. The theoretical lanthanide concentration in the organic phase in case of pentanitrato complex formation was calculated to be approximately 0.7 mol kg−1. For the formation of hexanitrato complexes, the concentration would be around 0.5 mol kg−1. The loading curve of La3+ extracted from NH4NO3 does not approach the line of either the penta- or hexanitrato complex which means that NH4NO3 is not a good salting-out agent to fully extract the lanthanide ions. Ammonium ions have only weak salting-out or even salting-in properties.39 Therefore, the results were compared with extraction from Ca(NO3)2 solution, since Ca2+ is a much better salting-out agent. The metal loading in the organic phase indeed increased significantly. A plateau value was reached for Ho3+, but not for La3+, indicating that a maximum might not be reached for La3+. The maximum loading of Ho3+ reached the theoretical value of the formation of a pentanitrato complex, while the loading of La3+ was slightly higher than the theoretical value for the formation of hexanitrato complexes. In any case, the results show that conditions close to maximum loading of both lanthanide ions were reached by salting-out with a Ca(NO3)2 solution with a concentration higher than 3 mol L−1.
1 A/O phase ratio with an aqueous solution containing an excess of lanthanide (0.5 mol L−1) at varying nitrate concentrations (between 0 and 8 mol L−1). La3+ and Ho3+ were arbitrarily selected as representatives for the light and heavy lanthanides, respectively. A comparison between Ca(NO3)2 and NH4NO3 was made to evaluate the influence of the salting-out effect of the cation. The results are summarized in Fig. 8. The theoretical lanthanide concentration in the organic phase in case of pentanitrato complex formation was calculated to be approximately 0.7 mol kg−1. For the formation of hexanitrato complexes, the concentration would be around 0.5 mol kg−1. The loading curve of La3+ extracted from NH4NO3 does not approach the line of either the penta- or hexanitrato complex which means that NH4NO3 is not a good salting-out agent to fully extract the lanthanide ions. Ammonium ions have only weak salting-out or even salting-in properties.39 Therefore, the results were compared with extraction from Ca(NO3)2 solution, since Ca2+ is a much better salting-out agent. The metal loading in the organic phase indeed increased significantly. A plateau value was reached for Ho3+, but not for La3+, indicating that a maximum might not be reached for La3+. The maximum loading of Ho3+ reached the theoretical value of the formation of a pentanitrato complex, while the loading of La3+ was slightly higher than the theoretical value for the formation of hexanitrato complexes. In any case, the results show that conditions close to maximum loading of both lanthanide ions were reached by salting-out with a Ca(NO3)2 solution with a concentration higher than 3 mol L−1.


