 Open Access Article
Creative Commons Attribution 3.0 Unported Licence
Novel pH-responsive and self-assembled nanoparticles based on Bletilla striata polysaccharide: preparation and characterization
Junxiao Zhuab,
Xiaoxi Guoac,
Tingting Guoab,
Ye Yang ab,
Xiuming Cuiab,
Jun Pand,
Yuan Quab and
Chengxiao Wang
 *ab
*ab
aFaculty of Life Science and Technology, Kunming University of Science and Technology, Kunming 650500, China. E-mail: wcx1192002@126.com
bKey Laboratory of Sustainable Utilization of Panax Notoginseng Resources of Yunnan Province, Kunming 650500, China
cUniversity Based Provincial Key Laboratory of Screening and Utilization of Targeted Drugs, Kunming 650500, China
dInstitute of Food Science and Technology, Yunnan Provincial Academy of Agricultural Sciences, Kunming 650205, China
First published on 3rd December 2018
Abstract
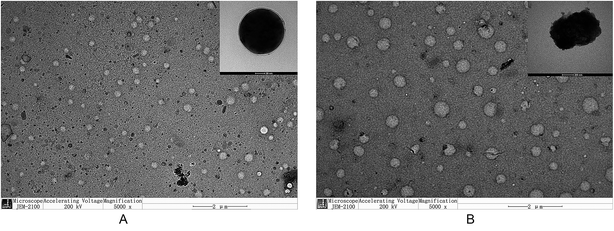
In this investigation, innovative pH-sensitive and amphiphilic nanoparticles (NPs) were synthesized by grafting histidine (His, pH sensitive molecule) and stearic acid (SA, hydrophobic segment) onto the polysaccharides of Bletilla striata (BSP). The His-SA-BSP was able to self-assemble into NPs with pH sensitivity. The acidic conditions could trigger the imidazole ionization and reverse the surface charge, while the electrostatic repulsion wrecked the structure and drove the NPs to a swollen state, as revealed by dynamic light scattering (DLS), transmission electron microscopy (TEM), and critical micelle concentration (CMC) analyses. By increasing the degree of substitution (DS) of His, the NPs showed improved pH sensitivity. The NPs could accelerate Doxorubicin (Dox) release to a remarkably greater extent (3-fold) at pH 5 than at pH 7.4. The CCK-8 assay demonstrated a good biocompatibility of the NPs towards different cell lines and a specific inhibition effect of Dox-loaded NPs against tumor cells. Furthermore, the NPs showed the improved cellular uptake of Dox towards MCF-7 by fluorescence microscopy and flow cytometry. Therefore, the new His-SA-BSP showed potential applications in drug nanocarrier systems.
Introductions
Polysaccharides have attracted increasing attention as smart nanoparticles (NPs)1,2 in drug delivery systems, particularly since they can be obtained in a well characterized and reproducible way from natural sources.3 Due to their biodegradable and hydrophilic nature, PS are usually grafted with small hydrophobic molecules or polymers to form the amphipathic skeleton of the NPs. Additionally, the varieties of the active groups (hydroxyl, amine, and carboxylic acid groups) existing along the PS chains can be modified with different substituents to provide various and multiple functions.4,5 If properly designed, smart self-assembly NPs can be prepared with the desired sizes and endogenous/extraneous stimuli-response properties for targeted drug delivery.6,7Bletilla striata polysaccharides (BPS) are extracts from the tubers of Bletilla striata, which is a neutral water-soluble glucomannan known to exhibit the therapeutic effects of anti-fibrosis,8 anti-tyrosinase9 and immunoregulation.10,11 It is widely accepted that BPS predominantly consists of glucomannan, with a backbone of (1 → 4)-β-D-mannose and glucose at molar ratio of 3![[thin space (1/6-em)]](https://www.rsc.org/images/entities/char_2009.gif) :
:![[thin space (1/6-em)]](https://www.rsc.org/images/entities/char_2009.gif) 1.12 This polysaccharide is a promising material for drug delivery systems. By physical blending or crosslinking, BSP could be introduced into the drug delivery carriers of microspheres,13 hydrogels14 and so on. The abundant hydroxyl groups in BPS allowed the modification of either the functional molecules10,15 or active ingredients.16 Among these, the amphiphilic grafted BSP is highly valued for the self-assembly properties. By linking cholesteryl succinate17 or fatty acid18 to BSP, amphiphilic NPs could be formed in aqueous solutions within the size range of 250 to 400 nm. The NPs possessed hepatic targeting capabilities19 and were designed as the nanocarriers for cancer therapy.20,21 Furthermore, the BSP derivatives can be used for cancer immunotherapy due to its affinity to the tumor associated macrophages.16,22
1.12 This polysaccharide is a promising material for drug delivery systems. By physical blending or crosslinking, BSP could be introduced into the drug delivery carriers of microspheres,13 hydrogels14 and so on. The abundant hydroxyl groups in BPS allowed the modification of either the functional molecules10,15 or active ingredients.16 Among these, the amphiphilic grafted BSP is highly valued for the self-assembly properties. By linking cholesteryl succinate17 or fatty acid18 to BSP, amphiphilic NPs could be formed in aqueous solutions within the size range of 250 to 400 nm. The NPs possessed hepatic targeting capabilities19 and were designed as the nanocarriers for cancer therapy.20,21 Furthermore, the BSP derivatives can be used for cancer immunotherapy due to its affinity to the tumor associated macrophages.16,22
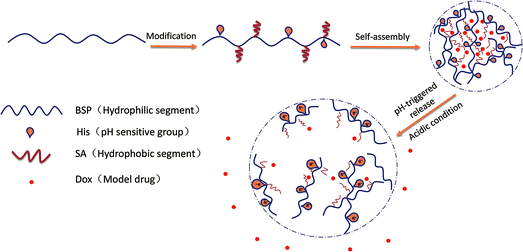
In our previous work, BSP was prepared and used as a framework of hydrogel. The examined BSP-hydrogel had displayed skin permeation enhancements and hemostatic activities for transdermal drug delivery.23 In the current study, ingenious NPs with pH sensitive profiles were designed. The purified BSP were first modified by histidine (His-BSP), a commonly used function molecular for pH sensitivity.2,24,25 After that, stearic acid (SA) was introduced into the chain using a simple esterification method in order to provide the hydrophobic segment.18 The obtained His-SA-BSP were evaluated including self-assembly behaviors, pH sensitivities and pH-triggered release profiles of Doxorubicin (Dox) (Fig. 1). Additionally, cytotoxicity assays as well as the in vitro cellular uptake of Dox were performed. The results of this study can potentially provide valuable data and approaches for the molecular designs of novel NPs based on the natural polysaccharides.
Materials and methods
Materials
The dried tubers of Bletillastriata were provided by the Liangbao Co., Ltd. (Yunnan, China). The L-histidine (L-His, >99%); 1-ethyl-3-(3-dimethylaminopropyl) carbodiimide (EDC, >98.5%); N-hydroxysuccinimide (NHS, >98.5%); N,N′-dicyclohexylcarbodiimide (DCC, >99%); and dimethylaminopyridine (DMAP, >99%) were purchased from the Sigma Chemical Co. (USA). Doxorubicin was purchased from Shanghai HuaLan Chemical Technology Co., Ltd, China (USP, ≥98%, DB3456-100 mg). The other chemicals used in this study were of analytic grade and supplied by the Sinopharm Chemical Reagent Co., Ltd (Shanghai, China).Preparation of the BSP
The extraction and purification processes of BSP was referred to our previous work with some modifications.23 In brief, the tubers (200 g) were smashed (YC-06B micronizer, Jinben, China) and thermo-extracted twice in 4 L distilled water (70 °C, 3 hours). After filtration, the aqueous extracts were condensed to a 1/3 volume of the primary liquid by a rotary evaporator (N-1300S-W, EYELA, Japan) and then precipitated with 95% ethanol to a final concentration of 75%. The precipitates were collected by a centrifuge (H1850R, Hunan Xiangyi Co., Ltd. China) to obtain the crude BSP. The protein was removed by the Sevag reactions. After that, the BSP was applied to a DEAE–(Cl−)–cellulose-52 (4 × 40 cm) column and a Sephadex G-200 (1.6 × 80 cm) column for purification (0.1 mol L−1 NaCl, 20 mL h−1). After dialysis (MWCO 3500, Sigma) and lyophilization (Scientz-10ND, Ning bo Scientz Co., Ltd. China), the purified BSP was obtained.Synthesis of the His-SA-BSP
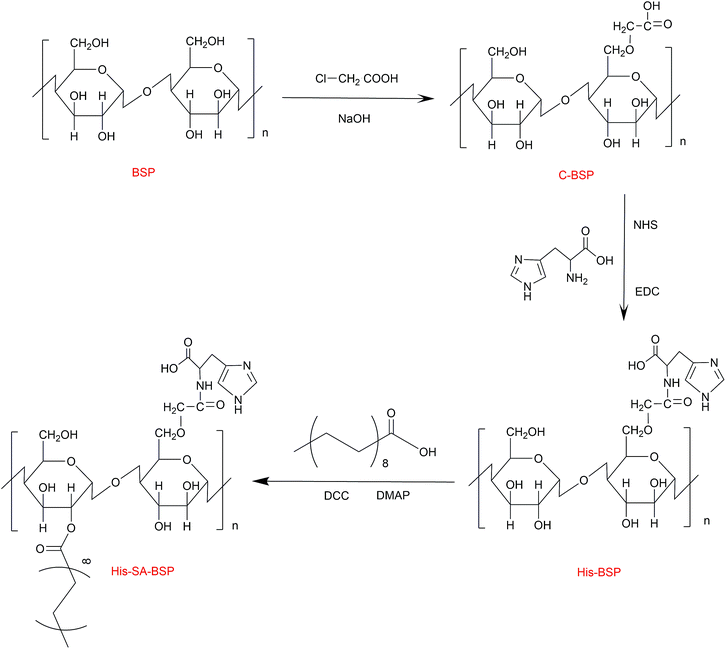
The synthesis scheme of the His-SA-BSP was shown in Fig. 2, which included three steps as follows: first, the C-6 hydroxyl group of the monosaccharide units was activated by carboxymethylation reaction; second, the L-histidine was reacted with the carboxymethyl group; and the third step was the grafting of the fatty acid chain onto the His-BSP by esterification.Characterization
Preparation of the NPs
Characterization
The morphologies of the NPs were observed using transmission electron microscopy (TEM). One droplet of NPs was placed on a carbon-coated copper grid, and the excess solution was removed with filter paper. Then, the morphology of the NPs was examined and photographed (JEM-2100, JEOL Ltd., Japan). In addition, the mean particle sizes, size distribution, as well as the zeta potential were determined by dynamic light scattering analysis (90 Plus, Brookhaven Instruments Co., USA).Critical micelle concentration (CMC)
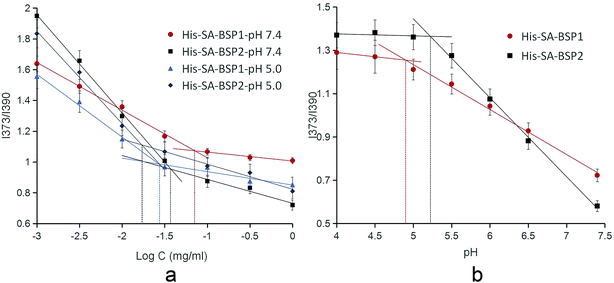
The critical micelle concentrations (CMC) of the NPs were determined by fluorescence spectroscopy, using pyrene as a fluorescent probe. A certain concentration of pyrene–acetone solution was prepared and evaporated to remove the solvent. Then, 10 mL of the His-SA-BSP suspension at various concentrations were added and shaken overnight. The final concentration of pyrene was fixed at 1.0 × 10⁻⁶ mg mL−1. Then a fluorescence spectrophotometer (970CRT, Shanghai Precision Instrument Co., Ltd. China) was used to measure the steady-state fluorescence spectra with excitation wavelength of 332 nm and the emission spectra ranged from 320 to 450 nm. The ratio of the intensity at 373 nm (I373) to that at 390 nm (I390) was calculated and plotted against the common logarithm of the His-SA-BSP concentration. The CMC was determined at the turning point in the plot.XRD evaluation
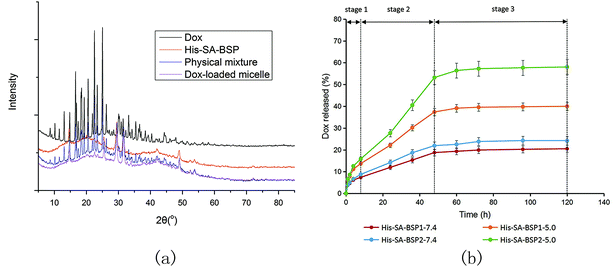
The crystalline state of Dox, His-SA-BSP, physical mixture and drug-loaded NPs were measured by an X-ray powder diffraction instrument (XRD-6000, Shimadzu, Japan) at 40 mA and 40 kV. Standard runs were performed with a scanning rate of 0.02° min−1 over a 2θ range of 3 to 85°.Drug release profile
The Dox-NPs were weighed and dissolved in 5 mL of phosphate buffered saline (PBS) solution of various pH values (pH 7.4 and 5.0), and then transferred for dialysis. 25 mL of PBS (pH 7.4 or 5.0 respectively) was added into the outer solution to initiate the release (37 °C, 100 rpm). At predetermined time points, 3 mL of the release solution was collected and the same volume of fresh solution was added. The amount of released DOX was determined and the release curves were plotted.Cell culture
Three tumor cell lines, HepG2 (liver hepatocellular carcinoma cell line), MCF-7 (human breast adenocarcinoma cell line), HGC-27 (human gastric carcinoma cell line) and a normal cell lines, HL-7702 (normal liver cell line) were kindly provided by Yunnan Labreal Biotechnology Co., Ltd. The cells were cultured in DMEM or 1640 mediums at 37 °C in a humidity atmosphere with 5% CO2. The medium was supplemented with 10% FBS, 100 μg mL−1 streptomycin and 100 mL−1 penicillin.Cytotoxicity
CCK-8 (cell counting kit-8) assay was employed to assess the cytotoxicity of blank NPs against the four cells. Cells were seeded onto 96-well plates (2.5 × 10³ cells per well) and cultured for 24 hours. Then the cells were exposed to fresh medium containing series concentration of blank His-SA-BSP2 NPs and incubation for 48 hours. CCK-8 solution (10 μL) was then added into each well and further incubated (2 hours, 37 °C). A microplate reader (SM600, Shanghai UtraoMedical Instrument Co., Ltd) was employed to measure the absorbance (450 nm). The cell viability was calculated as follows:20where ODsample represented OD measured in cells under the treatment of NPs; ODcontrol represented the OD measured from the cells treated with incubation solution and ODblank is the OD of incubation solution alone.
Moreover, the IC50 value of each group was then calculated using SPSS 19.0 (Chicago, IL, USA).
Tumor cell inhibition
To evaluate the effect of Dox-loaded NPs on the tumor cell, the three tumor cells were co-cultured with the Dox-loaded NPs solution (His-SA-BSP2, containing 5 μg mL−1 or 10 μg mL−1 Dox). Dox solutions (5 μg mL−1 or 10 μg mL−1) were set as comparisons. The experiments were conducted using CCK-8 assay as detailed above.Cell uptake
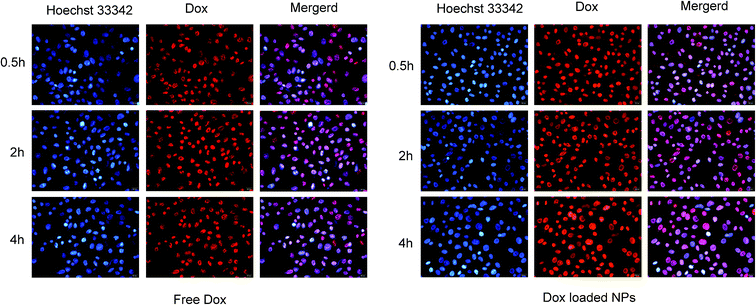
![[thin space (1/6-em)]](https://www.rsc.org/images/entities/char_2009.gif) 342 was used to visualize the nuclei (10 μg mL−1, 15 min).25 Afterwards, cells were examined by fluorescence microscopy (IX51, Olympus).
342 was used to visualize the nuclei (10 μg mL−1, 15 min).25 Afterwards, cells were examined by fluorescence microscopy (IX51, Olympus).Results and discussion
Preparation and characterization of BSP
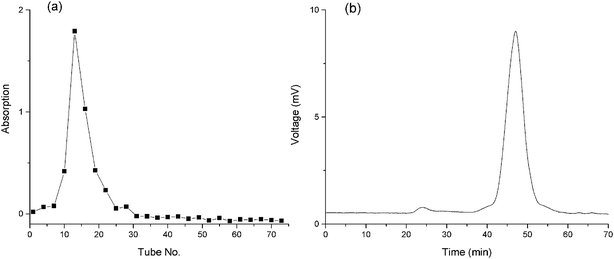
Aqueous extractions reinforced by thermal treatments are commonly used as the extraction strategy of plant polysaccharides due to the economical nature and convenience of use.33 The extraction yield of crude BSP was 18.3%. After Sevag reaction, the BSP was further purified using DEAE and G-200 columns. A single and symmetrical peak was detected and collected (Fig. 3a) by the phenol-sulfuric acid method and HPGPC (Fig. 3b), which indicated a homogeneous material with molecular weight of 176 kDa. The yield of the final product was determined to be 33.8% based upon the crude BSP.We have demonstrated that the BSP was composed of mannose and glucose, with a relative mole ratio of 2.8![[thin space (1/6-em)]](https://www.rsc.org/images/entities/char_2009.gif) :
:![[thin space (1/6-em)]](https://www.rsc.org/images/entities/char_2009.gif) 1.23 In the current work, the structural information of BSP was revealed by the FTIR (Fig. 4a) and NMR spectrums (Fig. 5a). The characteristic absorptions at 812 cm−1 and 875 cm−1 confirmed the existence of mannose (Kong et al. 2015). Additionally, the presence of pyranose was determined at 1028 cm−1. Further structural features were determined using 13C-NMR and 1H-NMR spectroscopy (Fig. 5a). Assignments of the chemical shifts were compared with the published data,8,17 and listed in Table 1.
1.23 In the current work, the structural information of BSP was revealed by the FTIR (Fig. 4a) and NMR spectrums (Fig. 5a). The characteristic absorptions at 812 cm−1 and 875 cm−1 confirmed the existence of mannose (Kong et al. 2015). Additionally, the presence of pyranose was determined at 1028 cm−1. Further structural features were determined using 13C-NMR and 1H-NMR spectroscopy (Fig. 5a). Assignments of the chemical shifts were compared with the published data,8,17 and listed in Table 1.
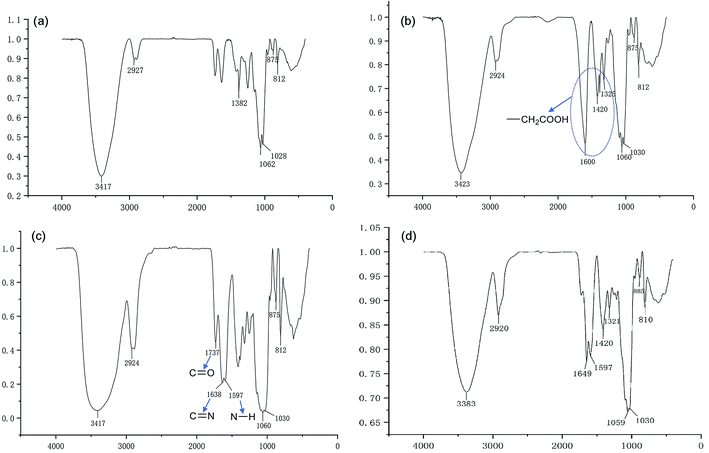 | ||
| Fig. 4 FT-IR characterization of BSP and its derivatives. (a) BSP; (b) C-BSP; (c) His-BSP; (d) His-SA-BSP. | ||
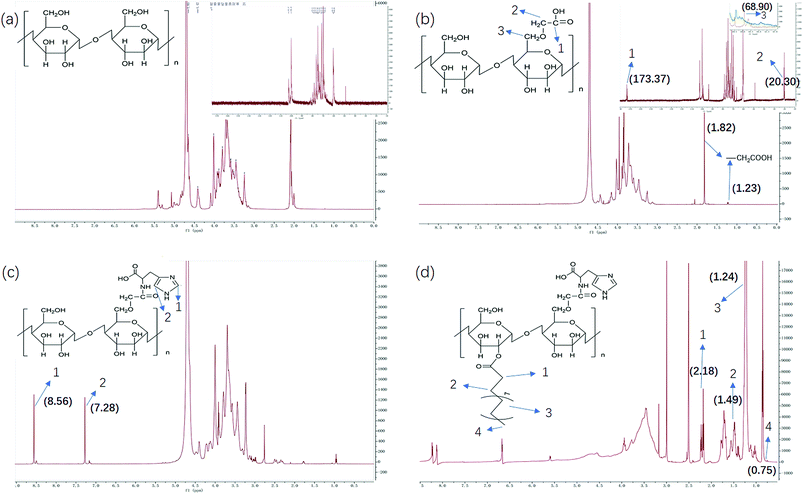 | ||
| Fig. 5 NMR characterization of BSP and its derivatives. (a) BSP; (b) C-BSP; (c) His-BSP; (d) His-SA-BSP. | ||
| Sugar residues | Chemical shifts δ (ppm) | ||||||
|---|---|---|---|---|---|---|---|
| 1 | 2 | 3 | 4 | 5 | 6 | ||
| →4)-β-D-Man-(1→ | 13C | 100.10 | 69.93 | 71.40 | 76.49 | 74.99 | 60.47 |
| 1H | 4.64 | 4.02 | 3.67 | 3.71 | 3.45 | 3.80 | |
| →4)-β-D-Glc-(1→ | 13C | 102.47 | 72.18 | 75.15 | 78.44 | 74.63 | 60.08 |
| 1H | 4.41 | 3.24 | 3.60 | 3.51 | 3.59 | 3.88 | |
Synthesis and characterization of His-SA-BSP
![[double bond, length as m-dash]](https://www.rsc.org/images/entities/char_e001.gif) O) and 20.30 ppm (–CH2–) evidenced the carboxymethylation reaction. Furthermore, the peaks of C6 shift from 60 to 68.90 ppm, while no shifts were observed for signals of C2–C5. It suggested that C6 was the primary carbon for the carboxymethylation reaction.27,34 In addition, the FT-IR peak (Fig. 4b) at 1600, 1420 and 1325 evidenced the existing of –CH2COOH.27
O) and 20.30 ppm (–CH2–) evidenced the carboxymethylation reaction. Furthermore, the peaks of C6 shift from 60 to 68.90 ppm, while no shifts were observed for signals of C2–C5. It suggested that C6 was the primary carbon for the carboxymethylation reaction.27,34 In addition, the FT-IR peak (Fig. 4b) at 1600, 1420 and 1325 evidenced the existing of –CH2COOH.27![[double bond, length as m-dash]](https://www.rsc.org/images/entities/char_e001.gif) N and N–H deformation vibration in His appeared at 1638 and 1597 cm−1,35 respectively. All the results suggested the successful synthesis of His-BSP.
N and N–H deformation vibration in His appeared at 1638 and 1597 cm−1,35 respectively. All the results suggested the successful synthesis of His-BSP.His and its polymer are often used as the pH sensitive moieties in NPs.2,24,36 The His was pre-protected by t-butyloxycarbonyl and 2,4-dinitrophenol, and then subjected to esterification with the hydroxyl of the monose. Although the reaction was effective, the site of His could not be clearly assigned. Therefore, we provided a new strategy for His modification in the current study. The BSP was subjected to carboxymethylation in advance at in the C-6 site. Then, His can be introduced to the specific locations by the reaction between the amino and the carboxyl groups. By control the His/C-BPS ratio, different DS can be achieved.
Preparation and characterization of NPs
The His-SA-BSP underwent the entropy-driven self-assembly processes in aqueous solution, which was comprised of a double phase separation: the separation of the SA from the water, and the intra-molecular separation of the BSP from the hydrophobes. Geometrically, if a phase separation features a volumetric balance dominated by the hydrophile, high-curvature, water-dispersed objects, i.e. NPs will be formed.38 In the current work, His-SA-BSP with different His-DS was prepared and used (Table 2), namely His-SA-BSP1 (His-DS of 17.2%) and His-SA-BSP2 (His-DS of 29.7%).| His-SA-BSP1 | His-SA-BSP2 | |||||||||
|---|---|---|---|---|---|---|---|---|---|---|
| Size (nm) | PDI | Zeta potential (mV) | CMC (μg mL−1) | pHd | Size (nm) | PDI | Zeta potential (mV) | CMC (μg mL−1) | pHd | |
| pH 7.4 | 194.31 ± 5.21 | 0.189 ± 0.016 | −11.53 ± 1.17 | 70.79 | 4.9 | 214.99 ± 4.32 | 0.170 ± 0.014 | −12.30 ± 1.08 | 36.98 | 5.2 |
| pH 5.0 | 364.03 ± 7.14 | 0.195 ± 0.022 | 7.09 ± 0.84 | 27.54 | 427.59 ± 6.88 | 0.205 ± 0.019 | 12.36 ± 0.67 | 17.17 | ||
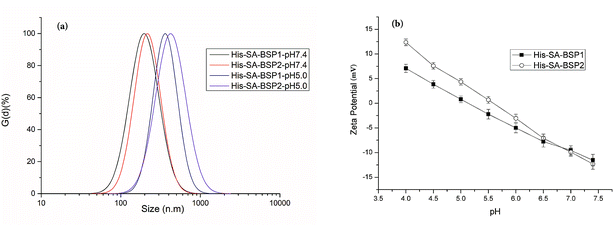 | ||
| Fig. 7 Dynamic light scattering analysis of His-SA-BSP NPs. (a) Size distribution; (b) zeta potential (n = 3). | ||
Zeta potential is crucial for the stability of the NPs. At a pH level of 7.4, the zeta potential of His-SA-BSP1 was approximately – 11 mV (Table 2 & Fig. 7b). When the pH decreased to 5.0, the value was reversed to 7 mV, implying that the NPs had the ability to change its zeta-potential in response to the environmental pH levels. For His-SA-BSP2, when the pH decreased from 7.4 to 5.0, the zeta potential reversed from −12 mV to 12 mV (Fig. 7b).
The pH-triggered changes in sizes and zeta potential were consistent with reported work.2,39–41 Guan et al. prepared pH-sensitive BSP micelles by stearic acid modification.20 The pH-sensitivity of the said micelles was attributed to the abundant negative charges carried by SA-BSP, along with the isoelectric point of the BSP. However, in our work, the pH-sensitive properties were mainly related to the specific His feature.40 His consists of an imidazole group, a carboxyl group, and an amino group with a pKa of 6.05.40 The electron lone pair on the unsaturated nitrogen of the imidazole ring made the His amphoteric by protonation–deprotonation.2 Therefore, the acidic conditions can trigger the imidazole ionization and drive the NPs into a swollen state. Once the ionized unimers repelled each other by the strong electrostatic repulsion, the NPs segments aggregated to the larger particles and became increasingly unstable.
The CMC is the main parameter to determine the thermodynamic stability of the micelles drug delivery systems.42 The CMC of the NPs were significantly lower than other surfactants,43 suggesting an improved structural integrity of NPs at low copolymer concentrations (even under extreme dilution) and a better stability.
The pH of disruption was referred to as the acidic dissociation pH (pHd) of the NPs.35 The pHd were 4.9 for His-SA-BSP1 and 5.2 for His-SA-BSP2, respectively (Table 2 and Fig. 9b), which further confirmed the influence of the His-segments on the pH-sensitivity.44
Evaluations of Dox-loaded NPs
The EE and LC of Dox-loaded NPs barely changed with the increasing of His segments. At the drug/carrier ratio of 1![[thin space (1/6-em)]](https://www.rsc.org/images/entities/char_2009.gif) :
:![[thin space (1/6-em)]](https://www.rsc.org/images/entities/char_2009.gif) 5, the EE was approximately 80% at a theoretical LC of 10% for the His-SA-BSP1 and was 12% for the His-SA-BSP2. In a reported work, a silymarin-loaded BSP NPs showed the EE of 78% with LC of 7%.19 Furthermore, Guan et al. prepared a series of docetaxel-loaded BSP micelles.20,21,45 With different drug/carrier ratios, the EE were ranged from 70 to 90%, and LC were from 4 to 15%, which was in agreement with our results.
5, the EE was approximately 80% at a theoretical LC of 10% for the His-SA-BSP1 and was 12% for the His-SA-BSP2. In a reported work, a silymarin-loaded BSP NPs showed the EE of 78% with LC of 7%.19 Furthermore, Guan et al. prepared a series of docetaxel-loaded BSP micelles.20,21,45 With different drug/carrier ratios, the EE were ranged from 70 to 90%, and LC were from 4 to 15%, which was in agreement with our results.
| pH 7.4 | pH 5.0 | |||||||
|---|---|---|---|---|---|---|---|---|
| Release rate (μg h−1) | Release percentage (%) | Release rate (μg h−1) | Release percentage (%) | |||||
| Stage 1 | Stage 2 | Stage 3 | Stage 1 | Stage 2 | Stage 3 | |||
| His-SA-BSP1 | 1.584 ± 0.172 | 0.469 ± 0.051 | 0.042 ± 0.003 | 20.512 ± 1.641 | 2.894 ± 0.215 | 1.002 ± 0.064 | 0.0608 ± 0.004 | 39.98 ± 1.799 |
| His-SA-BSP2 | 1.876 ± 0.155 | 0.567 ± 0.078 | 0.053 ± 0.005 | 24.159 ± 1.087 | 3.340 ± 0.192 | 1.579 ± 0.108 | 0.114 ± 0.011 | 58.04 ± 3.489 |
To verify the pH-responsive release profile as expected, the release behaviors of Dox from NPs under different pH environments were tested. The DOX cumulative releases from His-SA-BSP1 at pH values of 5.0 and 7.4 were 39.98% and 20.51% respectively, indicating that the acidic environments contributed to fast release rates. Additionally, the released percentage from His-SA-BSP2 was 58.04% (pH 5.0), further confirming the influences of His segment on the pH sensitivity. The interactions between the drug and carriers also contributed to the release efficiency. In the reported works,19,21 docetaxel and silymarin showed faster release profiles from BSP micelles than Dox, implying that Dox might have relatively high affinity to BSP.
In particular, the drug release mechanisms from pH-sensitive NPs can be classified into the following four types (1) the destruction of the amphipathic structures by the protonation or deprotonation of the polymers;47 (2) the separations of the polymer micelle amphiphilic blocks;48 (3) the expansions of the NPs related to the reduced hydrophobicity of the hydrophobic fragments;49 and (4) the breakage of the acid-labile bonds between the drugs and the NPs.50 As described in the previous section, the acidic environments boosted the protonation degree of imidazole, resulting in the expansion and destruction of the NP. Subsequently, the encapsulated Dox were released into the aqueous solutions.
Cytotoxicity assay
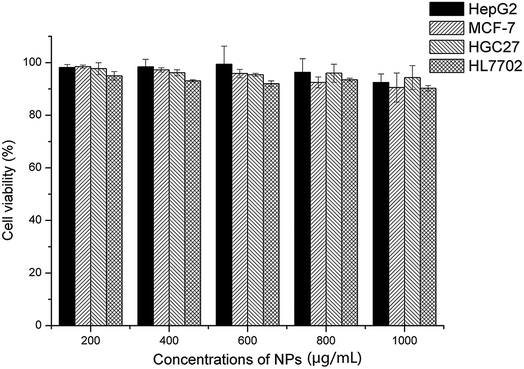
Four different cell lines, including three tumor cells (HepG2, MCF-7, HGC-27) and a normal cell (HL-7702), were employed to evaluate the cytotoxicity of the empty NPs, as shown in Fig. 11. The cell viability remained over 90% after incubation for 48 hours, even though the NPs concentration reached 1000 μg mL−1. In general, the cytotoxicity of the NPs was usually along with the length of the alkyl chain and the surface positive charge. In this work, the grafted BSP presented a medium length of alkyl chain at the SA segments, and the His group provided the negative charge at the normal pH level. As a result, the formed NPs showed little cytotoxicity. Furthermore, this finding was supported by Wang18 and Guan21 in their reported works.Tumor cell inhibition
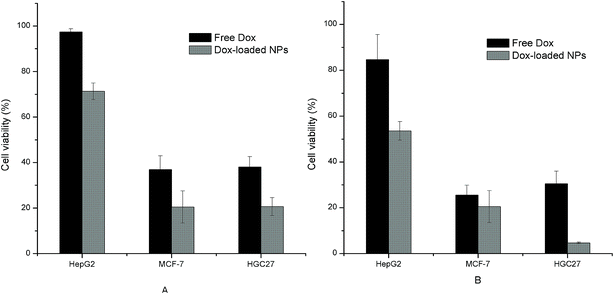
Both the free Dox and the Dox-loaded NPs showed inhibition effects on the three tumor cells with a dose-dependent manner, as shown in Fig. 12. The IC50 values of free Dox and Dox-loaded NPs towards each cell line were also calculated and listed in Table 4. It was observed from the results that the cell inhibition of NPs group had statistically difference compared with that of free Dox. The pH-sensitive NPs with small size were liable to directly penetrate into tumor cells through endocytosis, which suggested an enhancement against tumor cells. Furthermore, the differences in cell viability and IC50 observed among the three model cells may attributed to the differences in their cell physiologies and sensitivities.20| Group | IC50 (μg mL−1) | ||
|---|---|---|---|
| HepG2 | MCF-7 | HGC27 | |
| a The upper character suggested the statistic differences from other groups (p < 0.05). The Dox loading content was 12%. | |||
| Free Dox | 115.31 ± 8.89a | 4.02 ± 0.11b | 3.23 ± 0.07c |
| Dox-loaded NPs | 243.75 ± 12.57d | 32.51 ± 2.31e | 20.51 ± 1.67f |
Cell uptake
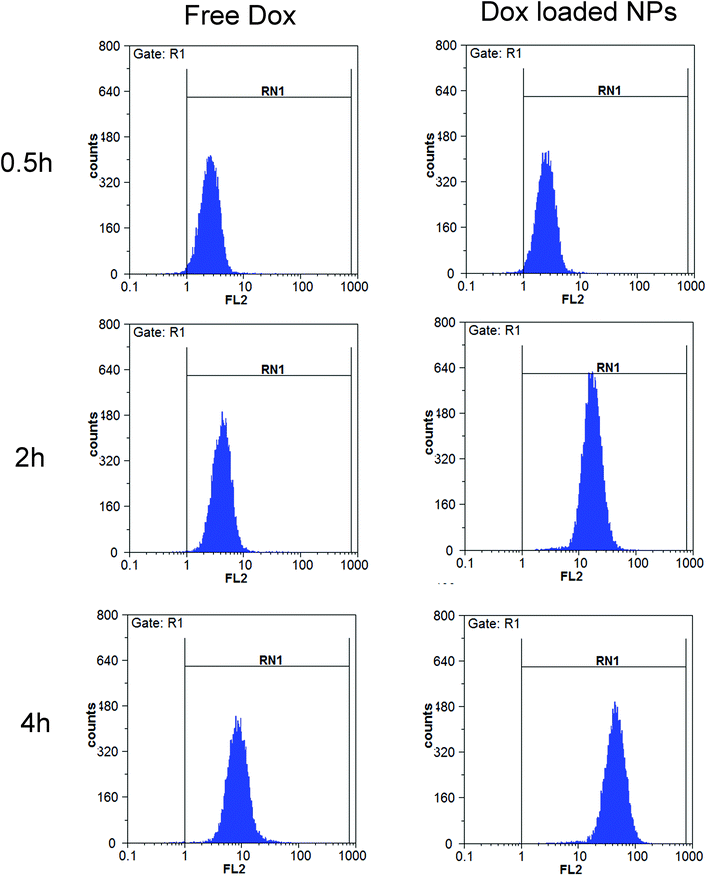 | ||
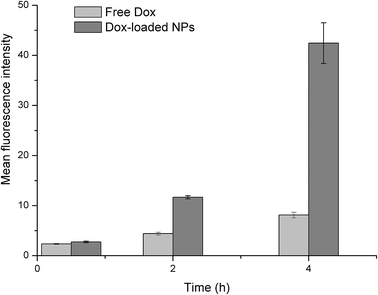
| Fig. 14 Flow cytometry measurement of the cellular uptake of free Dox (10 μg mL−1) and Dox-loaded NPs (containing 10 μg mL−1 Dox) in MCF-7 cells (n = 3). | ||
Conclusion
In the current work, novel pH-sensitive and amphiphilic His-SA-PS were successfully synthesized. The His-SA-BSP was found to have the ability to self-assemble into NPs in neutral solutions with sizes of approximately 200 nm. The CMC was found to range from 37 to 71 μg mL−1. It was observed that the acidic condition could trigger the expansion of the particle sizes (400 nm) and reverse the surface charge, which were related to the His segment. The acidic condition also boosted the release profiles of Dox from the NPs. The CCK-8 assay demonstrated a good biocompatibility of the carriers towards different cell lines and a specific inhibition effect of Dox-loaded NPs against tumor cells. Moreover, the NPs showed an enhancement on cellular uptake of Dox towards MCF-7 by fluorescence microscopy and flow cytometry. All of the aforementioned attributes implied that the His-SA-BSP displayed promising future potential applications in targeted and smart drug delivery systems.Conflicts of interest
There are no conflicts of interest to declare.Acknowledgements
This work was financial supported by the National Natural Science Foundation of China (No. 81760643) and Key technologies R&D program of Yunnan, China (No. 2018ZF011-2018110506). The authors are also grateful to ShenZhenBoRui Saccharide Biotech Co. Ltd. for the helpful discussion of our work.References
- Y. Yu, M. Shen, Q. Song and J. Xie, Carbohydr. Polym., 2018, 183, 91–101 CrossRef CAS.
- Y. Wang, P. Li, F. Chen, L. Jia, Q. Xu, X. Gai, Y. Yu, Y. Di, Z. Zhu, Y. Liang, M. Liu, W. Pan and X. Yang, Sci. Rep., 2017, 7, 4751 CrossRef PubMed.
- C. Alvarez-Lorenzo, B. Blanco-Fernandez, A. M. Puga and A. Concheiro, Adv. Drug Delivery Rev., 2013, 65, 1148–1171 CrossRef CAS PubMed.
- M. Kanamala, W. R. Wilson, M. Yang, B. D. Palmer and Z. Wu, Biomaterials, 2016, 85, 152–167 CrossRef CAS PubMed.
- M. Swierczewska, H. S. Han, K. Kim, J. H. Park and S. Lee, Adv. Drug Delivery Rev., 2016, 99, 70–84 CrossRef CAS PubMed.
- S. Mura, J. Nicolas and P. Couvreur, Nat. Mater., 2013, 12, 991–1003 CrossRef CAS.
- K. Ganguly, K. Chaturvedi, U. A. More, M. N. Nadagouda and T. M. Aminabhavi, J. Controlled Release, 2014, 193, 162–173 CrossRef CAS PubMed.
- Y. Wang, D. Liu, S. Chen, Y. Wang, H. Jiang and H. Yin, Fitoterapia, 2014, 92, 72–78 CrossRef CAS PubMed.
- Y. Ye, G.-X. Chou, D.-D. Mu, H. Wang, J.-H. Chu, A. K.-M. Leung, W.-f. Fong and Z.-L. Yu, J. Ethnopharmacol., 2010, 129, 387–390 CrossRef CAS PubMed.
- L. Dong, S. Xia, Y. Luo, H. Diao, J. Zhang, J. Chen and J. Zhang, J. Controlled Release, 2009, 134, 214–220 CrossRef CAS.
- C. Wang, J. Sun, Y. Luo, W. Xue, H. Diao, L. Dong, J. Chen and J. Zhang, Biotechnol. Lett., 2006, 28, 539–543 CrossRef CAS PubMed.
- Y. Wang, J. Liu, Q. Li, Y. Wang and C. Wang, Biotechnol. Lett., 2015, 37, 1–8 CrossRef PubMed.
- K. Liu, Z. Feng, L. Shan, T. Yang, M. Qin, J. Tang and W. Zhang, Drying Technol., 2017, 35, 1629–1643 CrossRef CAS.
- Y. Luo, H. Diao, S. Xia, L. Dong, J. Chen and J. Zhang, J. Biomed. Mater. Res., Part A, 2010, 94, 193–204 CrossRef PubMed.
- J. Y. Liu, H. C. Wang, Y. Yin, N. Li, P. L. Cai and S. L. Yang, Carbohydr. Polym., 2012, 89, 158–162 CrossRef CAS PubMed.
- X. Zhan, L. Jia, Y. Niu, H. Qi, X. Chen, Q. Zhang, J. Zhang, Y. Wang, L. Dong and C. Wang, Biomaterials, 2014, 35, 10046–10057 CrossRef CAS PubMed.
- M. Zhang, L. Sun, W. Zhao, X. Peng, F. Liu, Y. Wang, Y. Bi, H. Zhang and Y. Zhou, Molecules, 2014, 19, 9089–9100 CrossRef PubMed.
- W. Wang, S. He, T. Hong, Y. Zhang, H. Sui, X. Zhang and Y. Ma, Artif. Cells, Nanomed., Biotechnol., 2017, 45, 69–75 CrossRef CAS PubMed.
- Y. Ma, S. He, X. Ma, T. Hong, Z. Li, K. Park and W. Wang, Molecules, 2016, 21, 265 CrossRef.
- L. Zhao, D. Sun, H. Lu, B. Han, G. Zhang and Q. Guan, J. Pharm. Pharmacol., 2018, 70, 797–807 CrossRef CAS.
- Q. Guan, D. Sun, G. Zhang, C. Sun, M. Wang, D. Ji and W. Yang, Molecules, 2016, 21, 1641–1657 CrossRef CAS.
- Z. Huang, J. Gan, Z. Long, G. Guo, X. Shi, C. Wang, Y. Zang, Z. Ding, J. Chen, J. Zhang and L. Dong, Biomaterials, 2016, 90, 72–84 CrossRef CAS.
- X. Cui, X. Zhang, Y. Yang, C. Wang, C. Zhang and G. Peng, Pharm. Dev. Technol., 2017, 22, 1001–1011 CrossRef CAS.
- T. A. Debele, S. L. Mekuria and H. C. Tsai, Int. J. Biol. Macromol., 2017, 98, 125–138 CrossRef CAS.
- L. Qiu, Z. Li, M. Qiao, M. Long, M. Wang, X. Zhang, C. Tian and D. Chen, Acta Biomater., 2014, 10, 2024–2035 CrossRef CAS.
- Z. Chen, M. Xin and C. Li, Polym. Mater. Sci. Eng., 2013, 29, 152–156 Search PubMed.
- Y. Li, Y. Yuan, L. Lei, F. Li, Y. Zhang, J. Chen, G. Zhao, S. Wu, R. Yin and J. Ming, Carbohydr. Polym., 2017, 172, 85–92 CrossRef CAS PubMed.
- Y. Wu, M. Ye, Z. Du, L. Jing, M. Surahio and L. Yang, Carbohydr. Polym., 2014, 114, 190–195 CrossRef CAS.
- Z. M. Dos Santos, A. L. Caroni, M. R. Pereira, D. R. da Silva and J. L. Fonseca, Carbohydr. Res., 2009, 344, 2591–2595 CrossRef CAS.
- E. Calce, F. A. Mercurio, M. Leone, M. Saviano and S. De Luca, Carbohydr. Polym., 2016, 143, 84–89 CrossRef CAS PubMed.
- X. Wu, X. Chen, P. Hu, M. Hou, Y. Dong and Y. Wei, Carbohydr. Polym., 2018, 191, 136–141 CrossRef CAS.
- W. Lin, Y. He, J. Zhang, L. Wang, Z. Wang, F. Ji and S. Chen, Colloids Surf., B, 2014, 115, 384–390 CrossRef CAS PubMed.
- D. Campos, R. Chirinos, O. Barreto, G. Noratto and R. Pedreschi, Ind. Crops Prod., 2013, 49, 747–754 CrossRef CAS.
- D. A. Silva, R. C. M. de Paula, J. P. A. Feitosa, A. C. F. de Brito, J. S. Maciel and H. C. B. Paula, Carbohydr. Polym., 2004, 58, 163–171 CrossRef CAS.
- S. Jafarzadeh-Holagh, S. Hashemi-Najafabadi, H. Shaki and E. Vasheghani-Farahani, J. Colloid Interface Sci., 2018, 523, 179–190 CrossRef CAS.
- E. S. Lee, Z. Gao, D. Kim, K. Park, I. C. Kwon and Y. H. Bae, J. Controlled Release, 2008, 129, 228–236 CrossRef CAS.
- L. Kong, L. Yu, T. Feng, X. Yin, T. Liu and L. Dong, Carbohydr. Polym., 2015, 125, 1–8 CrossRef CAS PubMed.
- X. Yang, X. Shi, R. D'Arcy, N. Tirelli and G. Zhai, J. Controlled Release, 2018, 272, 114–144 CrossRef CAS PubMed.
- C. A. Kumar Varma and K. Jayaram Kumar, Carbohydr. Polym., 2017, 175, 502–508 CrossRef CAS PubMed.
- Y. Sun, Y. Li, S. Nan, L. Zhang, H. Huang and J. Wang, J. Colloid Interface Sci., 2015, 458, 119–129 CrossRef CAS PubMed.
- W. Yoo, D. Yoo, E. Hong, E. Jung, Y. Go, S. V. B. Singh, G. Khang and D. Lee, J. Controlled Release, 2018, 269, 235–244 CrossRef CAS PubMed.
- H. Wu, L. Zhu and V. P. Torchilin, Biomaterials, 2013, 34, 1213–1222 CrossRef CAS PubMed.
- H. J. Cho, H. Y. Yoon, H. Koo, S. H. Ko, J. S. Shim, J. H. Lee, K. Kim, I. C. Kwon and D. D. Kim, Biomaterials, 2011, 32, 7181–7190 CrossRef CAS PubMed.
- B. Tang, J. L. Zaro, Y. Shen, Q. Chen, Y. Yu, P. Sun, Y. Wang, W. C. Shen, J. Tu and C. Sun, J. Controlled Release, 2018, 279, 147–156 CrossRef CAS PubMed.
- Q. Guan, G. Zhang, D. Sun, Y. Wang, K. Liu, M. Wang, C. Sun, Z. Zhang, B. Li and J. Lv, PLoS One, 2017, 12, e0173172 CrossRef PubMed.
- P. Mukhopadhyay, S. Maity, S. Mandal, A. S. Chakraborti, A. K. Prajapati and P. P. Kundu, Carbohydr. Polym., 2018, 182, 42–51 CrossRef CAS PubMed.
- G. H. Gao, Y. Li and D. S. Lee, J. Controlled Release, 2013, 169, 180–184 CrossRef CAS PubMed.
- Y. Zhang, P. Li, H. Pan, L. Liu, M. Ji, N. Sheng, C. Wang, L. Cai and Y. Ma, Biomaterials, 2016, 83, 219–232 CrossRef CAS PubMed.
- W. Chen, F. Meng, R. Cheng and Z. Zhong, J. Controlled Release, 2010, 142, 40–46 CrossRef CAS PubMed.
- Y. Gu, Y. Zhong, F. Meng, R. Cheng, C. Deng and Z. Zhong, Biomacromolecules, 2013, 14, 2772–2780 CrossRef CAS PubMed.
- S. Yang, Z. Tang, D. Zhang, M. Deng and X. Chen, Biomater. Sci., 2017, 5, 2169–2178 RSC.
| This journal is © The Royal Society of Chemistry 2018 |

