DOI:
10.1039/C8RA07345G
(Paper)
RSC Adv., 2018,
8, 34860-34866
Specific colorimetric detection of Fe3+ ions in aqueous solution by squaraine-based chemosensor†
Received
3rd September 2018
, Accepted 2nd October 2018
First published on 11th October 2018
Abstract
A new squaraine based chemosensor TSQ was developed for colorimetric detection of Fe3+ ions. A thymine moiety in TSQ was constructed to act as an ion acceptor. The sensor displayed an instant colorimetric response specific to Fe3+ over the other metal ions in 20% AcOH–H2O solution. The limit of detection was much lower than that of the environmental protection agency guideline (5.37 μM) in drinking water. A 1![[thin space (1/6-em)]](https://www.rsc.org/images/entities/char_2009.gif) :
:![[thin space (1/6-em)]](https://www.rsc.org/images/entities/char_2009.gif) 1 binding between TSQ and Fe3+ ion was evidenced by Job's plot measurement, ESI-MS and Fourier transform infrared (IR) measurements. Moreover, the proposed sensing mechanism of the receptor towards Fe3+ was strongly supported by DFT calculation. Finally, the sensor has proven to be suitable in real sample applications.
1 binding between TSQ and Fe3+ ion was evidenced by Job's plot measurement, ESI-MS and Fourier transform infrared (IR) measurements. Moreover, the proposed sensing mechanism of the receptor towards Fe3+ was strongly supported by DFT calculation. Finally, the sensor has proven to be suitable in real sample applications.
1 Introduction
For the past years, the development of highly sensitive and selective chemosensors has been attracting great interests for detecting heavy metals due to their importance in environmental, biology and chemistry domains.1–10 Iron, the third most abundant element on the earth, is not only the ubiquitous element in the environment, but also an essential element in living cells. It plays crucial roles in functional biological processes, such as cellular metabolism, enzymatic reactions, oxygen transport and gene expression.11–16 Both deficiency and excess can cause a series of diseases.17 Current qualitative and quantitative determination methods for Fe3+ ions include atomic absorption spectroscopy, inductively coupled plasma-atomic emission spectroscopy, mass spectrometry, electrochemical and fluorescence spectroscopic analysis.18–22 These methods suffer either from the sophisticated nature and high cost of instruments, or from tedious sample preparation procedures.23,24 It is imperative to develop simple, highly sensitive and selective chemosensors for Fe3+ detection. To date, a few chemosensors have been developed based on functioned nanoparticles or conjugated organic chromophores.25–32 However, few of them can be used as practical probes limited by their low sensitivity and selectivity, as well as incompatibility with aqueous environments.33–37 For example, Hg2+, Zn2+ as well as Cu2+, which exhibit many properties similar to those of Fe3+, could interfere the Fe3+ detection.38,39 Also it is noted that not many chemosensors with long absorption wavelength have been reported so far. Hence, to develop efficient colorimetric sensing materials still remains a big challenge.
Squaraines are versatile organic dyes which have shown intense absorption in near infrared region and have been widely applied in the optoelectronics fields such as light emitting diodes, field-effect transistors and chemosensors.40–46 Taken advantages of their unique properties, squaraine-based ion sensors can be constructed by a combination of squaraine chromophores with ligands. The intramolecular charge transfer will be occurred once metal ions have interacted with designed ion receptor. This could result in a rich modulation of color changes.
Thymine is one of the four nucleobases to perform base paring with adenine in constructing double helix DNA. It has proven to be one of the most effective ligands binding to the metal ions especially for mercury ion.47 Therefore, we introduced a thymine group into the squaraine chromophore, leading to a new thymine-squaraine based chemosensor. To our surprise, the resulting chemosensor can specifically detect Fe3+ over the other metal ions by color change in aqueous solution. The complexation to Fe3+ and sensing mechanism were further investigated by Job's plot measurement, UV-vis titration, ESI-MS spectrometry analysis, IR analysis and theoretical calculation. The improvement in the color response, rapid accurate recognition of Fe3+ and low detection limit make this approach very promising for Fe3+ detection.
2 Experimental section
2.1 Reagents and apparatus
All the reagents related to the starting materials for synthesizing TSQ in Scheme 1 and the inorganic salts together with buffer used in the properties study of TSQ were obtained from commercial available sources in analytical grade without purification. 1H NMR (400 MHz) and 13C NMR (400 MHz) spectra were recorded on a Bruker AV-400 spectrometer using a deuterated solvent as the lock and TMS as an internal reference. Mass spectrometry analysis was performed on a Q exactive mass spectrometer (Thermo Fisher Scientific, USA). Absorption spectra were measured on Molecular Device Spectrometer 5 (Molecular Devices Corporation, USA).
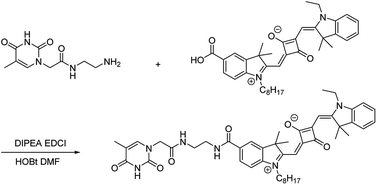 |
| | Scheme 1 Synthetic pathway for chemosensor TSQ. | |
2.2 Synthesis of TSQ
The synthetic pathway for TSQ was illustrated in Scheme 1. A mixture of A1 (1.351 g, 1.8 mmol) and A2 (0.375 g, 1.8 mmol) were dissolved in N,N-dimethylformamide (20 mL) together with amide coupling reagents of N,N-diisopropylethylamine (0.225 g, 3.6 mmol), 1-(3-dimethylaminopropyl)-3-ethylcarbodiimide hydrochloride (0.342 g, 1.98 mmol) and 1-hydroxybenzotriazole (0.243 g, 1.8 mmol). The mixture was stirred for 4 h at room temperature. It was monitored by thin layer chromatography and purified by column chromatography using DCM![[thin space (1/6-em)]](https://www.rsc.org/images/entities/char_2009.gif) :
:![[thin space (1/6-em)]](https://www.rsc.org/images/entities/char_2009.gif) MeOH = 30
MeOH = 30![[thin space (1/6-em)]](https://www.rsc.org/images/entities/char_2009.gif) :
:![[thin space (1/6-em)]](https://www.rsc.org/images/entities/char_2009.gif) 1 as eluents. The final compound TSQ was obtained as dark solid in the yield of 45.2%. The structure was confirmed by NMR and mass spectrometric analysis (Fig. S1 and S2†). 1H NMR (400 MHz, CDCl3) δ: 10.41 (s, 1H), 7.99 (s, 2H), 7.89–7.84 (m, 2H), 7.37–7.30 (m, 2H), 7.19–7.16 (m, 2H), 7.04–7.02 (m, 2H), 6.94–6.92 (d, J = 7.9 Hz), 5.97–5.92 (m, 2H), 4.37 (s, 1H), 4.09–4.07 (d, J = 6.6 Hz, 2H), 3.89 (s, 1H), 3.58 (s, 2H), 3.50 (m, 4H), 1.76–1.70 (m, 16H), 1.35–1.22 (m, 15H), 0.87–0.82 (m, 3H). 13C NMR (100 MHz, CDCl3) δ: 181.28, 177.93, 171.20, 168.85, 168.02, 167.93, 164.66, 151.62, 145.46, 142.42, 141.66, 141.09, 129.93, 129.89, 128.54, 128.05, 127.98, 124.43, 122.44, 121.44, 111.07, 109.66, 108.75, 87.37, 86.77, 50.70, 49.72, 48.68, 43.77, 40.29, 38.72, 31.73, 29.70, 29.37, 29.33, 29.17 27.07, 27.00, 26.80, 22.59, 14.13, 14.09, 12.30,12.13 ppm. ESI-MS calculated for TSQ 788.4261, found 789.5288.
1 as eluents. The final compound TSQ was obtained as dark solid in the yield of 45.2%. The structure was confirmed by NMR and mass spectrometric analysis (Fig. S1 and S2†). 1H NMR (400 MHz, CDCl3) δ: 10.41 (s, 1H), 7.99 (s, 2H), 7.89–7.84 (m, 2H), 7.37–7.30 (m, 2H), 7.19–7.16 (m, 2H), 7.04–7.02 (m, 2H), 6.94–6.92 (d, J = 7.9 Hz), 5.97–5.92 (m, 2H), 4.37 (s, 1H), 4.09–4.07 (d, J = 6.6 Hz, 2H), 3.89 (s, 1H), 3.58 (s, 2H), 3.50 (m, 4H), 1.76–1.70 (m, 16H), 1.35–1.22 (m, 15H), 0.87–0.82 (m, 3H). 13C NMR (100 MHz, CDCl3) δ: 181.28, 177.93, 171.20, 168.85, 168.02, 167.93, 164.66, 151.62, 145.46, 142.42, 141.66, 141.09, 129.93, 129.89, 128.54, 128.05, 127.98, 124.43, 122.44, 121.44, 111.07, 109.66, 108.75, 87.37, 86.77, 50.70, 49.72, 48.68, 43.77, 40.29, 38.72, 31.73, 29.70, 29.37, 29.33, 29.17 27.07, 27.00, 26.80, 22.59, 14.13, 14.09, 12.30,12.13 ppm. ESI-MS calculated for TSQ 788.4261, found 789.5288.
2.3 UV-vis spectroscopy
A stock solution of TSQ was prepared 10 mM in DMSO. Further dilutions were made to prepare 100 μM of TSQ by adding different types of solutions. 11 different metal salts were prepared 10 mM in distilled water and diluted further accordingly. After mixing TSQ and metal ion solutions, the absorption measurements were made in 96 well plates on Molecular Device Spectrometer 5 (Molecular Devices Corporation, USA) at the wavelength range of 350 nm to 750 nm.
2.4 Job's plot measurements
The stock solution of sensor TSQ (10 mM) in DMSO and FeCl3 (10 mM) in distilled water were prepared, respectively. When the mole fraction of Fe3+ was equal to 0.1, the sensor TSQ solution (1.8 μL) and FeCl3 solution (0.2 μL) were added to each 20% AcOH solution to make a total volume of 200 μL. After stirring for a few seconds, UV-vis spectra were recorded at room temperature. When the mole fraction gradually increased to 1.0, TSQ volume decreased by 0.2 μL and Fe3+ volume increased by 0.2 μL, respectively. The absorption spectra were recorded at absorption maximum wavelength. The plots were drawn by plotting A0/(A0 − A) vs. 1/[Fe3+], where A0 equaled to absorption intensity of TSQ without Fe3+, A was corresponding to the absorption intensity of TSQ with different concentrations of Fe3+.
2.5 Competition tests
2 μL of Na+, K+, Li+, Ag+, Zn2+, Hg2+, Cd2+, Fe2+, Co2+, Ca2+ ion solutions (10 mM) were extracted individually and mixed with 2 μL Fe3+ (2 mM), 2 μL TSQ (10 mM) and filled up with 20% AcOH–H2O solution to total volume of 200 μL. After stirring the solutions for a few seconds, UV-vis spectra were recorded at room temperature.
3 Results and discussion
3.1 Spectral properties of TSQ
The absorption properties of TSQ were investigated in different aqueous solutions, i.e. distilled pure water, phosphate buffer (PBS buffer, pH = 7.4), borate buffer (pH = 6.8) and acetic acid. The results were recorded as shown in Fig. 1a. Two broad absorption peaks of TSQ were observed at 605 nm and 660 nm once the water was present (distilled pure water, phosphate buffer and borate buffer). The sensor has shown a cyan color in the solution. Only one strong and symmetric peak was observed at 635 nm which has been shown as blue color in the presence of pure acetic acid. It is well known that squaraines have great tendency to aggregate in a different pattern which corresponding to the interesting spectroscopic response. A blue shifted absorption and broaden absorption peaks will be observed as in H-aggregation (paralleled oriented arrangement) and red shifted absorption and sharp absorption peaks will be shown as in J-aggregation (head to tail fashion). In this case, it is assumed that the different extent and H-aggregation occur in the presence of water by TSQ. To further validate the water induced aggregation effect, the different percentage of water was added into acetic acid to form acetic acid solution. As shown in Fig. 1b, as the percentage of water in acetic acid increased, the absorption performances were almost preserved even in the presence of 60% H2O in acetic acid solution. With further increased water percentage to 80%, the intensity of new weak band at 650 nm concomitantly increased (blue shift) which was consistent with results in Fig. 1a. For both PBS buffer (pH = 7.4) and borate buffer (pH = 6.8), the pH of the solvent system has no significant influence on the absorption spectrum.
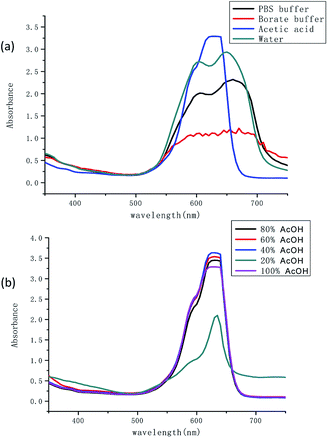 |
| | Fig. 1 (a) UV-vis spectra of TSQ (100 μM) in different aqueous solutions and (b) in the mixture of AcOH–H2O. | |
3.2 Colorimetric sensing for Fe3+
Preliminary results have shown that TSQ could possess good absorption properties in acetic acid, which were selected for identifying the metal ions in the following experiments.
Colorimetric responses to various metal ions including Na+, K+, Li+, Ag+, Zn2+, Hg2+, Cd2+, Fe2+, Co2+, Ca2+, Fe3+ were investigated. It has shown in Fig. 2a that in 20% AcOH–H2O solution of 100 μM TSQ, the color change was dramatic and specific to Fe3+, while addition of other metal ions did not show any significant change. The Fe3+ induced a spontaneous color change from blue to green, which could be easily detected by the naked eyes. In the corresponding UV-vis spectrum, the intensity of strong absorption at 635 nm was decreased after the addition of Fe3+.
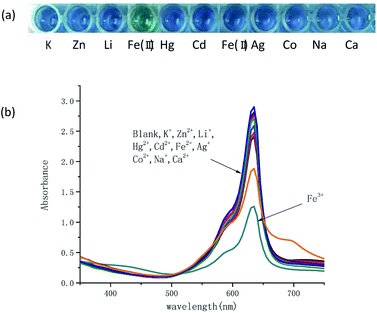 |
| | Fig. 2 (a) Visualization and (b) absorption spectra for TSQ solution (100 μM) with/without addition of different metal ions (100 μM) in 20% AcOH–H2O. | |
The solvent effects on detection of Fe3+ for TSQ in AcOH–H2O solution were further evaluated (Fig. 3). By varying the portion of AcOH in the distilled water, the decreased absorption change of TSQ only can be observed in 20% AcOH–H2O solution. There were no similar observations in other solutions, which indicating that TSQ was a highly sensitive and selective colorimetric sensor for Fe3+ ions.
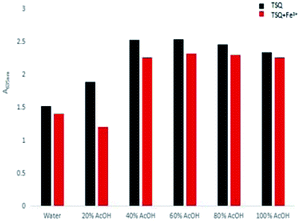 |
| | Fig. 3 Bar chart showing the absorption changes of TSQ (100 μM) in the different AcOH–H2O solution with adding 100 μM Fe3+ (red bar) or without Fe3+ (black). | |
3.3 Time-resolved colorimetric study
For the purpose of exploring the relationship between absorption intensity and response time, a dynamic study of TSQ in the detection of Fe3+ was monitored. The green color of TSQ was kept even after 4 hours which clearly indicated that the detection for Fe3+ was instant and the complexation reaction was stable (Fig. 4).
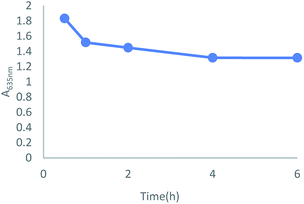 |
| | Fig. 4 Dynamic study on the absorption change by mixing TSQ (100 μM) and Fe3+ (100 μM) in 20% AcOH–H2O solution. | |
3.4 Binding constant Ka and limit of detection (LOD) for Fe3+
To get insight into the binding mode between TSQ and Fe3+, the UV-vis absorption spectra of 100 μM TSQ in 20% AcOH–H2O solution were recorded during the titration of various concentrations of Fe3+. The binding constant (Ka) was estimated using a Benesi–Hildebrand plot, which was calculated by absorption changes of consequent titration (A0/A0 − A) against 1/[Fe3+]. The magnitude of Ka was calculated from the intercept and slope of the straight line, and the estimated value is about 9.6 × 10⁵ M−1 (Fig. 5). More importantly, the absorption change of TSQ corresponded to the concentration of Fe3+ in a linear manner in the range of 1–100 μM. The high sensitivity of this sensor in 20% AcOH–H2O solution allowed detection limit reaching to be 1 μM. The detection limit of Fe3+ was much lower than the EPA guidelines for drinking water of 5.37 μM.48 The sensing ability of TSQ towards Fe3+ was also compared to those for coumarin and rhodamine derivatives, which considering as other two types of promising near infrared colorimetric sensing probes. The LOD of present probe TSQ is superior to those of coumarin derivative49,50 and rhodamine based chemosensors31 (Table S1†).
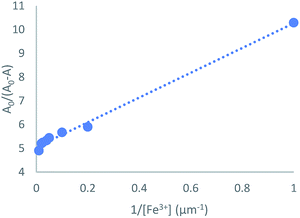 |
| | Fig. 5 Benesi–Hildebrand plot analysis of the absorption changes for the complexation between TSQ and Fe3+, R2 = 0.9947. | |
3.5 Complexation mechanism of TSQ–Fe3+
Job's plot measurement was carried out to explore the binding ratio of TSQ and Fe3+ (Fig. 6). The plots were done by recording the absorption intensity A against [Fe3+]/[Fe3+]+[TSQ]. The results revealed that the TSQ probe bind with Fe3+ in 1![[thin space (1/6-em)]](https://www.rsc.org/images/entities/char_2009.gif) :
:![[thin space (1/6-em)]](https://www.rsc.org/images/entities/char_2009.gif) 1 stoichiometry, which was further confirmed by ESI-MS data. A solution containing TSQ and 1 equiv. of FeCl3 has shown a strong peak at m/z 905.5341, assigned to [TSQ + Fe3+ + CH3COOH + H+] ion (Fig. S3†). IR spectra can provide valuable information on the complexation. To gain additional insight into the Fe3+ binding properties, the FT-IR spectra of TSQ and TSQ–Fe3+ complex were measured (Fig. 7). The shift of the carbonyl absorption band indicated the change of structure. The characteristic amide carbonyl (C
1 stoichiometry, which was further confirmed by ESI-MS data. A solution containing TSQ and 1 equiv. of FeCl3 has shown a strong peak at m/z 905.5341, assigned to [TSQ + Fe3+ + CH3COOH + H+] ion (Fig. S3†). IR spectra can provide valuable information on the complexation. To gain additional insight into the Fe3+ binding properties, the FT-IR spectra of TSQ and TSQ–Fe3+ complex were measured (Fig. 7). The shift of the carbonyl absorption band indicated the change of structure. The characteristic amide carbonyl (C![[double bond, length as m-dash]](https://www.rsc.org/images/entities/char_e001.gif) O) stretching vibrations at 1685 cm−1 shifted to 1608 cm−1 in the presence of Fe3+, while the characteristic carbonyl (C
O) stretching vibrations at 1685 cm−1 shifted to 1608 cm−1 in the presence of Fe3+, while the characteristic carbonyl (C![[double bond, length as m-dash]](https://www.rsc.org/images/entities/char_e001.gif) O) stretching frequencies in thymine moiety appeared at 1584 cm−1 instead of 1596 cm−1 in the complex of TSQ–Fe3+. In addition, a new broad peak was generated at 3400 cm−1 which corresponding to the N–H vibration. All these results strongly indicate the amide carbonyl O atom (C
O) stretching frequencies in thymine moiety appeared at 1584 cm−1 instead of 1596 cm−1 in the complex of TSQ–Fe3+. In addition, a new broad peak was generated at 3400 cm−1 which corresponding to the N–H vibration. All these results strongly indicate the amide carbonyl O atom (C![[double bond, length as m-dash]](https://www.rsc.org/images/entities/char_e001.gif) O) and the carbonyl O atom in thymine moiety were involved in the recognition of Fe3+. The density functional theory (DFT) study was further in proceed to get insight into details of TSQ–Fe3+ complexation. All calculations were carried out with the Gaussian 09 package.51 The density functional theory (DFT) hybrid model with the B3LYP was used for the gas-phase geometry optimizations, Lanl2dz basis set with effective core potential (ECP) for Fe, and the 6-31G(d) basis set was used for all remaining atoms. Based on the calculations, the favourability binding mode between TSQ (a) and its Fe3+ complex (b) was depicted in Fig. 8. It is favourable for the thymine moiety, which was vertical to the planar of asymmetrical squaraine dyes. And the Fe3+ ion was tended to bind with one carbonyl group in thymine and another carbonyl group on the oxygen atom of amide bond. All conformations were calculated at the same level to confirm their stability (no imaginary frequencies).
O) and the carbonyl O atom in thymine moiety were involved in the recognition of Fe3+. The density functional theory (DFT) study was further in proceed to get insight into details of TSQ–Fe3+ complexation. All calculations were carried out with the Gaussian 09 package.51 The density functional theory (DFT) hybrid model with the B3LYP was used for the gas-phase geometry optimizations, Lanl2dz basis set with effective core potential (ECP) for Fe, and the 6-31G(d) basis set was used for all remaining atoms. Based on the calculations, the favourability binding mode between TSQ (a) and its Fe3+ complex (b) was depicted in Fig. 8. It is favourable for the thymine moiety, which was vertical to the planar of asymmetrical squaraine dyes. And the Fe3+ ion was tended to bind with one carbonyl group in thymine and another carbonyl group on the oxygen atom of amide bond. All conformations were calculated at the same level to confirm their stability (no imaginary frequencies).
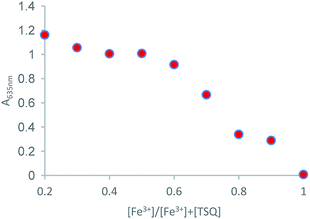 |
| | Fig. 6 Job's plot for the complexation of TSQ with Fe3+ in AcOH–H2O (2![[thin space (1/6-em)]](https://www.rsc.org/images/entities/char_2009.gif) : :![[thin space (1/6-em)]](https://www.rsc.org/images/entities/char_2009.gif) 8, v/v) solution. 8, v/v) solution. | |
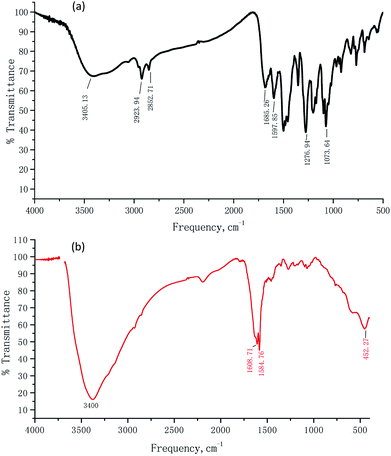 |
| | Fig. 7 The IR spectra of TSQ (Black line) and TSQ–Fe3+ (Red line). | |
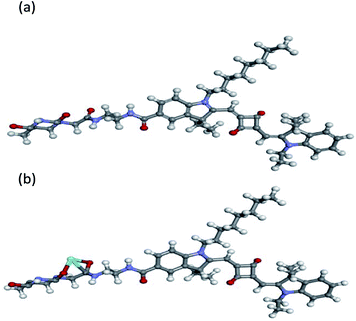 |
| | Fig. 8 The geometry-optimized structures of TSQ (a) and its Fe3+ complex (b) at the SMD (H2O)-TD-PBE0/TZVP + LANL2DZ level. | |
3.6 Ions interference effects on the TSQ towards Fe3+
Counterion effects on the sensitive colorimetric sensor TSQ for Fe3+ have also been investigated. The results have shown that the anions with weak coordination abilities towards Fe3+ such as Cl−, SO42−, SO32−, NO3−, CO32− had no predominant effect on the absorption change (Fig. 9). In addition, the colorimetric responses towards other environmentally relevant metal ions were recorded as well. Upon addition of 5 equiv. Na+, K+, Li+, Ag+, Zn2+, Hg2+, Cd2+, Fe2+, Co2+, Ca2+ in TSQ–Fe3+ complex solution, no apparent absorption changes were observed, indicating that extra amount of other cations have no significant interference to the response of TSQ towards Fe3+ (Fig. 10).
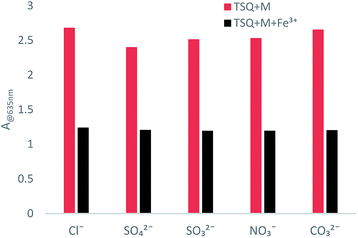 |
| | Fig. 9 Absorption changes of TSQ–Fe3+ in the presence of various test anions in AcOH–H2O (2![[thin space (1/6-em)]](https://www.rsc.org/images/entities/char_2009.gif) : :![[thin space (1/6-em)]](https://www.rsc.org/images/entities/char_2009.gif) 8, v/v). 8, v/v). | |
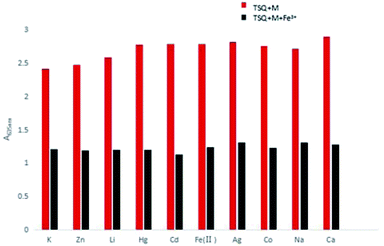 |
| | Fig. 10 Absorption changes of TSQ–Fe3+ in the presence of various test cations in AcOH–H2O (2![[thin space (1/6-em)]](https://www.rsc.org/images/entities/char_2009.gif) : :![[thin space (1/6-em)]](https://www.rsc.org/images/entities/char_2009.gif) 8, v/v). 8, v/v). | |
3.7 Reversible study of TSQ–Fe3+ complex towards EDTA
In order to test if the proposed TSQ–Fe3+ complex could be reversed, EDTA as a strong chelator was added to the solution containing of 1 equiv. TSQ and 1 equiv. Fe3+. As seen in Fig. 11, the addition of 1 equiv. EDTA restored the absorption signal of TSQ to its original level. Additional 1 equiv. Fe3+ was added in again to make another round of detection by colorimetric change from blue to green (Fig. S4†). All these results show that the process of titrating sensor TSQ with Fe3+ is reversible and that sensor TSQ could be used as an on-off-on switch chemosensor.
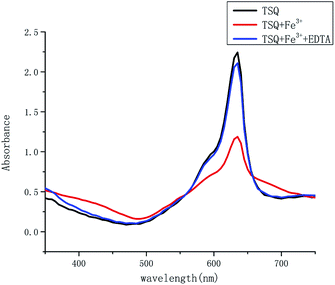 |
| | Fig. 11 Absorption spectra of TSQ (100 μM) + Fe3+ (100 μM) upon the addition of EDTA (1 equiv.) in AcOH–H2O (2![[thin space (1/6-em)]](https://www.rsc.org/images/entities/char_2009.gif) : :![[thin space (1/6-em)]](https://www.rsc.org/images/entities/char_2009.gif) 8, v/v). 8, v/v). | |
3.8 Preliminary analytical applications
In order to examine the capability of the proposed chemosensor in environmental samples, TSQ was applied to the determination of the Fe3+ in waste water from an electroplating factory. As shown in Table 1, the initial Fe3+ concentrations were measured by the atomic absorption spectrometry (AAS) method and three levels of standard concentrations of Fe3+ were added into real samples. By applying our TSQ test, the content of Fe3+ in waste water was in good agreement with that added amount by a relative error in less than 5%. Therefore, the present TSQ was initially proven to be well used in the determination of Fe3+ in real samples.
Table 1 Determination of Fe3+ ion in waste water samples with TSQ
| Sample |
AAS (μM) |
Added (mM) |
Found (mM) |
Recovery (%) |
| Waste water 1 |
2.08 |
1.20 |
1.22 |
101.2 |
| Waste water 2 |
3.78 |
2.31 |
2.38 |
103.3 |
| Waste water 3 |
6.02 |
3.62 |
3.58 |
99.0 |
4 Conclusions
In summary, we have successfully constructed a thymine-squaraine based colorimetric chemosensor for Fe3+ detection in aqueous solution. It has shown an excellent selectivity for Fe3+ over the other cations (blue to green). The limited of detection (1 μM) was determined lower than the EPA guidelines for drinking water of 5.37 μM and no other ion interferences have shown significant effects on the Fe3+ detection. Further study of mechanism by Job's plot measurement, ESI-MS indicated that 1![[thin space (1/6-em)]](https://www.rsc.org/images/entities/char_2009.gif) :
:![[thin space (1/6-em)]](https://www.rsc.org/images/entities/char_2009.gif) 1 complex was formed between TSQ and Fe3+. IR spectrum and DFT calculation further revealed the detailed binding mode of TSQ–Fe3+ complex in the way of binding on the amide carbonyl O atom (C
1 complex was formed between TSQ and Fe3+. IR spectrum and DFT calculation further revealed the detailed binding mode of TSQ–Fe3+ complex in the way of binding on the amide carbonyl O atom (C![[double bond, length as m-dash]](https://www.rsc.org/images/entities/char_e001.gif) O) and the carbonyl O atom on thymine moiety towards Fe3+. Reversible study and preliminary analytical application study have shown strong potent of TSQ as a good chemosensor to Fe3+ in real sample applications. Considering that the developed thymine-squaraine based chemosensor TSQ was quite effective and selective, we expect that it will potentially serve as colorimetric probe for more Fe3+-related environmental studies.
O) and the carbonyl O atom on thymine moiety towards Fe3+. Reversible study and preliminary analytical application study have shown strong potent of TSQ as a good chemosensor to Fe3+ in real sample applications. Considering that the developed thymine-squaraine based chemosensor TSQ was quite effective and selective, we expect that it will potentially serve as colorimetric probe for more Fe3+-related environmental studies.
Conflicts of interest
There are no conflicts to declare.
Acknowledgements
This work were financially supported by research fund for Jiangsu specially appointed professor (SCZ1505200002 and SCZ1606600001), foundation of Jiangsu High Education Committee for natural science research projects (18KJB150005) and Postdoctoral Science Foundation in Jiangsu Province (2018K275C).
Notes and references
- J. Yin, Y. Hu and J. Yoon, Chem. Soc. Rev., 2015, 44, 4619–4644 RSC.
- X. H. Li, X. H. Gao, W. Shi and H. M. Ma, Chem. Rev., 2014, 114, 590–659 CrossRef CAS PubMed.
- J. Sun, B. Ye, G. Xia, X. Zhao and H. Wang, Sens. Actuators, B, 2016, 233, 76–82 CrossRef CAS.
- X. Zhou, S. Lee, Z. Xu and J. Yoon, Chem. Rev., 2015, 115, 7944–8000 CrossRef CAS PubMed.
- X. X. Hu, X. L. Zheng, X. X. Fan, Y. T. Su, X. Q. Zhan and H. Zheng, Sens. Actuators, B, 2016, 227, 191–197 CrossRef CAS.
- K. P. Carter, A. M. Young and A. E. Palmer, Chem. Rev., 2014, 114, 4564–4601 CrossRef CAS PubMed.
- O. Anderson, Chem. Rev., 1999, 99, 2683–2710 CrossRef.
- W. Qin, W. Dou, V. Leen, W. Dehan, M. W. Auweraer and N. Boens, RSC Adv., 2016, 6, 7806–7816 RSC.
- S. Sinha, T. Mukherjee, J. Mathew, S. K. Mukhopadhyay and S. Ghosh, Anal. Chim. Acta, 2014, 822, 60–68 CrossRef CAS PubMed.
- C. Li, J. Qin, G. Wang, B. Wang, A. Fu and Z. Zhang, Inorg. Chim. Acta, 2015, 430, 91–95 CrossRef CAS.
- H. Matthias, U. M. Martina, G. Bruno and C. Clara, Cell, 2010, 142, 24–38 CrossRef PubMed.
- S. K. Danuta and R. R. Des, Pharmacol. Rev., 2015, 57, 547–583 Search PubMed.
- R. Meneghini, Free Radical Biol. Med., 1997, 23, 783–792 CrossRef CAS PubMed.
- P. Aisen, M. Resnick and E. A. Leibold, Curr. Opin. Chem. Biol., 1999, 3, 200–206 CrossRef CAS PubMed.
- R. S. Eisenstein, Annu. Rev. Nutr., 2000, 20, 627–662 CrossRef CAS PubMed.
- T. A. Rouault, Nat. Chem. Biol., 2006, 2, 406–414 CrossRef CAS PubMed.
- C. Brugnara, Clin. Chem., 2003, 49, 1573–1578 CrossRef CAS.
- S. Lunvongsa, M. Oshima and S. Motomizu, Talanta, 2006, 68, 969–973 CrossRef CAS PubMed.
- D. C. Gomes, M. A. Segundo, J. C. Lima and A. S. Rangel, Talanta, 2005, 66, 703–711 CrossRef CAS PubMed.
- A. R. Timerbaev, E. Dabek-Zlotorzynska and A. G. T. Marc van den Hoop, Analyst, 1999, 124, 811–826 RSC.
- P. Vanloot, B. Coulomb, C. Brach-Papa, M. Sergent and J. L. Boudenne, Chemosphere, 2007, 69, 1351–1360 CrossRef CAS PubMed.
- T. Shamspur, I. Sheikhshoaie and M. H. Mashhadizadeh, J. Anal. At. Spectrom., 2005, 20, 476–478 RSC.
- L. Hu, Y. F. Zhang, L. Nie, C. G. Xie and Z. Q. Yan, Spectrochim. Acta, Part A, 2013, 104, 87–91 CrossRef CAS PubMed.
- Z. Q. Yan, S. Y. Guang, H. Y. Xu and X. Y. Liu, Analyst, 2011, 136, 1916–1921 RSC.
- D. B. Wei, Y. L. Sun, J. X. Yu, G. H. Wei and Y. G. Du, Sens. Actuators, B, 2011, 160, 1316–1321 CrossRef CAS.
- L. Hu, L. Nie, G. N. Xu, H. Shi, X. Q. Xu, X. Z. Zhang and Z. Q. Yan, RSC Adv., 2014, 4, 19370–719374 RSC.
- A. Singh, S. Sinha, R. Kaur, N. Kaur and N. Singh, Sens. Actuators, B, 2014, 204, 617–621 CrossRef CAS.
- Y. W. Ma, T. H. Leng, Y. R. Qu, C. Y. Wang, Y. J. Shen and W. H. Zhu, Tetrahedron, 2017, 73, 14–20 CrossRef CAS.
- L. Qiu, C. C. Zhu, H. C. Chen, H. C. Chen, M. Hu, W. J. He and Z. J. Guo, Chem. Commun., 2014, 50, 4631–4634 RSC.
- T. Nandhini, P. Kaleeswaran and K. Pitchumani, Sens. Actuators, B, 2016, 230, 199–205 CrossRef CAS.
- N. R. Chereddy, K. Suman, P. S. Korrapati, S. Thennarasu and A. B. Mandal, Dyes Pigm., 2012, 95, 606–613 CrossRef CAS.
- H. Kim, B. A. Rao, J. Jeong, S. Angupillai, J. S. Choi, J. O. Nam, C. S. Lee and Y. A. Son, Sens. Actuators, B, 2016, 224, 404–412 CrossRef CAS.
- Y. Xiang and A. J. Tiong, Org. Lett., 2006, 8, 1549–1552 CrossRef CAS PubMed.
- L. Dong, C. Xu, X. Zeng, L. Mu, S. F. Xue, Z. Tao and J. X. Zhang, Sens. Actuators, B, 2010, 145, 433–437 CrossRef CAS.
- J. Mao, L. N. Wang, W. Dou, X. L. Tang, Y. Yan and W. S. Liu, Org. Lett., 2007, 9, 4567–4570 CrossRef CAS PubMed.
- N. V. Ghule, R. S. Bhosale, A. L. Bhosale, S. V. Bhosale and S. V. Bhosale, Sens. Actuators, B, 2016, 227, 17–23 CrossRef CAS.
- P. Kaur and D. Sareen, Dyes Pigm., 2011, 88, 296–300 CrossRef CAS.
- T. B. Wei, P. Zhang, B. B. Shi, P. Chen, Q. Lin, J. Liu and Y. M. Zhang, Dyes Pigm., 2013, 97, 297–302 CrossRef CAS.
- T. Inoue, S. S. Pandy, N. Fujikawa, Y. Yamaguchi and S. Hayase, J. Photochem. Photobiol., A, 2010, 213, 23–29 CrossRef CAS.
- T. Maeda, H. Nakao, H. Kito, H. Ichinose, S. Yagi and H. Nakazumi, Dyes Pigm., 2011, 90, 275–283 CrossRef CAS.
- Y. Wang, C. Wang, S. Xue, Q. Liang, Z. Li and S. Xu, RSC Adv., 2016, 6, 6540–6550 RSC.
- H. J. Zhu, Y. H. Lin, G. M. Wang, Y. Q. Chen, X. H. Lin and N. Y. Fu, Sens. Actuators, B, 2014, 198, 1201–1209 Search PubMed.
- B. H. Li, W. W. Li, Y. Q. Xu, J. Li, J. Tang and S. Sun, Chem. Commun., 2015, 51, 14652–14655 RSC.
- Y. Xu, Z. Li, A. Malkovskiy, S. Sun and Y. Pang, J. Phys. Chem., 2010, 114, 8574–8580 CrossRef CAS PubMed.
- J. J. McEwen and K. J. Wallace, Chem. Commun., 2009, 42, 6339–6351 RSC.
- Y. Xu, B. Li, L. Li, J. Xiao, S. Ouyang, Y. Sun and A. Pang, Chem. Commun., 2014, 50, 8677–8680 RSC.
- H. Zheng, X. J. Zhang, X. Cai, Q. N. Bian, M. Yan, G. H. Wu, X. W. Lai and Y. B. Jiang, Org. Lett., 2012, 14, 1986–1989 CrossRef CAS PubMed.
- US EPA, Secondary drinking water standards: guidance for nuisance chemicals n.d Search PubMed.
- S. Devaraj, Y. K. Tsui, C. Y. Chiang and Y. P. Yen, Spectrochim. Acta, Part A, 2012, 96, 594–599 CrossRef CAS PubMed.
- E. Bozkurt, M. Arik and Y. Onganer, Sens. Actuators, B, 2015, 221, 136–147 CrossRef CAS.
- M. J. Frisch, G. W. Trucks, H. B. Schlegel, G. E. Scuseria, M. A. Robb, J. R. Cheeseman, G. Scalmani, V. Barone, B. Mennucci, G. A. Petersson, H. Nakatsuji, M. Caricato, X. Li, H. P. Hratchian, A. F. Izmaylov, J. Bloino, G. Zheng, J. L. Sonnenberg, M. Hada, M. Ehara, K. Toyota, R. Fukuda, J. Hasegawa, M. Ishida, T. Nakajima, Y. Honda, O. Kitao, H. Nakai, T. Vreven, J. A. Montgomery Jr, J. E. Peralta, F. Ogliaro, M. Bearpark, J. J. Heyd, E. Brothers, K. N. Kudin, V. N. Staroverov, R. Kobayashi, J. Normand, K. Raghavachari, A. Rendell, J. C. Burant, S. S. Iyengar, J. Tomasi, M. Cossi, N. Rega, J. M. Millam, M. Klene, J. E. Knox, J. B. Cross, V. Bakken, C. Adamo, J. Jaramillo, R. Gomperts, R. E. Stratmann, O. Yazyev, A. J. Austin, R. Cammi, C. Pomelli, J. W. Ochterski, R. L. Martin, K. Morokuma, V. G. Zakrzewski, G. A. Voth, P. Salvador, J. J. Dannenberg, S. Dapprich, A. D. Daniels, O. Farkas, J. B. Foresman, J. V. Ortiz, J. Cioslowski and D. J. Fox, Gaussian 09, revision D.01Gaussian, Inc., Wallingford, CT, 2013 Search PubMed.
Footnote |
| † Electronic supplementary information (ESI) available. See DOI: 10.1039/c8ra07345g |
|
| This journal is © The Royal Society of Chemistry 2018 |
Click here to see how this site uses Cookies. View our privacy policy here.  Open Access Article
 *a,
Na Lia,
Min-Min Xub,
Jianhao Wanga,
Chunhui Jiangc,
Guoqiang Song*a and
Yong Wang
 *b
*b
![[thin space (1/6-em)]](https://www.rsc.org/images/entities/char_2009.gif) :
:![[thin space (1/6-em)]](https://www.rsc.org/images/entities/char_2009.gif) 1 binding between TSQ and Fe3+ ion was evidenced by Job's plot measurement, ESI-MS and Fourier transform infrared (IR) measurements. Moreover, the proposed sensing mechanism of the receptor towards Fe3+ was strongly supported by DFT calculation. Finally, the sensor has proven to be suitable in real sample applications.
1 binding between TSQ and Fe3+ ion was evidenced by Job's plot measurement, ESI-MS and Fourier transform infrared (IR) measurements. Moreover, the proposed sensing mechanism of the receptor towards Fe3+ was strongly supported by DFT calculation. Finally, the sensor has proven to be suitable in real sample applications.![[thin space (1/6-em)]](https://www.rsc.org/images/entities/char_2009.gif) :
:![[thin space (1/6-em)]](https://www.rsc.org/images/entities/char_2009.gif) MeOH = 30
MeOH = 30![[thin space (1/6-em)]](https://www.rsc.org/images/entities/char_2009.gif) :
:![[thin space (1/6-em)]](https://www.rsc.org/images/entities/char_2009.gif) 1 as eluents. The final compound TSQ was obtained as dark solid in the yield of 45.2%. The structure was confirmed by NMR and mass spectrometric analysis (Fig. S1 and S2†). 1H NMR (400 MHz, CDCl3) δ: 10.41 (s, 1H), 7.99 (s, 2H), 7.89–7.84 (m, 2H), 7.37–7.30 (m, 2H), 7.19–7.16 (m, 2H), 7.04–7.02 (m, 2H), 6.94–6.92 (d, J = 7.9 Hz), 5.97–5.92 (m, 2H), 4.37 (s, 1H), 4.09–4.07 (d, J = 6.6 Hz, 2H), 3.89 (s, 1H), 3.58 (s, 2H), 3.50 (m, 4H), 1.76–1.70 (m, 16H), 1.35–1.22 (m, 15H), 0.87–0.82 (m, 3H). 13C NMR (100 MHz, CDCl3) δ: 181.28, 177.93, 171.20, 168.85, 168.02, 167.93, 164.66, 151.62, 145.46, 142.42, 141.66, 141.09, 129.93, 129.89, 128.54, 128.05, 127.98, 124.43, 122.44, 121.44, 111.07, 109.66, 108.75, 87.37, 86.77, 50.70, 49.72, 48.68, 43.77, 40.29, 38.72, 31.73, 29.70, 29.37, 29.33, 29.17 27.07, 27.00, 26.80, 22.59, 14.13, 14.09, 12.30,12.13 ppm. ESI-MS calculated for TSQ 788.4261, found 789.5288.
1 as eluents. The final compound TSQ was obtained as dark solid in the yield of 45.2%. The structure was confirmed by NMR and mass spectrometric analysis (Fig. S1 and S2†). 1H NMR (400 MHz, CDCl3) δ: 10.41 (s, 1H), 7.99 (s, 2H), 7.89–7.84 (m, 2H), 7.37–7.30 (m, 2H), 7.19–7.16 (m, 2H), 7.04–7.02 (m, 2H), 6.94–6.92 (d, J = 7.9 Hz), 5.97–5.92 (m, 2H), 4.37 (s, 1H), 4.09–4.07 (d, J = 6.6 Hz, 2H), 3.89 (s, 1H), 3.58 (s, 2H), 3.50 (m, 4H), 1.76–1.70 (m, 16H), 1.35–1.22 (m, 15H), 0.87–0.82 (m, 3H). 13C NMR (100 MHz, CDCl3) δ: 181.28, 177.93, 171.20, 168.85, 168.02, 167.93, 164.66, 151.62, 145.46, 142.42, 141.66, 141.09, 129.93, 129.89, 128.54, 128.05, 127.98, 124.43, 122.44, 121.44, 111.07, 109.66, 108.75, 87.37, 86.77, 50.70, 49.72, 48.68, 43.77, 40.29, 38.72, 31.73, 29.70, 29.37, 29.33, 29.17 27.07, 27.00, 26.80, 22.59, 14.13, 14.09, 12.30,12.13 ppm. ESI-MS calculated for TSQ 788.4261, found 789.5288.


![[thin space (1/6-em)]](https://www.rsc.org/images/entities/char_2009.gif) :
:![[thin space (1/6-em)]](https://www.rsc.org/images/entities/char_2009.gif) 1 stoichiometry, which was further confirmed by ESI-MS data. A solution containing TSQ and 1 equiv. of FeCl3 has shown a strong peak at m/z 905.5341, assigned to [TSQ + Fe3+ + CH3COOH + H+] ion (Fig. S3†). IR spectra can provide valuable information on the complexation. To gain additional insight into the Fe3+ binding properties, the FT-IR spectra of TSQ and TSQ–Fe3+ complex were measured (Fig. 7). The shift of the carbonyl absorption band indicated the change of structure. The characteristic amide carbonyl (C
1 stoichiometry, which was further confirmed by ESI-MS data. A solution containing TSQ and 1 equiv. of FeCl3 has shown a strong peak at m/z 905.5341, assigned to [TSQ + Fe3+ + CH3COOH + H+] ion (Fig. S3†). IR spectra can provide valuable information on the complexation. To gain additional insight into the Fe3+ binding properties, the FT-IR spectra of TSQ and TSQ–Fe3+ complex were measured (Fig. 7). The shift of the carbonyl absorption band indicated the change of structure. The characteristic amide carbonyl (C![[double bond, length as m-dash]](https://www.rsc.org/images/entities/char_e001.gif) O) stretching vibrations at 1685 cm−1 shifted to 1608 cm−1 in the presence of Fe3+, while the characteristic carbonyl (C
O) stretching vibrations at 1685 cm−1 shifted to 1608 cm−1 in the presence of Fe3+, while the characteristic carbonyl (C![[double bond, length as m-dash]](https://www.rsc.org/images/entities/char_e001.gif) O) stretching frequencies in thymine moiety appeared at 1584 cm−1 instead of 1596 cm−1 in the complex of TSQ–Fe3+. In addition, a new broad peak was generated at 3400 cm−1 which corresponding to the N–H vibration. All these results strongly indicate the amide carbonyl O atom (C
O) stretching frequencies in thymine moiety appeared at 1584 cm−1 instead of 1596 cm−1 in the complex of TSQ–Fe3+. In addition, a new broad peak was generated at 3400 cm−1 which corresponding to the N–H vibration. All these results strongly indicate the amide carbonyl O atom (C![[double bond, length as m-dash]](https://www.rsc.org/images/entities/char_e001.gif) O) and the carbonyl O atom in thymine moiety were involved in the recognition of Fe3+. The density functional theory (DFT) study was further in proceed to get insight into details of TSQ–Fe3+ complexation. All calculations were carried out with the Gaussian 09 package.51 The density functional theory (DFT) hybrid model with the B3LYP was used for the gas-phase geometry optimizations, Lanl2dz basis set with effective core potential (ECP) for Fe, and the 6-31G(d) basis set was used for all remaining atoms. Based on the calculations, the favourability binding mode between TSQ (a) and its Fe3+ complex (b) was depicted in Fig. 8. It is favourable for the thymine moiety, which was vertical to the planar of asymmetrical squaraine dyes. And the Fe3+ ion was tended to bind with one carbonyl group in thymine and another carbonyl group on the oxygen atom of amide bond. All conformations were calculated at the same level to confirm their stability (no imaginary frequencies).
O) and the carbonyl O atom in thymine moiety were involved in the recognition of Fe3+. The density functional theory (DFT) study was further in proceed to get insight into details of TSQ–Fe3+ complexation. All calculations were carried out with the Gaussian 09 package.51 The density functional theory (DFT) hybrid model with the B3LYP was used for the gas-phase geometry optimizations, Lanl2dz basis set with effective core potential (ECP) for Fe, and the 6-31G(d) basis set was used for all remaining atoms. Based on the calculations, the favourability binding mode between TSQ (a) and its Fe3+ complex (b) was depicted in Fig. 8. It is favourable for the thymine moiety, which was vertical to the planar of asymmetrical squaraine dyes. And the Fe3+ ion was tended to bind with one carbonyl group in thymine and another carbonyl group on the oxygen atom of amide bond. All conformations were calculated at the same level to confirm their stability (no imaginary frequencies).


![[thin space (1/6-em)]](https://www.rsc.org/images/entities/char_2009.gif) :
:![[thin space (1/6-em)]](https://www.rsc.org/images/entities/char_2009.gif) 8, v/v).
8, v/v).
![[thin space (1/6-em)]](https://www.rsc.org/images/entities/char_2009.gif) :
:![[thin space (1/6-em)]](https://www.rsc.org/images/entities/char_2009.gif) 8, v/v).
8, v/v).
![[thin space (1/6-em)]](https://www.rsc.org/images/entities/char_2009.gif) :
:![[thin space (1/6-em)]](https://www.rsc.org/images/entities/char_2009.gif) 8, v/v).
8, v/v).![[thin space (1/6-em)]](https://www.rsc.org/images/entities/char_2009.gif) :
:![[thin space (1/6-em)]](https://www.rsc.org/images/entities/char_2009.gif) 1 complex was formed between TSQ and Fe3+. IR spectrum and DFT calculation further revealed the detailed binding mode of TSQ–Fe3+ complex in the way of binding on the amide carbonyl O atom (C
1 complex was formed between TSQ and Fe3+. IR spectrum and DFT calculation further revealed the detailed binding mode of TSQ–Fe3+ complex in the way of binding on the amide carbonyl O atom (C![[double bond, length as m-dash]](https://www.rsc.org/images/entities/char_e001.gif) O) and the carbonyl O atom on thymine moiety towards Fe3+. Reversible study and preliminary analytical application study have shown strong potent of TSQ as a good chemosensor to Fe3+ in real sample applications. Considering that the developed thymine-squaraine based chemosensor TSQ was quite effective and selective, we expect that it will potentially serve as colorimetric probe for more Fe3+-related environmental studies.
O) and the carbonyl O atom on thymine moiety towards Fe3+. Reversible study and preliminary analytical application study have shown strong potent of TSQ as a good chemosensor to Fe3+ in real sample applications. Considering that the developed thymine-squaraine based chemosensor TSQ was quite effective and selective, we expect that it will potentially serve as colorimetric probe for more Fe3+-related environmental studies.


