 Open Access Article
Facile synthesis of C–FeF2 nanocomposites from CFx: influence of carbon precursor on reversible lithium storage†
M. Anji Reddy *a,
Ben Breitung
 b,
Venkata Sai Kiran Chakravadhanula‡
 ab,
M. Helena,
Ralf Witteb,
Carine Rongeata,
Christian Kübel
 abc,
Horst Hahnb and
Maximilian Fichtnerab
aHelmholtz Institute Ulm (HIU), Electrochemical Energy Storage, Helmholtzstr. 11, D-89081 Ulm, Germany. E-mail: munnangi.reddy@kit.edu
bKarlsruhe Institute of Technology (KIT), Institute of Nanotechnology (INT), Hermann-von-Helmholtz-Platz 1, 76344, Eggenstein-Leopoldshafen, Germany
cKarlsruhe Nano Micro Facility (KNMF), Karlsruhe Institute of Technology (KIT), Hermann-von-Helmholtz Platz 1, D-76344 Eggenstein-Leopoldshafen, Germany
First published on 31st October 2018
Abstract
Transition metal fluorides are an important class of cathode materials for lithium batteries owing to their high specific energy and safety. However, metal fluorides are electrical insulators, exhibiting slow reaction kinetics with Li. Consequently, metal fluorides can show poor electrochemical performance. Instead, carbon–metal fluoride nanocomposites (CMNFCs) were suggested to enhance electrochemical activity. Chemical synthesis of CMNFCs poses particular challenges due to the poor chemical stability of metal fluorides. Recently, we reported a facile one-step method to synthesize carbon–FeF2 nanocomposites by reacting fluorinated carbon (CFx) with iron pentacarbonyl (Fe(CO)5) at 250 °C. The method resulted in C–FeF2 nanocomposites with improved electrochemical properties. Here, we have synthesized four different C–FeF2 nanocomposites by reacting four different CFx precursors made of petro-coke, carbon black, graphite, and carbon-fibers with Fe(CO)5. Electrochemical performance of all four C–FeF2 nanocomposites was evaluated at 25 °C and 40 °C. It is shown that the nature of CFx has a critical impact on the electrochemical performance of the corresponding C–FeF2 nanocomposites. The C–FeF2 nanocomposites were characterized by using various experimental techniques such as X-ray diffraction, scanning electron microscopy, transmission electron microscopy, resistivity measurement, and 57Fe Mössbauer spectroscopy to shed light on the differences in electrochemical behaviour of different C–FeF2 nanocomposites.
Introduction
Conversion electrode materials based on metal fluorides are interesting as cathode materials for lithium batteries due to their high energy density compared to the insertion based electrode materials.1–6 Metal fluorides react with lithium at a relatively high voltage, and more than one electron per metal can be transferred, which results in high energy density. For example, FeF2 can react with 2.0 Li at a potential of 2.66 V, with a specific capacity of 571 mA h g−1, which leads to a theoretical specific energy of 1518 W h kg−1. On the other hand, metal fluorides pose certain challenges as electrode materials. Metal fluorides are electrical insulators, show slow reaction kinetics with lithium, and consequently, they exhibit large voltage hysteresis between discharge and charge processes. In addition, high volume changes associated with metal fluorides pose further challenges.4 Therefore, stable anchoring of metal fluoride nanocrystallites in a conductive carbon matrix is necessary to provide the electronic path, to improve the reaction kinetics and to buffer the volume changes. To overcome these issues, carbon metal fluoride nanocomposites (CMFNCs) were suggested in earlier work.7,8A general approach to synthesize CMFNCs is mechanical milling of a conductive carbon with a desired metal fluoride.7,8 While mechanical milling effectively reduces the particle size of metal fluorides, the high energy applied in mechanical milling process leads to the destruction of the original carbon structure and produces disordered carbons with less conductive interfaces. Consequently, CMNFCs obtained by mechanical milling show limited cycling stability in lithium half cells.7,8 Alternatively, chemical methods have been reported to synthesize CMNFCs, which showed much higher cycling stability.9–24 Recently, we have reported a facile method for the synthesis of carbon–metal fluoride nanocomposites by reacting graphite fluoride (CFx) with iron pentacarbonyl (Fe(CO)5) at 250 °C.25–27 The C–FeF2 nanocomposites obtained by this method delivered high reversible capacity in lithium half cells.25,27 Further, pretreatment of the CFx precursor by mechanical milling has a significant impact on the reversible capacity, which we attributed to the reduced particle size of CFx.25 We also showed that optimum fluorine to carbon ratio is necessary to achieve high reversibility.26
CFx has a great advantage as a precursor material for the synthesis of CMFNCs, as it is a source of both conductive carbon and fluoride ions. Defluorination of CFx restores the carbon to its original state and the desired carbon structure can be predesigned. More importantly, the reaction occurs in one step and is quick (could be finished in 1 h).27 Further, addition of conductive carbon is not required to prepare the electrodes. In this study, we used various fluorinated carbon compounds namely, petro-coke, carbon black, graphite, and carbon-fibers to synthesize C–FeF2 nanocomposites. The unique feature of such nanocomposites is that, while the average size of the FeF2 crystallites is almost the same, the carbon matrix in which FeF2 nanocrystallites are embedded is different. This provides a unique opportunity to study and better understand the requirements for the design of carbon-nanocomposites for high reversible lithium storage.
Experimental section
Synthesis
Different CFx precursors were kindly provided by Advanced Research Chemicals (ARC). Fe(CO)5 was purchased from Aldrich. C–FeF2 nanocomposites were synthesized in sealed Swagelok® type stainless steel (SS) reactors. In a typical synthesis, required amount of Fe(CO)5 was added to 0.25 g of CFx powder in the SS reactor and closed with VCR fittings inside an argon-filled glove box. The SS reactor was placed inside a tube furnace, and the temperature was raised from room temperature to 250 °C with a heating rate of 5 °C min−1. The reaction was carried out at 250 °C for 24 hours; then the reactor was allowed to cool down naturally. Pressure developed due to the formation of gaseous side product was released carefully, and the reactor was opened in the Ar-filled glove box. The resulting black powder was collected carefully.Characterization
Powder X-ray diffraction (PXRD) patterns were recorded in Bragg–Brentano geometry in the 2θ range 10–70° using a Philips X'pert diffractometer equipped with Mo Kα radiation. In the Debye–Scherrer mode, patterns were collected using a STOE Stadi P diffractometer equipped with a Dectris Mythen 1K linear silicon strip detector and Ge(111) double crystal monochromator (Mo Kα1 radiation, λ = 0.7093 Å). The samples were loaded into 0.7 mm glass capillaries (Hilgenberg borosilicate glass no 50) in an argon-filled glove box. For the refinement of the XRD pattern, we used MAUD software.28 Scanning electron microscopy (SEM) was performed with a LEO 1530 at 15 kV using carbon tape as substrate. Transmission electron microscopy was carried out on an aberration (image) corrected Titan 80-300 (FEI Company) operated at 80 kV equipped with a Gatan imaging filter Tridiem 863. The material for TEM studies consisted of powder sample free from solvents. Since the samples were sensitive to the electron beam at 300 kV, resulting in the amorphization of the graphitic carbon around the FeF2 nanoparticles, the TEM studies were carried out at 80 kV. The Mössbauer spectra were collected using a standard transmission Mössbauer setup with a 57Co in Rh-Matrix source operated in constant acceleration mode. All Isomer shifts (IS) are given with respect to bcc-Fe at room temperature. The spectra were fitted using the WinNormos software by R. A. Brand. For electrical resistivity measurements, the powders were pressed into a 13 mm diameter pellets with a pressure of 10 tons per m2. The resistivity of the nanocomposites was measured by the Van der Pauw method.Electrochemical studies
Electrochemical measurements were performed in Swagelok® type cells. The electrode fabrication and electrochemical cells were assembled in an argon-filled glove box. Electrodes were fabricated by mixing the as-synthesized material and polyvinylidene fluoride (PVDF) in the weight ratios of 90![[thin space (1/6-em)]](https://www.rsc.org/images/entities/char_2009.gif) :
:![[thin space (1/6-em)]](https://www.rsc.org/images/entities/char_2009.gif) 10. A slurry containing the above mixture was prepared by using N-methyl-2-pyrrolidinone and was spread on stainless steel (SS) foil (area: 1.13 cm2) and dried on the hot plate at 160 °C for 12 h. Typically, each electrode contained 4–6 mg of the C–FeF2 nanocomposite. Lithium foil (Goodfellow) was used as the negative electrode, and a borosilicate glass fiber sheet (separator) saturated with 1 M LiPF6 in 1
10. A slurry containing the above mixture was prepared by using N-methyl-2-pyrrolidinone and was spread on stainless steel (SS) foil (area: 1.13 cm2) and dried on the hot plate at 160 °C for 12 h. Typically, each electrode contained 4–6 mg of the C–FeF2 nanocomposite. Lithium foil (Goodfellow) was used as the negative electrode, and a borosilicate glass fiber sheet (separator) saturated with 1 M LiPF6 in 1![[thin space (1/6-em)]](https://www.rsc.org/images/entities/char_2009.gif) :
:![[thin space (1/6-em)]](https://www.rsc.org/images/entities/char_2009.gif) 1 ethylene carbonate (EC)/dimethyl carbonate (DMC) (LP30, Merck) was used as the electrolyte. The cells were placed in an incubator (Binder) to maintain a constant temperature of 25 °C or 40 °C. Electrochemical studies were carried out using an Arbin battery cycling unit. For electrochemical impedance measurements (EIS), cells were assembled and equilibrated at open circuit voltage (OCV) for 24 h. Impedance measurements were made using Zahner IM6 electrochemical workstation.
1 ethylene carbonate (EC)/dimethyl carbonate (DMC) (LP30, Merck) was used as the electrolyte. The cells were placed in an incubator (Binder) to maintain a constant temperature of 25 °C or 40 °C. Electrochemical studies were carried out using an Arbin battery cycling unit. For electrochemical impedance measurements (EIS), cells were assembled and equilibrated at open circuit voltage (OCV) for 24 h. Impedance measurements were made using Zahner IM6 electrochemical workstation.
Results and discussion
We used four different CFx precursors synthesized by fluorinating petro-coke (FPC), carbon-black (FCB), graphite (FG), and carbon-fibers (FCF) (Advanced Research Chemicals). These CFx precursors largely differ in terms of morphology, particle size and surface area (Source: Advanced Research Chemicals). Selected physical properties of these materials are given in Table S1 (see ESI†). In the case of FPC, FCB and FCF fluorine to carbon ratio is between 1.05–1.12, whereas in the case of FG it is 0.95. Fig. S1† shows the XRD patterns of the CFx precursors (see ESI†). All samples show two broad peaks: one at 5° and another at 18° which are typical for highly fluorinated carbon materials. Fig. S2† shows SEM images of the CFx precursors (see ESI†). In the case of FPC, the particle size is in the range of 1–30 μm, with an average particle size of 8.0 μm. In the case of FCB big agglomerates can be seen. However, these agglomerates consist of smaller particles which are less than 200 nm in diameter. In the case of FG, the particle size is in the range of 1–10 μm with an average particle size of 2.0 μm. In the case of FCF, the diameter of the fibers is in the range of 10–30 μm while the length of the fibers is up to 100 μm. Despite the bigger particle size of the FCF, the surface area of 344 m2 g−1 suggests that the material is porous. The high surface area of the highly fluorinated carbons FCB (1.12) and FCF (1.1) suggests that during high-temperature fluorination some carbon was converted into a CF4 gas which leads to pores.Four types of C–FeF2 nanocomposites were synthesized by reacting different CFx samples with Fe(CO)5. PC–FeF2 was synthesized by reacting fluorinated petro coke, FPC with Fe(CO)5 for 24 h at 250 °C. Similarly, CB–FeF2, G–FeF2, and CF–FeF2 were synthesized by reacting Fe(CO)5 with FCB, FG, and FCF respectively at 250 °C for 24 h. Fig. 1 shows the XRD patterns of the as-synthesized carbon–FeF2 nanocomposites recorded in capillary mode. In the case of PC–FeF2, CB–FeF2 and G–FeF2 all the peaks could be indexed to rutile-type FeF2. However, few extra peaks were observed in the case of CF–FeF2 (indicated with an asterisk * in Fig. 1). We also noticed that the relative intensity of (210) plane is growing from CB–FeF2 < PC–FeF2 < G–FeF2 < CF–FeF2. The origin of the additional peaks could be due to the formation of iron carbide (which was confirmed by 57Fe Mössbauer spectroscopy). Rietveld refinement was performed including iron carbide as a secondary phase. The carbon was not taken into account. The refinement parameters are given in Table S2 (see ESI†). The hump around 10° is due to the capillary and was fitted in the background using a Gaussian peak in addition to a polynomial function for the baseline. Further, refinement results showed that in the case of CB–FeF2 there was no iron carbide whereas, in the case of PC–FeF2, G–FeF2 and CF–FeF2 iron carbide was present as a secondary phase with a maximum of 22.5 wt% in CF–FeF2. The average crystallite size was growing from PC–FeF2 (11 nm) < G–FeF2 (12 nm) < CF–FeF2 (16 nm) < CB–FeF2 (17 nm).
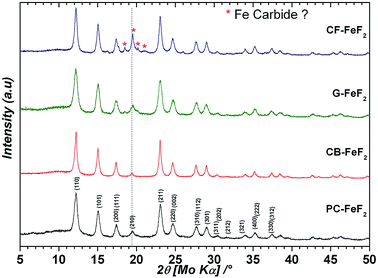 | ||
| Fig. 1 XRD patterns of carbon–FeF2 nanocomposites synthesized from various CFx precursors (recorded in capillary mode). | ||
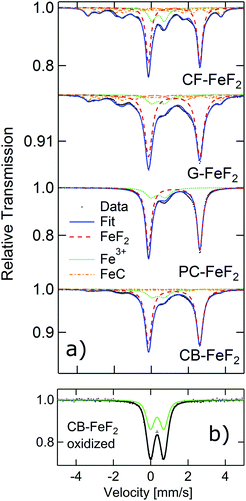
In order to further elucidate the origin of the additional reflections found in the XRD patterns, we recorded 57Fe Mössbauer spectra of all the nanocomposites as Mössbauer spectroscopy is a sensitive local probe for the 57Fe environments. Fig. 2a shows the measured Mössbauer spectra of the four C–FeF2 nanocomposites together with their respective fit model. The obtained Mössbauer hyperfine parameters are summarized in Table S3 (see ESI†). All four samples show two quadrupole doublets as major components. The first one, and most important one is characteristic for FeF2 with an IS of 1.33 mm s−1, and a quadrupole splitting (QS) of about 2.77 mm s−1. These values are in agreement with data in the literature.29 The second doublet has an IS of about 0.47 mm s−1, which is characteristic for the presence of Fe3+ component. However, no evidence was found for the existence of any crystalline phases of FeF3 from the XRD measurements. This signal could be possibly due to aerial oxidation of the sample during the sample transfer, although care has been taken to avoid oxidation. This hypothesis has been checked by investigating a purposely air exposed sample (CB–FeF2) (Fig. 2b). After exposure to air, the sample consists of pure Fe3+ components, which is very similar to the Fe3+ components found in the fresh samples. This finding makes the oxidation as an explanation for the occurrence of the Fe3+ phase very likely. The Mössbauer spectrum of the CB–FeF2 sample was fully reproduced by these two doublets. All other samples exhibit three additional sub-spectra, which are magnetically split with a magnetic hyperfine field BHF of about 22, ∼19 and ∼11 T respectively. They can be attributed to the three Fe-sites present in Fe1−xCx alloys (x ∼ 0.2–0.3) with triangular, prismatic structure.30 The relative ratios given in Table S3† describe the spectral area fraction of the sub-spectra and may be used to compare the four samples among each other. However, it is not possible to give numbers for the phase fractions of the components as the Debye–Waller factors for these different phases may differ, which in turn leads to a different resonant area of the respective Fe environment.
From the XRD and Mössbauer studies, the presence of iron carbide is evident. Formation of iron carbide indirectly suggests the intermediate formation of iron nanoparticles by the decomposition of Fe(CO)5; these iron nanoparticles further react with CFx and forms C–FeF2. The absence of iron carbide in CB–FeF2 could be explained by its smaller particle size. Due to the smaller particle size, the reaction between iron nanoparticles and FCB is fast, and the formation of iron carbide is mitigated. The smaller the particle size of the fluorinated carbon, the faster is the reaction with iron nanoparticles and hence no formation of iron carbide is observed in the case of FCB. However, the iron carbide content is large in the case of G–FeF2 compared to PC–FeF2 (the opposite is expected because of the small particle size of FG compared to FPC); this could be due to the availability of free carbon in the precursor (F/C ratio 0.95) which could readily react with iron nanoparticles and form iron carbide.
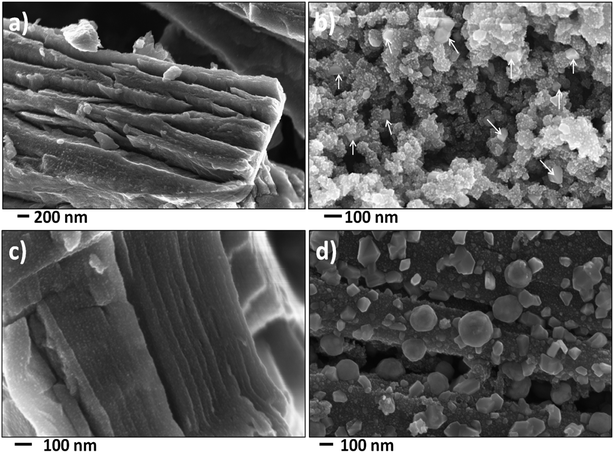
To investigate the microstructure of the nanocomposites, scanning electron microscopy (SEM) and transmission electron microscopy (TEM) analysis was performed on these nanocomposites. Fig. 3 shows the SEM images of the nanocomposites. Additional low magnification SEM images were shown in Fig. S3 (see ESI†). The bulk morphologies were similar to unreacted precursors. In the case of PC–FeF2 (Fig. 3a), FeF2 crystallites are embedded in carbon layers. No FeF2 particles are seen on the surface of the sample. However, in the case of CB–FeF2 (Fig. 3b), some of the FeF2 crystallites are protruding on the surface, and few crystallites (up to 50 nm) are also seen on the surface (shown with arrows). This could be due to the high surface to volume ratio of the sample. The G–FeF2 (Fig. 3c) looks similar to PC–FeF2, and no FeF2 particles are seen on the surface. All the particles are embedded in the carbon layers. The CF–FeF2 (Fig. 3d) sample appears quite different from all the nanocomposites. Apart from the FeF2 crystallites embedded in the carbon layers, a large number of FeF2 crystallites (up to 300 nm) can be observed on the surface of the fibers. The reason for such behavior is not understood at present.
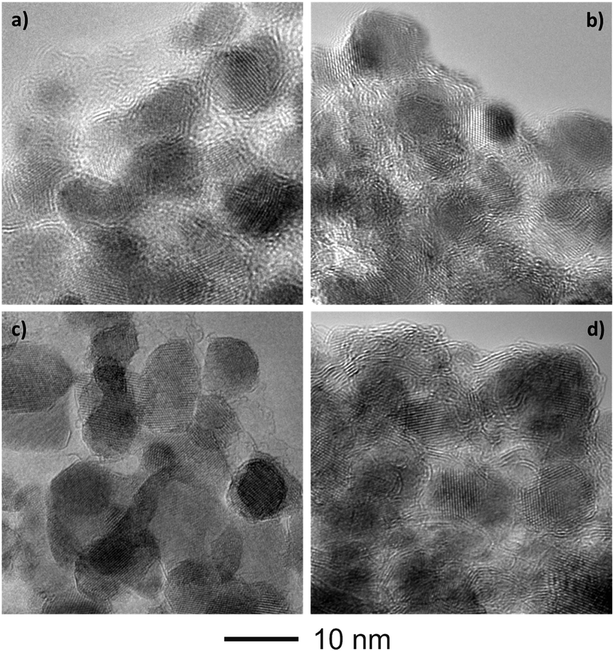
Fig. 4 shows the bright-field TEM images of the C–FeF2 nanocomposites. All the nanocomposites show a similar morphology. The high resolution TEM image of G–FeF2 is shown in Fig. S4 (see ESI†). The FeF2 crystallites are embedded in the carbon matrix. The crystallite sizes are in the range of 5–12 nm. Fig. 5 shows the SEAD patterns corresponding to the TEM images shown in Fig. 4. SAED of PC–FeF2 (Fig. 5a), CB–FeF2 (Fig. 5b) and CF–FeF2 (Fig. 5d) exhibit a similar pattern and demonstrate the nanocrystalline nature of the FeF2. However, the SAED pattern of CF–FeF2 shows additional rings in agreement with the lattice distances seen in iron carbide. In the case of G–FeF2 (Fig. 5c) in addition to the nanocrystalline FeF2 few rings with bright spots were observed, which is attributed to the graphite as the d-values of the spots match with the d-values from graphite.
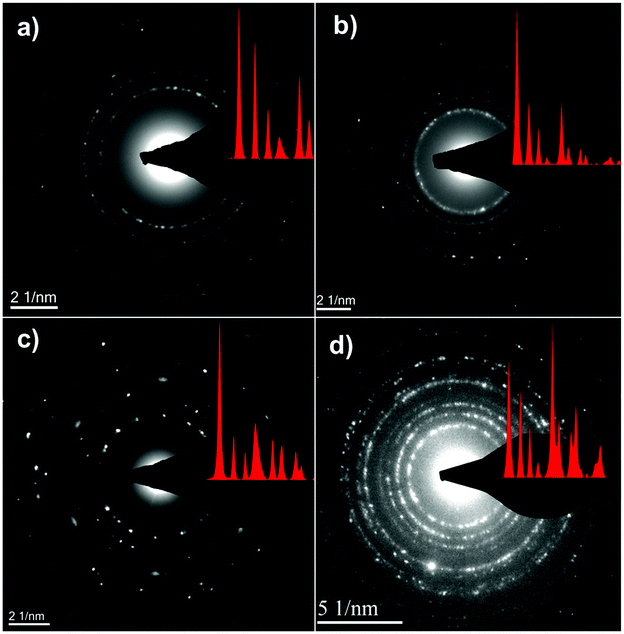 | ||
| Fig. 5 Selective area electron diffraction (SAED) of TEM images shown in (a) PC–FeF2 (b) CB–FeF2 (c) G–FeF2 and (d) CF–FeF2. | ||
Electron energy loss spectroscopy (EELS) was performed to further understand the electronic structure of carbon and valence state of iron fluoride. Carbon K-edge spectra are shown in Fig. 6a and the F-K edge and Fe-L edge is shown in Fig. 6b. The carbon spectra of all the nanocomposites show a typical shape for graphitic or amorphous carbon where the “Energy loss near edge structure” (ELNES) indicates two peaks for the transition of the C K-shell electrons to π*- (284.5 eV) and σ*- (290.5 eV) antibonding states.31 The ELNES structure of G–FeF2 shows the most defined peaks, which indicates a more ordered sp2 hybridized carbon compared to the other three samples, where the structure is characteristic for amorphous carbon.32 The F-K edge, the Fe-L3 edge, and the Fe-L2 edge are shown in Fig. 6b. In case of significant amounts of FeF3, a pre-peak would be expected in EELS and XAS measurements at 684.6 eV.31,33 The absence of this pre-peak in the EELS spectra rules out the presence of significant amounts of FeF3. This suggests that the observation of Fe3+ in the Mössbauer spectra is due to oxidation of the sample.
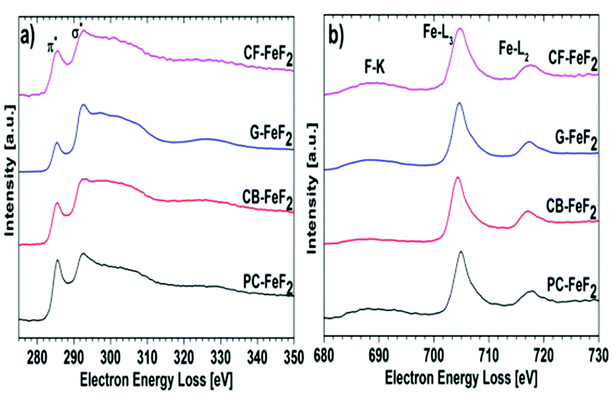 | ||
| Fig. 6 Electron energy loss spectra (EELS) recorded for (a) carbon edge and (b) fluorine and iron edge. | ||
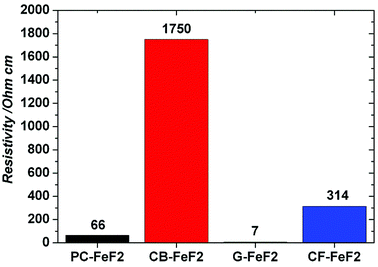
The electrical resistivity of the samples was measured to understand the conducting nature of the composites. Fig. 7 shows the resistivities of C–FeF2 nanocomposites. The resistivities of PC–FeF2, CB–FeF2, G–FeF2 and CF–FeF2 are 66, 1750, 7 and 314 ohm cm respectively. CB–FeF2 composites showed high resistivity compared to PC–FeF2, G–FeF2 and CF–FeF2. The large difference in the resistivity of CB–FeF2 and other composites could be due to the lack of iron carbide in CB–FeF2. Iron carbide shows semiconductivity or metallic conductivity depending on the composition.34 Therefore the presence of iron carbide in PC–FeF2, G–FeF2 and CF–FeF2 might result in the reduced resistivity. The very low resistivity of G–FeF2 could be due to the large graphitic domains and the high carbon content.
Electrochemical studies
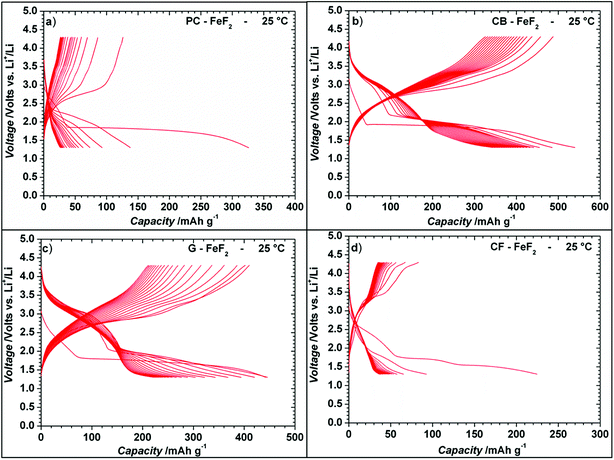
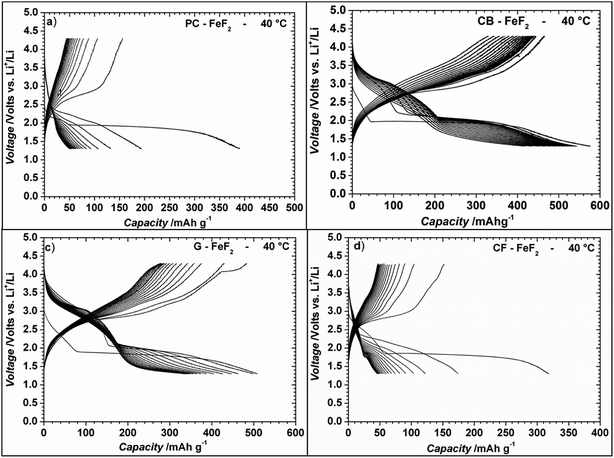
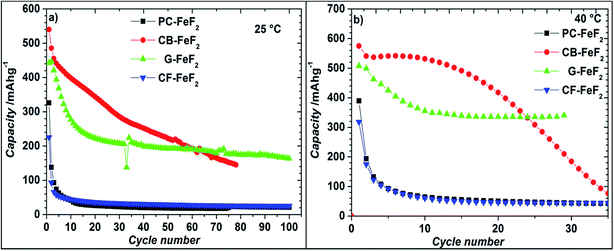
Even though the resistivity of CB–FeF2 is high, initial electrochemical studies were performed without the addition of extra carbon as we aimed to understand the nature of the carbon precursor on the electrochemical properties of the nanocomposites. Fig. 8 shows the discharge/charge curves of C–FeF2 nanocomposites for the first 20 cycles obtained at 25 °C. Capacities are calculated based on the total weight of the nanocomposite in the electrode (i.e., 90% of the total electrode weight). The total first discharge capacities of PC–FeF2, CB–FeF2, G–FeF2 and CF–FeF2 are 326, 540, 442, and 225 mA h g−1 respectively. C–FeF2 nanocomposites derived from FPC and FCF delivered much less capacity compared to the CB–FeF2 and G–FeF2 nanocomposites. The first discharge capacities correlated well with the particle size of the CFx precursors. Larger particle size resulted in less discharge capacity. It appears that, in the case of large particles, accessing the FeF2 nanocrystallites embedded in the core of the particle is difficult. Consequently, some of the FeF2 crystallites do not participate in the electrochemical reaction with lithium and hence less discharge capacity was observed. The first discharge curve of C–FeF2 composite shows two voltage regions; sloping region between 3.0–1.8 V and by a plateau region between 1.8–1.3 V. Further, there is an additional voltage plateau observed in the case of CF–FeF2, which could be due to inhomogeneity in particle size (evident from SEM, Fig. 3d). FeF2 should react at a single voltage plateau with lithium.35 Bigger particles of FeF2 react at a lower voltage compared to nanocrystalline FeF2 due to the sluggish kinetics, which might have resulted in two different voltage plateaus observed in CF–FeF2. Indeed, two different sized FeF2 crystallites were observed in CF–FeF2 nanocomposites (Fig. 3d). In addition to the plateau at ∼1.8 V, all the C–FeF2 nanocomposites delivered significant capacity in the 3.0–1.8 V region. The discharge capacity contribution in the 3.0 V to 1.8 V region is 37 mA h g−1, 42 mA h g−1, 75 mA h g−1, 54 mA h g−1 for PC–FeF2, CB–FeF2, G–FeF2 and CF–FeF2 respectively. This could be connected to the insertion of lithium into nanocrystalline FeF2. Yamakawa et al. investigated the lithium insertion mechanism into nanocrystalline FeF3 and FeF2 by using solid-state NMR, XRD, and PDF analysis.36 In the case of nanocrystalline FeF2, they also observed significant capacity contribution in the 3.0 V to 1.8 V region, which was attributed to the insertion of Li in FeF2. We can, therefore, attribute the capacity observed in the in the 3.0 V to 1.8 V region to the insertion of lithium into nanocrystalline FeF2.We also investigated the electrochemical performance of C–FeF2 nanocomposites at 40 °C. Fig. 9 shows the discharge/charge curves of C–FeF2 composites obtained at 40 °C. The first discharge capacities of PC–FeF2, CB–FeF2, G–FeF2 and CF–FeF2 are 390, 626, 507, and 318 mA h g−1 respectively. The discharge capacity increased with increase in temperature in all the cases. Similarly, the capacities, in the 3.0 V to 1.8 V region also increased with an increase in cycling temperature. Fig. 10 shows the cycling behavior of C–FeF2 nanocomposites obtained at 25 °C and 40 °C. The electrochemical performance of CB–FeF2 and G–FeF2 correlated well with the particle size and values of electrical resistivity. In the case of C–FeF2 derived from FPC and FCF, capacity faded rapidly and the reversible capacity reduced to 20 mA h g−1 within a few cycles. CB–FeF2 shows high initial capacity, but capacity faded continuously with cycling. A reversible capacity of 145 mA h g−1 was obtained after 70 cycles at 25 °C. In contrast, G–FeF2 composites showed less reversible capacity and rapid capacity fading initially compared to CB–FeF2, but the capacity stabilized after a few cycles. A reversible capacity of 163 mA h g−1 was obtained after 100 cycles at 25 °C. At 40 °C, CB–FeF2 samples showed much faster capacity fading, a reversible capacity of 184 mA h g−1 was obtained after 30 cycles. On the other hand, in G–FeF2 nanocomposites shows less capacity fading and high reversible capacity, a reversible capacity of 340 mA h g−1 was obtained after 30 cycles, which is almost two times to that of CB–FeF2 nanocomposites. The smaller particle size of FCB resulted in high initial capacity due to the reaction of all FeF2 particles but resulted in continuous capacity fading as the carbon in which the FeF2 nanocrystallites embedded is resistive. In contrast, in G–FeF2, capacity faded initially, probably due to the larger particle size of CFx but showed much better cycling stability due to the high conducting nature of graphitic carbon backbone. Pereira et al. investigated the electrochemical properties of C–FeF2 nanocomposites (at 60 °C) synthesized by a combination of chemical and mechanical milling.9 The C–FeF2 nanocomposites showed high capacity of 420 mA h g−1 in the first cycle, but capacity faded rapidly with cycling, similar to CB–FeF2 nanocomposites investigated here.
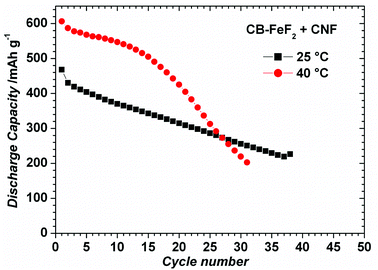
CB–FeF2 composites delivered high reversible capacity, but capacity faded rapidly with cycling due to the low electronic conductivity of the carbon backbone. Enhancing the electronic conductivity CB–FeF2 might mitigate the capacity fading. Therefore, we deliberately added carbon nanofibers (CNF) to CB–FeF2 nanocomposite and electrode were made similar to CNF free CB–FeF2 electrodes. Fig. S5† shows the EIS spectra of PC–FeF2, CB–FeF2, G–FeF2, CF–FeF2 and PC–FeF2 + CNF cells. The resistance of the cells decreased in the order of CB–FeF2 > CF–FeF2 > PC–FeF2 > G–FeF2 which is consistent with DC electronic conductivity measurements. After mixing of CNF, CB–FeF2 cells showed lower resistance compared to all other C–FeF2 cells, which confirms that the overall resistance of the CB–FeF2 electrode reduced significantly after the addition of CNF. Fig. 11 shows the electrochemical performance of CB–FeF2 + CNF cells cycled at 25 °C and 40 °C. The cyclic performance of the cells was similar to the cells of CNF free CB–FeF2 cells. These results elucidate that the electronic conductivity of the carbon which is in direct contact with FeF2 nanocrystallites plays a major role in determining the electrochemical performance of FeF2 while the total amount of even highly conductive carbon that is present in the electrode plays an inferior role.
Conclusion
Four different C–FeF2 nanocomposites were synthesized by reacting Fe(CO)5 with four different CFx precursors at 250 °C. The four C–FeF2 nanocomposites differed in the initial particle size of the carbon matrix, and electronic conductivity of the resulting C–FeF2 nanocomposites. Both particle size and the electronic conductivity play a crucial role in determining the electrochemical performance of the C–FeF2 nanocomposites. G–FeF2 nanocomposites show less capacity fading and highly reversible capacity at 40 °C. Here, a reversible capacity of 340 mA h g−1 was obtained after 30 cycles. The reversible capacity of G–FeF2 nanocomposites can be improved further by reduction of the initial particle size. Further, the electronic conductivity of the carbon that is directly attached to the FeF2 nanocrystallites plays a major role in determining the electrochemical performance of FeF2 rather than the total amount of the carbon that is present in the electrode. The results obtained here provide an opportunity to study and understand the requirements for the design of conversion electrode materials for reversible lithium storage.Conflicts of interest
There are no conflicts to declare.Acknowledgements
MAR acknowledges Advanced Research Chemicals for kindly providing various CFx precursors used in this study.References
- D. Andre, S. J. Kim, P. Lamp, S. F. Lux, F. Maglia, O. Paschosa and B. Stiaszny, J. Mater. Chem. A, 2015, 3, 6709–6732 RSC.
- C. Li, K. Chen, X. Zhou and J. Maier, NPJ Comp. Mat., 2018, 4, 22 CrossRef.
- H. Li, P. Balaya and J. Maier, J. Electrochem. Soc., 2004, 151, A1878–A1885 CrossRef CAS.
- G. G. Amatucci and N. Pereira, J. Fluorine Chem., 2007, 128, 243–262 CrossRef CAS.
- J. Cabana, L. Monconduit, D. Larcher and M. R. Palacin, Adv. Mater., 2010, 22, E170–E192 CrossRef CAS PubMed.
- M. Fichtner, Phys. Chem. Chem. Phys., 2011, 13, 21186–21195 RSC.
- F. Badway, N. Pereira, F. Cosandey and G. G. Amatucci, J. Electrochem. Soc., 2003, 150, A1209–A1218 CrossRef CAS.
- I. Plitz, F. Badway, J. Al-Sharab, A. DuPasquier, F. Cosandey and G. G. Amatucci, J. Electrochem. Soc., 2005, 152, A307–A315 CrossRef CAS.
- N. Pereira, F. Badway, M. Wartelsky, S. Gunn and G. G. Amatucci, J. Electrochem. Soc., 2009, 156, A407–A416 CrossRef CAS.
- T. Li, L. Li, Y. L. Cao, X. P. Ai and H. X. Yang, J. Phys. Chem. C, 2010, 114, 3190–3195 CrossRef CAS.
- L. Li, F. Meng and S. Jin, Nano Lett., 2012, 12, 6030–6037 CrossRef CAS PubMed.
- S. W. Kim, D. H. Seo, H. Gwon, J. Kim and K. Kang, Adv. Mater., 2010, 22, 5260–5264 CrossRef CAS PubMed.
- C. Li, L. Gu, S. Tsukimoto, P. A. van Aken and J. Maier, Adv. Mater., 2010, 22, 3650–3654 CrossRef CAS PubMed.
- C. Li, L. Gu, J. Tong, T. Susumu and J. Maier, Adv. Funct. Mater., 2011, 21, 1391–1397 CrossRef CAS.
- C. Li, L. Gu, J. Tong and J. Maier, ACS Nano, 2011, 5, 2930–2938 CrossRef CAS PubMed.
- B. Li, D. W. Rooney, N. Zhang and K. Sun, ACS Appl. Mater. Interfaces, 2013, 5, 5057–5063 CrossRef CAS PubMed.
- Y. Ma, C. Zhang, G. Jia and J. Y. Lee, J. Mater. Chem., 2012, 22, 7845–7850 RSC.
- K. Rui, Z. Wen, Y. Lu, J. Jin and C. Shen, Adv. Energy Mater., 2015, 5, 1401716 CrossRef.
- Y. Lu, Z. Wen, J. Jin, X. Wu and K. Rui, Chem. Commun., 2014, 50, 6487–6490 RSC.
- Y. Lu, Z. Wen, J. Jin, K. Rui and X. Wu, Phys. Chem. Chem. Phys., 2014, 16, 8556–8562 RSC.
- Y. Lu, Z. Wen, K. Rui, X. Wu and Y. Cui, J. Power Sources, 2013, 244, 306–311 CrossRef CAS.
- R. Prakash, A. K. Mishra, A. Roth, Ch. Kübel, T. Scherer, M. Ghafari, H. Hahn and M. Fichtner, J. Mater. Chem., 2010, 20, 1871–1876 RSC.
- R. Prakash, C. Wall, A. K. Mishra, C. Kübel, M. Ghafari, H. Hahn and M. Fichtner, J. Power Sources, 2011, 196, 5936–5944 CrossRef CAS.
- C. Wall, R. Prakash, C. Kübel, H. Hahn and M. Fichtner, J. Alloys Compd., 2012, 530, 121–126 CrossRef CAS.
- M. Anji Reddy, B. Breitung, V. S. K. Chakravadhanula, C. Wall, M. Engel, C. Kübel, A. K. Powell, H. Hahn and M. Fichtner, Adv. Energy Mater., 2013, 3, 308–313 CrossRef.
- B. Breitung, M. Anji Reddy, V. S. K. Chakravadhanula, M. Engel, C. Kübel, A. K. Powell, H. Hahn and M. Fichtner, Beilstein J. Nanotechnol., 2013, 4, 705–713 CrossRef CAS PubMed.
- M. Anji Reddy, B. Breitung, C. Wall, S. Trivedi, V. S. K. Chakravadhanula, M. Helen and M. Fichtner, Energy Technol., 2016, 4, 201–211 CrossRef.
- L. Lutterotti and P. Scardi, J. Appl. Crystallogr., 1990, 23, 246–252 CrossRef CAS.
- S. Ramasamy, J. Jiang, H. Gleiter, R. Birringer and U. Gonser, Solid State Commun., 1990, 74, 851–855 CrossRef CAS.
- G. LeCaer and E. Bauer-Grosse, Hyperfine Interact., 1989, 47, 55–67 CrossRef.
- A. A. El-Barbary, S. Trasobares, C. P. Ewels, O. Stephan, A. V. Okotrub, L. G. Bulusheva, C. J. Fall and M. I. Heggie, J. Phys.: Conf. Ser., 2006, 26, 149–152 CrossRef.
- K. N. Kushita and K. Hojou, Ultramicroscopy, 1991, 35, 289–293 CrossRef CAS.
- F. Cosandey, J. F. Al-Sharab, F. Badway, G. G. Amatucci and P. Stadelmann, Microsc. Microanal., 2007, 13, 87–95 CrossRef CAS PubMed.
- M.-C. Lee and G. Simkovich, Metal. Trans. A, 1987, 18, 485 CrossRef.
- F. Wang, H.-C. Yu, M.-H. Chen, L. Wu, N. Pereira, K. Thornton, A. Van der Ven, Y. Zhu, G. G. Amatucci and J. Graetz, Nat. Commun., 2012, 3, 1201 CrossRef PubMed.
- N. Yamakawa, M. Jiang, B. Key and C. P. Grey, J. Am. Chem. Soc., 2009, 131, 10525–10536 CrossRef CAS PubMed.
Footnotes |
| † Electronic supplementary information (ESI) available. See DOI: 10.1039/c8ra07378c |
| ‡ Presently at Materials Characterisation Division, Vikram Sarabhai Space Centre, Trivandrum, India. |
| This journal is © The Royal Society of Chemistry 2018 |

