 Open Access Article
Study on the growth rate of natural gas hydrate in water-in-oil emulsion system using a high-pressure flow loop
Xiaofang Lv *a,
Bohui Shi
 b,
Shidong Zhoua,
Haoping Penga,
Yun Leia and
Pengfei Yua
aJiangsu Key Laboratory of Oil and Gas Storage & Transportation Technology, School of Petroleum Engineering, Changzhou University, Changzhou, Jiangsu 213016, China. E-mail: lvxiaofang5@cczu.edu.cn; lvxiaofang5@126.com; Tel: +86-0519-8329-0280
bTechnology National Engineering Laboratory for Pipeline Safety, China University of Petroleum, Beijing 102249, China
First published on 29th October 2018
Abstract
Hydrate slurry transport technology in deep-water pipelines has become a focal point among worldwide researches, due to its high economic efficiency. However, as the key part of the hydrate slurry transport technology research, the mechanism and laws of natural gas hydrate growth dynamics are still unclear in the flow emulsion system. On this basis, we have conducted a series of growth kinetic experiments in a high-pressure loop, investigated systematically several influencing factors (i.e. the flow rate, water-cut, AA concentration and so on) of growth kinetics, obtained the quantitative relations between these factors and the gas consumption as well as the hydrate growth rate (gas consumption rate). It could be gained from analysis of these influencing factors, that the hydrate growth rate has an extreme value (maximum) during the formation process in a slurry system. The controlling factor of hydrate formation differed at the stages before and after this maximum value. The intrinsic kinetics controlled before the value while heat/mass transfer influenced after it. The time needed for the hydrate growth rate to reach the maximum point was generally within 0.5 h after the hydrate mass formation.
1. Introduction
Clathrate hydrates are ice-like solids formed from hydrogen-bonded water molecules stabilized by the insertion of a guest molecule (such as methane and other light hydrocarbons) into a water cage. In particular, hydrates exist when conditions of high pressure and low temperature accompany a system of water with molecules of ideal size and shape for stabilizing water cages. The most common hydrates found in nature are known as structures I and II.1 Hydrates are known to exist in natural gas and oil producing pipelines and production equipment.2 Hydrate accumulations that form in oil and gas pipelines can hinder normal production. This is very costly to industry in terms of both hydrate mitigation and hydrate plug remediation.3 So it has become necessary to develop technologies to manage hydrate formation. The process of hydrate formation is similar to crystallization and can be divided into two steps: nucleation4,5 and growth.1,6In order to enable the growth of the hydrate, a continuous supply of water and gas molecules must reach the crystal surface, where these undergo a phase change, liberating a certain amount of energy, the heat of hydrate formation. If this energy is not effectively removed from the vicinity of the crystal, a local temperature rise will occur, reducing the driving force for further growth and favoring hydrate decomposition. Similarly, if the liquid is not saturated with the gas and/or the transport rate of gas molecules to the vicinity of the crystal was not sufficiently large, a local drop in the gas concentration will develop, which poses an unfavorable environment for further growth. Therefore, there are factors related to the local heterogeneity of the mixture in the reactor that, apart from the thermodynamic driving force, can affect and even control the growth rate of hydrate crystals.
Evidence in favor of diffusion-controlled kinetics was reported by Mori7 for the hydrate formation. On the other hand, Mochizuki and Mori8,9 observed that the rate of heat removal from the reactor was the kinetic limiting step. In addition, experimental evidences of hydrate growth controlled by the interfacial reaction of hydrate formation were obtained by Pangborn and Barduhn10 for methyl bromide hydrate in a stirred reactor. They found that increasing the impeller power input (calculated from the stirring rate) caused an increased rate, however, at a certain power input no further increase in rate occurred. This was interpreted as strong evidence that above a certain power input, heat and mass transfer were no longer limiting factors on the formation rate.
Some of the pioneering hydrate growth rate experiments were performed by Vysniauskas and Bishnoi,11 where the intrinsic kinetic rate of methane hydrate formation in pure water was investigated in an autoclave reactor. They measured the rate of methane hydrate formation (in terms of gas consumption rate) in a semi-batch reactor, and found that the rate depended on the gas–liquid interfacial area, pressure, temperature and subcooling. Also, they concluded that the gas–liquid interface was the most likely place for hydrate formation to take place, because in liquid bulk, the methane concentration was too low. Experiments with ethane confirmed the observed effects.12 Englezos13 performed similar work for methane and ethane hydrate formation, and founded that the effective rate constant at the hydrate particle surface during formation did not change with increased impeller speed over ∼400 rpm. This was an indication that the resistive boundary for mass transfer at the particle interface was eliminated; however, this method did not consider mass transfer limitations at the gas water interface. Skovberg14 proposed that the Englezos13 model for hydrate growth rates in water could be simplified by assuming mass transfer limitations across the gas–water interface, rather than intrinsic kinetics. At the same time, Parlaktuna et al.15 and Narita et al.16 measured the formation rate of methane and natural gas mixture in a batch reactor. They identified the subcooling and stirring rate as important parameters.
In addition, in the case of disperse systems containing bubbles or drops, the formation of hydrate layer at the whole surface of the fluid particles eliminated the direct contact between the reacting phases, which could result in the development of an additional resistance to the further growth of the hydrate layer, reducing the growth rate. Hirai17 followed the dissolution of CO2 drops placed in a pressurized water flow field at different operating conditions and verified that the hydrate coverage of the surface indeed reduced the drop shrinking rate significantly, but this rate remained greater than zero. In perfect agreement with these results, in the case of hydrate formation from ice, different researchers18–22 reported a sheer drop in the gas consumption rate with time to values very close to zero as the hydrate was formed. When solid inert particles were included in the reactor and operation took place with vibration, aiming at the breakage of the forming hydrate layer to prevent it from eliminating the direct gas-ice contact, this sheer drop disappeared and the gas consumption increased considerably.
Very little experimental work has been performed on the evaluation of gas hydrate formation in flow conditions in a long pipe line.23 What has been done was to try to simulate these conditions in a laboratory loop and study the hydrate formation.24–36 Turner et al.23 and Lv et al.26 proposed a hydrate formation mechanism, expressed as hydrates forming and growing as shells outside the water droplets entrained in the oil phase, as water-in-oil emulsion. Shi et al.29,30 developed an inward and outward hydrate growth shell model to describe hydrate formation in a water-in-oil emulsion system, which considered the influences of kinetics as well as mass and heat transfer on hydrate formation. Lorenzo et al.31,32 investigated the hydrate formation process in annular flow systems, and they founded that changing the gas/liquid flow rates (or gas/liquid volume fractions) could influence the hydrate formation rate. Then, Cassar et al.33 conducted hydrate formation experiments in both the annular flow system and the stratified flow system. They also confirmed that the gas–water flow pattern affected the hydrate formation rate and plugging time apparently in both systems. Joshi et al.,25 Zerpa et al.,34 Hegde et al.35 investigated the hydrate formation process in the multiphase flow system. They founded that the hydrate formation process was affected by factors such as phase interface, pressure, supercooling degree and heat and mass transfer. Although there has been a part of the research results, the mechanism and laws of natural gas hydrate growth dynamics were still unclear in the flow emulsion system.
Therefore, it was important to investigate the natural gas hydrate growth kinetics in a flowing pipeline system. It not only would simulate the kinetic rules for the hydrate growth in a real pipeline, but also could provide essential kinetic parameters and data supports for the future hydrate growth dynamics simulation and prediction. On this basis, this paper has conducted a series of growth kinetic experiments in a high-pressure loop which was built for the hydrate studies. Moreover, it has investigated systematically several influencing factors (i.e. the flow rate, pressure, temperature set, water-cut and AA concentration) of growth kinetics, obtained the quantitative relations between these factors and the gas consumption as well as the hydrate growth rate (gas consumption rate).
2. Experimental apparatus and procedure
2.1 High pressure hydrate experimental loop
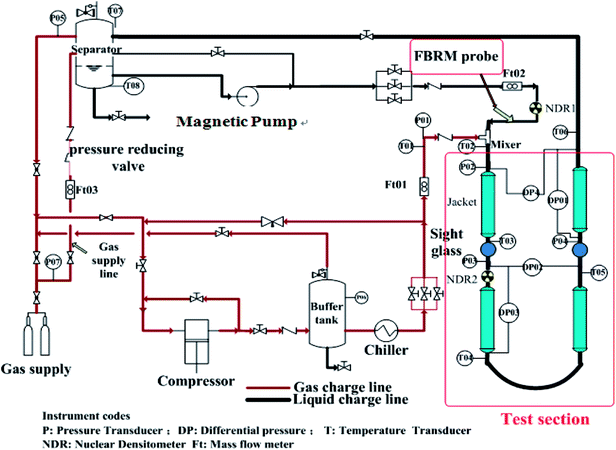
Experimental tests have been carried out in the high pressure hydrate experimental loop for flow assurance studies (Fig. 1). Natural gas and liquid phase are separately injected by a plunger compressor (with measuring error ±0.5%) and a custom-made magnetic pump (with measuring error ±0.5%) into the loop. It should be noted here that though this pump is designed to have a minimal destructive impact on the hydrate.Two sight glasses sit in the test sections. The gas injection point is the test section inlet. At the outlet of the test section gas and liquid collect in an insulated separator and are re-directed toward the test section compressor (from the upper part) and pump (from the bottom), respectively. Several tanks allow maintenance of loop and separator pressure as hydrate forms. The 30 m stainless steel test section consisted of two rectilinear horizontal lengths joined together to form a pipe with 2.54 cm (1 inch) internal diameter, and a 5.08 cm (2 inches) diameter jacket circulating a water–glycol blend surrounded the test section. Process temperature control ranged −20° to 100 °C (with measuring error ±0.05 °C).
2.2 The hydrate experimental loop instrumentation
This experimental flow loop27 is equipped with several sensors. Thermocouples (with measuring error ±0.075%) are regularly set along the pipe, inside the separator, inside the water/glycol system and on the different gas utilities. A Coriolis flowmeter (with measuring error ±0.05%) measures the density of the liquid mixture and the flow rate. The mean density of the multiphase fluid can also be measured using two FM1000 gamma ray densitometers (with measuring error ±0.1%). Differential pressure sensors (with measuring error ±0.075%) are located along the loop to follow the evolution of the linear pressure drop along the loop. A rapid data acquisition is used to detect rapid phenomena.A focused-beam reflectance measurement (FBRM) probe (with measuring error ±0.2 μm) allows monitoring evolution of objects-droplets, bubbles, solid particles—carried inside the flow. The FBRM contains a low-intensity rotating laser beam reflected when intercepting a particle. Measuring the reflection time allows deduction of a chord length. Assignment of a chord-length distribution (CLD) and a mean chord length followed every measurement equal to 10 s. The CLD gives an idea of particle size distribution (PSD) of objects carried by the flow. The lower and upper limits of the FBRM CLD are 0.5 μm and 1000 μm, respectively. A presentative sampling of the particle size distribution recommended installation of the particle size analyzer on the straight vertical pipe ahead of the experimental loop's inlet. The analyzer's probe window cuts the stream lines at a 45° angle beginning at the center of the pipe.
2.3 Fluids
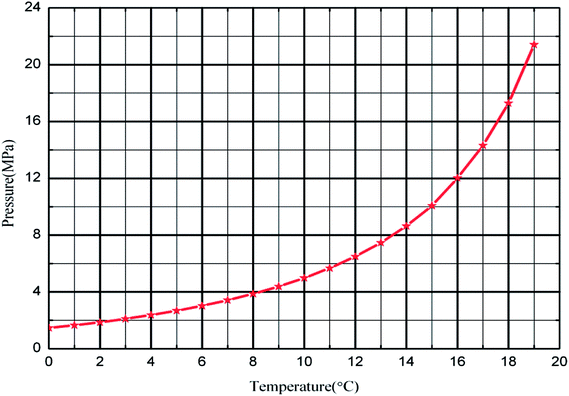
To better simulate the practical situation, deionized water, civil natural gas and −20# diesel were employed for these tests, shown as Table 1 and 2. The anti-agglomerants used in this work was a re-compounded one containing Span 20, thus “AAs” was adopted throughout this paper. An electronic balance weighed the quality of AAs, with measuring error ±0.01%, and a high-pressure piston pump adjusted concentration of AAs in the water phase to 0 wt%, 1 wt% and 3 wt%. The natural gas hydrate formation curve (Fig. 2) could be defined by the Chen–Guo37 model with the natural gas composition.| Composition | mol% | Composition | mol% |
|---|---|---|---|
| N2 | 1.53 | C3 | 3.06 |
| CO | 2.05 | iC4 | 0.33 |
| CO2 | 0.89 | iC5 | 0.04 |
| C1 | 89.02 | nC6+ | 0.01 |
| C2 | 3.07 | — | — |
| Composition | mol% | Composition | mol% |
|---|---|---|---|
| C11 | 0.89 | C16 | 6.83 |
| C12 | 3.36 | C17 | 7.99 |
| C13 | 5.38 | C18 | 7.46 |
| C14 | 6.2 | C19 | 6.38 |
| C15 | 6.78 | C20+ | 48.73 |
2.4 Test protocol
(1) The entire experimental loop is vacuumed until the vacuum degree reaches 0.09 MPa.(2) The loop is loaded with diesel and water (100 vol% liquid loading). The total volume of the liquid keeps constant at 70 L and the water cut (15%, 20%, 30%) is defined as the ratio of water volume to the total liquid volume. The gas-supply unit begins to inject gas into the separator until achieving the aimed experimental pressure (4–7 MPa in this paper).
(3) Start the temperature control system, on-line particle size analyzer, and the magnetic pump, to circulate the water and oil at constant flow rate (such as: 0.6 m s−1, 1.0 m s−1, 1.2 m s−1) then to form a homogeneous and stable emulsion with the set AAs dosage (such as: 0%, 1%, 3%) for each test. The stability of water/oil emulsion referred to a relative stable process (dynamic stability) according to the measured data from FBRM under shearing action. This was to say that the emulsion was regarded stable when the average chord length of droplets fluctuated in ±0.2 μm within 2 h.
(4) Under the initial pressure (4–7 MPa), temperature (20 °C) and initial flow velocity (0.6 m s−1, 1.0 m s−1, 1.2 m s−1), start the natural gas hydrate growth dynamics experiment, the temperature gradually decreases to the set value (−1 °C, 1 °C and 3 °C). During the hydrate formation process, data acquisition system collects the variable values continuously of the fluid (i.e. the temperature, pressure, pressure drop, flow rate, density, and chord length).
(5) A round of experiments finishes at the end of the formation process when all measured data are stable, such as the system pressure and temperature. Each group experiment lasts about 4–6 hours.
(6) The dissociation of hydrate is carried out by increasing the temperature up to 40 °C (with the heating rate of 15 °C h−1). The system is kept in these conditions during 24 hours with the aid of the particle size analyzer preparing for a next round.
3. Results and discussion
3.1 Reproducibility of flow-loop tests
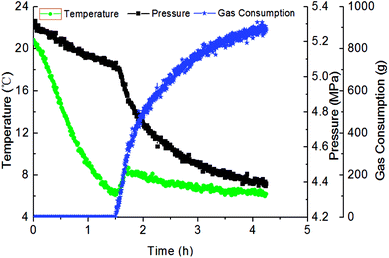
Fig. 3 has presented the trends of pressure, temperature and gas consumption with time in a series of hydrate growth kinetics experiments. In this figure, it could be seen that the system pressure and temperature have changed obviously during the hydrate growth. As the hydrate grew, system temperature increased notably indicating the exothermic reaction, while system pressure went down rapidly. With further hydrate growth, the gas consumption kept rising yet at a reduced consuming rate. Here this change of gas consumption rate (as shown in Fig. 5) reflected that the hydrate growth process was an integrated process of the crystallization kinetics, heat transfer and mass transfer. The gradual decrease of gas consumption rate indicated that the mass transfer process of the subsequent formation of hydrate would be hindered once the water drop was covered by the hydrate shell in the oil–water emulsion system.At the same time, repetitive experiments have been conducted on the hydrate growth in a pipeline system, in order to guarantee the reliability of these experimental data and the universality of the grow rule. The results were shown in Fig. 4 and 5. These hydrate formation kinetics experiments had good reproducibility.
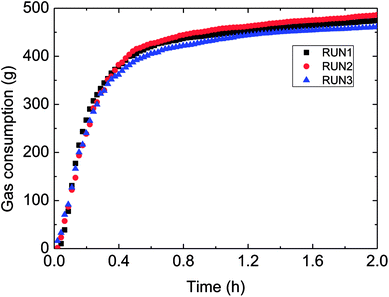 | ||
| Fig. 4 Gas consumption during three reproduced formation experiments in the flow-loop (15% water-cut, 5 MPa, 1.0 m s−1 flow rate). | ||
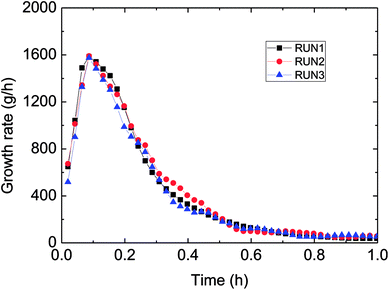 | ||
| Fig. 5 Growth rate (gas consumption) during three reproduced formation experiments in the flow-loop (15% water-cut, 5 MPa, 1.0 m s−1 flow rate). | ||
3.2 Influence of initial experimental pressure on formation kinetics
Fig. 6 showed the influence of the initial experimental pressure on the gas consumption in the hydrate formation. It could be seen in this figure that the gas consumption went up with rising initial pressure. Meanwhile, the gas consumption–time curves indicated that the hydrate growth rate (gas consumption rate) increased at first and then decreased during the whole formation process. Moreover, the trend of the growth rate varied with initial pressure coincided with that of gas consumption with initial pressure, as shown in Fig. 7. It means that the controlling factor of hydrate formation differed at different stages of hydrate growth process. The intrinsic kinetics controlled at the beginning stage of hydrate formation, while then with further reaction, heat/mass transfer influenced after the hydrate shell had wrapped the water droplet. Therefore, the hydrate growth process was an integrated one referring to the intrinsic kinetics, heat and mass transfer, and fluid mechanics. The main reason for the above experimental phenomena was that the degree of supersaturation (hydrate growth driving force) of the system increased with the initial pressure. That is why the growth rate as well as gas consumption were in direct proportion to the initial experimental pressure.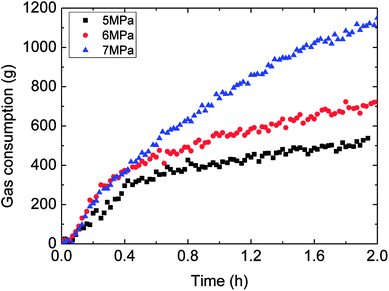 | ||
| Fig. 6 The influence of the initial experimental pressure on the gas consumption (1.0 m s−1 flow rate, control temperature 1 °C, 30% water-cut). | ||
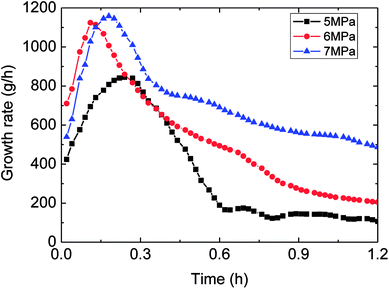 | ||
| Fig. 7 The trend of growth rate against with time (1.0 m s−1 flow rate, control temperature 1 °C, 30% water-cut). | ||
3.3 Influence of water cut on formation kinetics
Fig. 8 and 9 presented the influence of the water-cut on gas consumption and hydrate growth rate. It could be seen in Fig. 8 that the higher water-cut resulted in the greater gas consumption during hydrate formation. Yet the gas consumption–time trend indicated that its growth rate was not monotonously increased with the water-cut increasing, as shown in Fig. 9.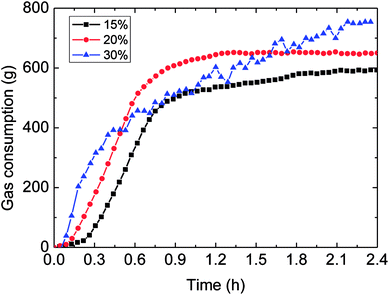 | ||
| Fig. 8 The influence of the water-cut on gas consumption (1.0 m s−1 flow rate, control temperature 1 °C, 6 MPa). | ||
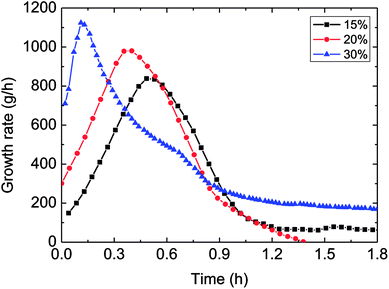 | ||
| Fig. 9 The influence of the water-cut on the growth rate (1.0 m s−1 flow rate, control temperature 1 °C, 6 MPa). | ||
It could be known in Fig. 9: before the hydrate growth rate reached the peak value, this rate went up but the time period needed to get the peak reduced with the increased water-cut; while after it past the maximum value, the rate went down with time. The reason contributed to these experimental phenomena was that: higher water-cut meant larger oil–water interphases per unit volume, under the same driving force, so the intensified mass transfer led to increased growth rate at the beginning of hydrate formation. However, higher water-cut brought about less solved gas per unit volume at the same time, impeded the mass transfer in the further hydrate formation. Their combined effect contributed to the above experimental result. Meanwhile, it also illustrated that mass transfer played a part in the formation process.
3.4 Influence of flow rate on formation kinetics
Fig. 10–12 demonstrated the influence of the flow rate on the gas consumption and growth rate during hydrate formation in a pipeline system. It could be got from the experimental rules in these figures that the gas consumption trend decreased with the faster flow rate in a pipeline system. In other words, the increased flow rate have reduced the hydrate growth rate, restrained the hydrate formation to some extent, which was particularly evident at 30% water-cut condition (as shown in Fig. 10). This was different with previous flow rate-gas consumption trends reported in literatures of a reaction11–13,15,16 or a loop.23,25 It was obvious here that the effect of intensified mass transfer overwhelmed the effect of decreased formation driving force, due to the increased flow rate (larger flow rate led to reduced degree of supersaturation or supercooling, or cooling rate).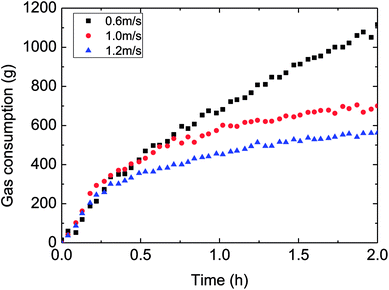 | ||
| Fig. 10 The influence of flow rate on the gas consumption (control temperature −1 °C, 6 MPa, 30% water-cut). | ||
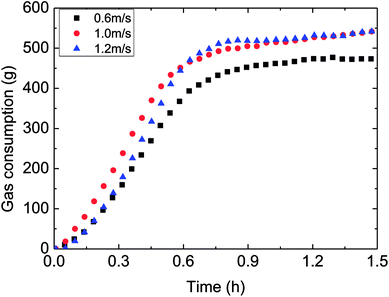 | ||
| Fig. 11 The influence of flow rate on the gas consumption (control temperature −1 °C, 6 MPa, 15% water-cut). | ||
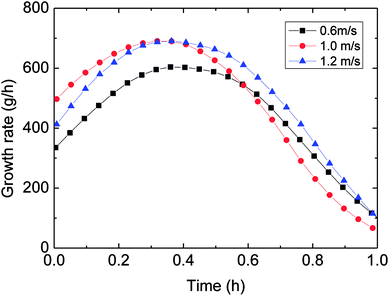 | ||
| Fig. 12 The influence of flow rate on the growth rate (control temperature −1 °C, 6 MPa, 15% water-cut). | ||
Therefore, it was necessary to analyze the reason for the mentioned difference. Under the same temperature set, hydrate began to form at similar temperature for various flow rates. But it took different time spans form the start to hydrate formation, i.e. longer time was needed to form hydrate at a larger flow rate. That is, the average cooling rate was reduced with increasing flow rate in the actual loop. This was the main reason for the trend that gas consumption decreased with higher flow rate.
In general, the influence of the flow rate on the gas consumption and growth rate could be concluded: under the same temperature set, average cooling rate has been slowed down with increased flow rate, resulting in reduced degree of supercooling and restraining the hydrate formation. Then it brought about the experimental phenomenon that hydrate growth rate and gas consumption went down with increased flow rate. This average cooling rate concept has integrated the effects of both outside temperature set and flow rate on the temperature drop. It overcame the difficult explaining the gas consumption variation simply from the aspect of the flow rate. And it also exhibited the complexity of influencing factors of hydrate formation in the actual pipeline system.
3.5 Influence of temperature set on formation kinetics
The outside temperature set influenced the flow cooling rate in the loop. Therefore, the lower the temperature set, the greater the flow cooling rate, then to influence the hydrate growth rate and gas consumption. Detail experimental rules were shown in Fig. 13 and 14. It could be seen in Fig. 13 that gas consumption increased with declined temperature set. Meanwhile, the growth rate was also accelerated under lower temperature set. In Fig. 14, the faster cooling rate led to the more obviously increased hydrate growth rate.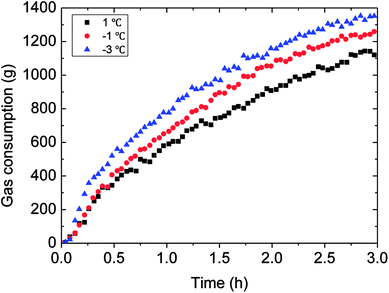 | ||
| Fig. 13 The influence of the temperature set on the gas consumption (0.6 m s−1 flow rate, 6 MPa, 30% water-cut). | ||
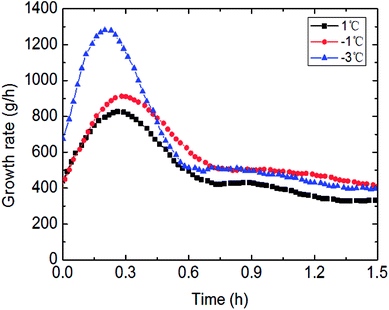 | ||
| Fig. 14 The influence of the temperature set on the growth rate (0.6 m s−1 flow rate, 6 MPa, 30% water-cut). | ||
3.6 Influence of AA concentration on formation kinetics
This paper has investigated the influence of the AA concentration on the hydrate formation process in a pipeline system, as shown in Fig. 15 and 16. It could be concluded from Fig. 15 that the gas consumption rose with more AA addition, yet it was not very sensitive to AA at the beginning of hydrate formation. Fig. 16 presented the variation of growth rate with AA concentration. It also could be known that the growth rate changed little with increased AA concentration. But compared to other influencing factors, the AA addition has greatly shortened the time needed for the growth rate to reach the maximum value. That was due to AA addition gave rise to smaller water droplets in this emulsion system. Under a certain nucleation rate, smaller water droplets had faster shell formation rate. Then it would reach the maximum growth rate earlier, and turn into a formation process controlled by the mass transfer.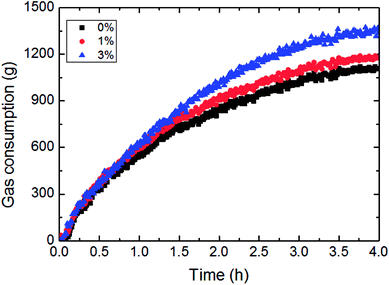 | ||
| Fig. 15 The influence of the AA concentration on the gas consumption (1.2 m s−1 flow rate, 6.5 MPa, 30% water-cut, control temperature −1 °C). | ||
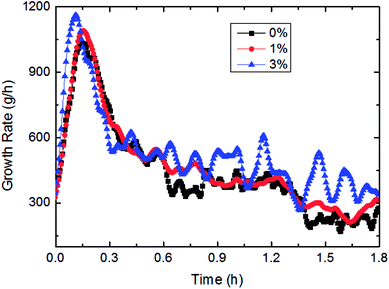 | ||
| Fig. 16 The influence of the AA concentration on the growth rate (1.2 m s−1 flow rate, 6.5 MPa, 30% water-cut, control temperature −1 °C). | ||
4. Conclusions
(1) It could be gained from analysis of these influencing factors, that the hydrate growth rate has an extreme value (maximum) during the formation process in a slurry system. The controlling factor of hydrate formation differed at the stages before and after this maximum value. The intrinsic kinetics controlled before the value while heat/mass transfer influenced after it. For the latter, in the future studies, the influence from either heat transfer or mass transfer could be recognized by the variations of gas consumption, pressure, temperature, and growth rate with time. If the growth rate would still go up on the left side of the maximum value at the temperature-rising stage of hydrate formation, it then could be deduced that the mass transfer rather than heat transfer is the real control factor of the late growth stage.(2) In the formation process of 15–30% water-cut slurry system, the time needed for the hydrate growth rate to reach the maximum point was generally within 0.5 h after the hydrate mass formation, regardless the diversified experimental conditions. While it has to be noted here that this needed time still fluctuated with different conditions. For example, this needed time period was greatly shortened with an increased water-cut in the system.
(3) The hydrate growth process was the one in which these nucleated water droplets formed shells instantly, when the growth rate had not reach its maximum value. In this stage, the nucleation of water droplets had the reproductive property, but there was probably a certain proportion of droplet nucleation. This initial nucleation proportion still need further research to quantify.
Conflicts of interest
There are no conflicts to declare.Acknowledgements
This work was supported by the National Science Foundation for Young Scientists of China (Grant No. 51804046), PetroChina Innovation Foundation (Grant No. 2018D-5007-0602) and Natural Science Research Project of Jiangsu colleges and Universities (Grant No. 18KJB440001).References
- E. D. Sloan and C. A. Koh, Clathrate Hydrates of Natural Gas, CRC Press, Taylor & Francis Group, Boca Raton, FL, 3rd edn, 2008 Search PubMed.
- E. G. Hammerschmidt, Formation of gas hydrates in natural gas transmission lines, Ind. Eng. Chem., 1934, 26(8), 851–855 CrossRef CAS.
- E. Sloan, C. Koh, A. Sum, et al., Natural gas hydrates in flow assurance, Elsevier, Amsterdam, Boston, Heidelberg, London, New York, Oxford, Paris, San Diego, San Francisco, Singapore, Sydney, Tokyo, 2010 Search PubMed.
- Y. Bi and T. Li, Probing methane hydrate nucleation through the forward flux sampling method, J. Phys. Chem. B, 2014, 118, 13324–13332 CrossRef CAS PubMed.
- D. Kashchiev and A. Firoozabadi, Nucleation of gas hydrates, J. Cryst. Growth, 2002, 243, 476–489 CrossRef CAS.
- X. F. Lv, B. H. Shi and Y. Wang, et al., Experimental study on hydrate induction time of gas-saturated water-in-oil emulsion using a high-pressure flow loop, Oil Gas Sci. Technol., 2015, 70, 1111–1124 CrossRef CAS.
- Y. H. Mori and T. Mochizuki, Mass transport across clathrate hydrate films-a capillary permeation model, Chem. Eng. Sci., 1997, 52(20), 3613–3616 CrossRef CAS.
- Y. H. Mori, Estimating the thickness of hydrate films from their lateral growth rates: application of a simplified heat transfer model, J. Cryst. Growth, 2001, 223(1–2), 206–212 CrossRef CAS.
- T. Mochizuki and Y. H. Mori, Clathrate hydrate film growth along water/hydrate-former phase boundaries-numerical heat transfer study, J. Cryst. Growth, 2006, 290(2), 642–652 CrossRef CAS.
- J. B. Pangborn and A. J. Barduhn, The kinetics of methyl bromide hydrate formation, Desalination, 1970, 8, 35–68 CrossRef CAS.
- A. Vysniauskas and P. R. Bishnoi, A kinetic study of methane hydrate formation, Chem. Eng. Sci., 1983, 38(7), 1061–1072 CrossRef CAS.
- A. Vysniauskas and P. R. Bishnoi, Kinetics of ethane hydrate formation, Chem. Eng. Sci., 1985, 40(2), 299–303 CrossRef CAS.
- P. Englezos, N. Kalogerakis, P. D. Dholabhai and P. R. Bishnoi, Kinetics of formation of methane and ethane gas hydrates, Chem. Eng. Sci., 1987, 42(11), 2647–2658 CrossRef CAS.
- P. Skovberg and P. Rasmussen, A mass transport limited model for the growth of methane and ethane gas hydrates, Chem. Eng. Sci., 1994, 49(8), 1131–1143 CrossRef.
- M. Parlaktuna and J. S. Gudmundsson, Formation rate of methane and mixture hydrate, 2nd International Conference on Natural Gas Hydrate Proceedings, Toulouse,France, 1996 Search PubMed.
- H. Narita and T. Uchida, Studies on Formation/Dissociation Rates of Methane Hydrate, 2nd International Conference on Natural Gas Hydrate Proceedings, Toulouse, France, 1996 Search PubMed.
- S. Hirai, K. Okazaki and N. Araki, et al., Transport phenomena of liquid CO2 in pressurized water flow with clathrate-hydrate at the interface, Energy Convers. Manage., 1996, 37, 1073–1078 CrossRef CAS.
- L. A. Stern, S. H. Kirby, S. Circone and W. B. Durham, Scanning Electron Microscopy investigations of laboratory-grown gas clathrate hydrates formed from melting ice, and comparison to natural hydrates, Am. Mineral., 2004, 89(8–9), 1162–1175 CrossRef CAS.
- V. A. Vlasov, Diffusion model of gas hydrate formation from ice, Heat Mass Transfer, 2015, 52(3), 531–537 CrossRef.
- V. A. Vlasov, Phenomenological diffusion theory of formation of gas hydrate from ice powder, Theor. Found. Chem. Eng., 2012, 46(6), 576–582 CrossRef CAS.
- W. F. Kuhs, D.K. Staykova and A. N. Salamatin, Formation of Methane Hydrate from Polydisperse Ice Powders, J. Phys. Chem. B, 2006, 110(26), 13283 CrossRef CAS PubMed.
- A. Falenty, A. N. Salamatin and W. F. Kuhs, Kinetics of CO2-Hydrate Formation from Ice Powders: Data Summary and Modeling Extended to Low Temperatures, J. Phys. Chem. C, 2013, 117(16), 8443–8457 CrossRef CAS.
- D. J. Turner, Clathrate hydrate formation in water-in-oil dispersions, Dissertation, Colorado School of Mines, Golden, CO, 2009.
- H. Kim, J. Park and Y. Seo, et al., Hydrate risk management with aqueous ethylene glycol and electrolyte solutions in thermodynamically under-inhibition condition, Chem. Eng. Sci., 2017, 158, 172–180 CrossRef CAS.
- S. V. Joshi, G. A. Grasso and P. G. Lafond, et al., Experimental flow loop investigations of gas hydrate formation in high water cut systems, Chem. Eng. Sci., 2013, 97, 198–209 CrossRef CAS.
- X. F. Lv, B. H. Shi and Y. Wang, et al., Study on gas hydrate formation and hydrate slurry flow in multiphase transportation system, Energy Fuels, 2013, 27(12), 7294–7302 CrossRef CAS.
- X. F. Lv, J. Gong and W. Q. Li, et al., Experimental study on natural gas hydrate slurry flow, SPE J., 2014, 19(2), 206–214 CrossRef.
- K. L. Yan, C. Y. Sun and J. Chen, et al., Flow characteristics and rheological properties of natural gas hydrate slurry in the presence of anti-agglomerant in a flow loop apparatus, Chem. Eng. Sci., 2014, 106, 99–108 CrossRef CAS.
- B. H. Shi, J. Gong and C. Y. Sun, et al., An inward and outward natural gas hydrates growth shell model considering intrinsic kinetics, mass and heat transfer, Chem. Eng. J., 2011, 171(3), 1308–1316 CrossRef CAS.
- B. H. Shi, Y. Liu and L. Ding, et al., New Simulator for Gas-Hydrate Slurry Stratified Flow Based on the Hydrate Kinetic Growth Model, J. Energy Resour. Technol., 2019, 141, 012906 CrossRef.
- M. Di Lorenzo, Z. M. Aman and G. Sanchez Soto, et al., Hydrate formation in gas-dominant systems using a single-pass flow loop, Energy Fuels, 2014, 28, 3043–3052 CrossRef CAS.
- M. Di Lorenzo, Z. M. Aman and K. Kozielski, et al., Under Inhibited Hydrate Formation and Transport Investigated Using a Single-Pass Gas-Dominant Flow loop, Energy Fuels, 2014, 28, 7274–7284 CrossRef CAS.
- C. Cassar, A. Sinquin, A. Teixeira, et al., Hydrate formation in gas dominant systems: influence of the flow pattern, 12th Offshore Mediterranean Conference and Exhibition, Ravenna, Italy, 2015 Search PubMed.
- L. E. Zerpa, O. I. Ra and Z. M. Aman, et al., Multiphase flow modeling of gas hydrates with a simple hydrodynamic slug flow model, Chem. Eng. Sci., 2013, 99, 298–309 CrossRef CAS.
- G. A. Hegde, A. K. Sum and T. J. Danielson, Multiphase Flow Modeling for Gas Hydrates in Flow Assurance, Offshore Technology Conference, Houston, Texas, USA, 2015 Search PubMed.
- L. Ding, B. H. Shi and X. F. Lv, et al., Hydrate formation and plugging mechanisms in different gas–liquid flow patterns, Ind. Eng. Chem. Res., 2017, 56, 4173–4184 CrossRef CAS.
- G. J. Chen and T. M. Guo, A New Approach to Gas Hydrate Modeling, Chem. Eng. J., 1998, 71(2), 145–151 CrossRef CAS.
| This journal is © The Royal Society of Chemistry 2018 |

