 Open Access Article
PtRu/C catalyst slurry preparation for large-scale decal transfer with high performance of proton exchange membrane fuel cells†
Mihwa Choi‡
 ab,
Jong Kwan Kim‡c,
Jungsuk Kimab,
Seugran Yanga,
Ji-Eun Park
 de,
Ok-Hee Kim
 *f and
Yong-Hun Cho
 *c
*c
aCreative Future Laboratory, Korea Electric Power Corporation (KEPCO) Research Institute, Daejeon 34056, South Korea
bDepartment of Chemistry, Sogang University, Seoul 04107, South Korea
cDepartment of Chemical Engineering, Kangwon National University, Samcheok 25913, South Korea. E-mail: yhun00@gmail.com
dCenter for Nanoparticle Research, Institute for Basic Science (IBS), Seoul 08826, South Korea
eSchool of Chemical and Biological Engineering, Seoul National University (SNU), Seoul 08826, South Korea
fDepartment of Science, Republic of Korea Naval Academy, Jinhae-gu, Changwon 51704, South Korea. E-mail: koh0715@gmail.com
First published on 25th October 2018
Abstract
The large-area membrane-electrode assembly (MEA) has been fabricated using the decal transfer method with a methanol (MeOH)-based PtRu/C catalyst slurry. The stability of slurry dispersion is important when using a large-area decal transfer method to ensure the integrity of the electrode. In order to prepare stable and well dispersed catalyst slurry, a suitable solvent for the PtRu/C catalyst should be selected. We considered the physical properties of various organic solvents, including ionomer solubility, dielectric constant, and catalyst particle surface physical properties. We found that the MeOH-based PtRu/C slurry dispersion showed the best stability and dispersibility of catalyst–ionomer agglomerates. It was also confirmed that the MeOH-based slurry has the most suitable characteristics for coating the slurry on the substrate film. The decal technique-based MEA using this slurry showed excellent performance when compared with the spray method-based MEA. Furthermore, the large-area PtRu/C MEA with an active area of 51.84 cm2 was fabricated and excellent performance was realized even when a reforming gas was used.
Introduction
Scientific studies related to proton exchange membrane fuel cells (PEMFCs) can be roughly divided into two categories: (1) more theoretical and lab-scale research on catalyst synthesis, nano-structure (alloy or non-precious metal catalysts, core/shell structure) of electrocatalyst, and oxygen reduction reaction (ORR) mechanisms related studies, mainly using half-cell data;1–5 and (2) more practical and industrial-scale research like membrane-electrode assembly (MEA) studies aimed at achieving optimal/maximum performance for practical application of fuel cell technology in the field, mainly using single-cell data.6–10 While it is scientifically important to develop platinum (Pt) catalyst alternatives or to explore catalytic mechanisms that will be the foundation for technology development in the future,1–3 MEA studies are also significant for immediate practical application and the commercialization of related scientific studies.9MEAs are composed of five parts as follows: a cathode gas diffusion layer and a cathode catalyst layer, an electrolyte membrane, an anode catalyst layer and an anode gas diffusion layer. In particular, the shapes of catalyst layer structures, such as pore size and ionomer distribution within electrodes, considerably affect the catalyst's performance. The fuel cell performance is based on the manufacturing method, how to fabricate the catalyst particles over the polymer electrolyte membrane, and depends greatly on the detailed condition of the experiments made at the time of fabrication.10
To date, several MEA manufacturing techniques have been developed, such as catalyst-coated membrane (CCM) and catalyst-coated gas diffusion layer or substrate (CCG or CCS) methods.11–15 More specifically, slurry, which contains catalyst nanoparticles and ionomer binder is applied directly onto the surface of a polymer electrolyte membrane using means such as spraying in the CCM. In the decal-transfer method, the catalyst slurry is first spread on a substrate using a doctor blade and then transferred to the membrane by hot pressing. This decal process is considered the most suitable method for mass production of MEAs,7,16 and it is clear that all commonly used catalyst layer preparation techniques use a catalyst slurry as a dispersion solution.17,18 It is therefore crucial to understand the properties of catalyst slurries to meet real-world requests for mass production and complete commercialization of fuel cell technology. For example, the total system active area of the MIRAI fuel cell electrical vehicle (FCEV) is 8.78 m2 and that of the SIEMENS FCM 34 modules, which are applied to air-independent propulsion (AIP) of submarines, is known to be 400 × 400 mm2.19,20 In most cases reported in the literature, however, the MEA active area is only about ∼5 cm2, so investigation of large-scale MEA are a necessary, as a slurry between science and technology.
For a large-scale MEA study, as mentioned earlier, studies of catalyst slurry with physical properties suitable for the decal transfer method should be performed. Therefore, various reports have been published on catalyst slurry study over a long period of time. Uchida et al.13 and Shin et al.15 mentioned that the dielectric constant (ε) of the solvent of the slurry determines the state of ionomer, and it plays an important role in the morphology and composition of the electrode, and affects fuel cell performance. The slurry solution can be in the form of solution (10 < ε), colloids (3 < ε < 10), or precipitates (ε < 3) depending on the value of the solvent dielectric constant. Shukla et al. reported the effect of dispersion media on the stability of carbon slurries for organic solvents, and they showed that Nafion is a strong stabilizing agent, increasing the slurry stability and decreasing the particle size of carbon aggregates.18 Furthermore, Fernandez et al. studied series of solvent parameters and they proposed that the deposition of the slurry requires a compromise between the dielectric constant and physical properties like viscosity and boiling point of the solvent.21 Huang et al. concluded that the particles in slurry with a high viscosity are more stable than in slurry with low viscosity.22
Research has focused mainly on Pt/C catalyst-based slurry; however, few studies on PtRu/C-based slurry have been found in the literature. As the hydrogen (H2) gas reformed from fossil fuels contains traces of impurities and carbon monoxide (CO), which causes CO poisoning, there are limitations to applying this directly to PEMFCs, which require high purity H2. The CO molecule blocks the Pt surface because it binds much more tightly to the Pt surface than the H atom, and thereby the activity of the anode catalyst decreases. Thus, the development of an anode catalyst with CO tolerance is considered to be an important subject. In particular, the Pt–Ru system has come to occupy an excellent position in anode electrocatalysts, since it exhibits enhanced CO tolerance, which can be attributed to a bifunctional mechanism.23–26 Moreover the PtRu/C catalyst is currently the most active anode catalyst for direct methanol fuel cells (DMFCs). Therefore, it would be of great interest to investigate an appropriate PtRu/C-based slurry recipe.
In this study, catalyst slurry suitable for a decal process was prepared by investigation of solvents appropriate for PtRu/C electrocatalysts. Furthermore, the fabrication of large-area MEAs using the decal transfer method with the PtRu/C catalyst slurry was explored and excellent performance under reformed H2 gas were realized.
Results and discussion
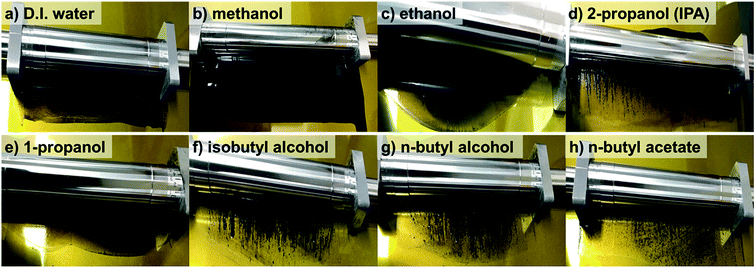
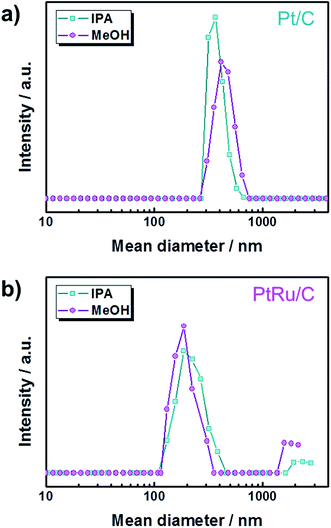
Fig. 1 shows that the schematic diagram of the fabrication process of a decal transfer method based-MEA. It is important to use stable slurrys when using deposition methods such as large area decal transfer. Furthermore, the slurry stability referred to herein can be defined as the ability to remain dispersed in the solvent.27 In order to keeping the aggregate size as small as possible, a suitable solvent needs to be selected, in particular, the dielectric constant (ε) and solubility (δ) of the solvent are important parameters. Most catalyst slurrys consist of catalyst nanoparticles, ionomer, solvent, and water in appropriate proportions, respectively. Their physical characteristics are dependent on the solvent, which is the largest constituent. Table 1 shows the physical characteristics of the various organic solvents we used,28 and Fig. 2 shows the spreading condition of PtRu/C catalyst slurry on polyimide (Kapton®) film surface by doctor blade. As can be seen from Fig. 2b, PtRu/C slurry dispersed in methanol (MeOH) showed the best coatability, but other solvents were agglomerated and clumped on the surface of the substrate Kapton® film; therefore, it was impossible to apply a thin film-like electrode layer. To understand these phenomena and investigate their causes, Pt/C catalyst and isopropyl alcohol (IPA) and MeOH solvents were further analyzed as MeOH showed the best properties as a solvent in the coating process by doctor blade, and IPA has been reported to be an excellent solvent for Pt/C in previous literature29,30 and is the most widely used in field. From Fig. 3, we can see that the particle size distribution of catalyst agglomerates for the catalyst slurry with different solvents, such as MeOH and IPA, from dynamic light scattering (DLS) results. The average diameter of the Pt/C–ionomer agglomerates in the MeOH-based slurry was found to be 490.6 nm, while it was found to be slightly smaller in the IPA-based slurry at 476.0 nm. However, the PtRu/C catalyst showed better dispersibility in the MeOH-based slurry than in the IPA-based slurry, and a much smaller aggregate mean diameter. The mean diameter of the PtRu/C catalyst–ionomer agglomerates was found to be 225.7 nm in the MeOH-based slurry and a further increase of 235.6 nm in the IPA-based slurry. As we have seen, the agglomerate size of the catalyst slurry varied depending on the solvent and the type of catalyst because the following parameters are different: ionomer solubility, dielectric constant, catalyst particle surface physical properties, and the aspect of ionomer adsorption on particle surface. The detailed experimental conditions at the time of measurement are different, so the measured values in this study may be different from the previously reported values.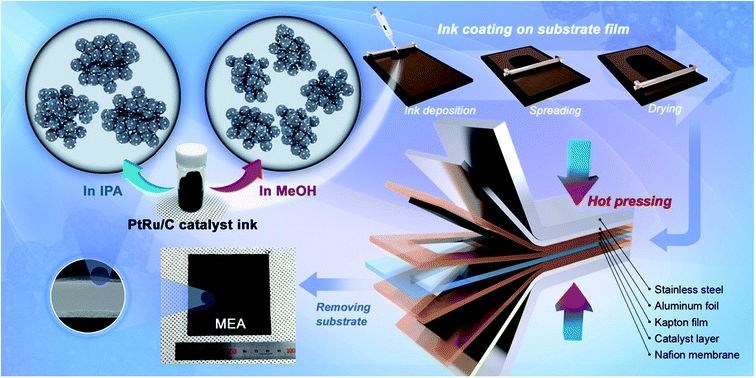 | ||
| Fig. 1 Schematic diagram of the ionomer–PtRu/C agglomerate dispersion in catalyst slurry solution and the MEA fabrication process using decal transfer method. | ||
| Solvent | Boiling point (°C) | Dielectric constanta (ε/no unit) | Vapor pressurea (kPa) | Viscosityb (cP) | PtRu/C slurry spreading quality |
|---|---|---|---|---|---|
| a Measurements at 20 °C.b Measurements at 25 °C. | |||||
| D.I. water | 100.0 | 88.1 | 2.34 | 1.00 | Agglomerate |
| Methanol | 64.7 | 33.0 | 13.02 | 0.54 | Smooth surface |
| Ethanol | 78.5 | 24.6 | 5.95 | 1.07 | Agglutination |
| 2-Propanol (IPA) | 82.0 | 20.2 | 4.44 | 2.04 | Lump |
| 1-Propanol | 97.2 | 2.2 | 1.99 | 1.96 | Agglutination |
| Isobutyl alcohol | 107.9 | 18.1 | 1.20 | 3.33 | Lump |
| n-Butyl alcohol | 117.7 | 17.8 | 0.80 | 2.57 | Lump |
| n-Butyl acetate | 126.1 | 5.1 | 1.66 | 0.74 | Flocculation |
First of all, as mentioned above, the ionomer solubility greatly affects the aggregate size. The Nafion ionomer solubility parameters of MeOH was 14.5 cal0.5 cm−1.5 and 11.8 cal0.5 cm−1.5 for IPA.30,31 Better solubility could contribute to the reduction in the interfacial energy at the Pt/C and/or PtRu/C surfaces, improvement in ionomer dispersivity in the solvent, and increase in electrostatic repulsive interaction among dense sulfonic acid groups of ionomer side-chains. These factors could lead to improved slurry stability of MeOH-based slurry than of IPA.
In addition, there is strong affinity of backbones to the carbon support surface, as both are highly hydrophobic. This means the interfacial energy between the carbon support and solvent is high in the presence of water in a solvent. The interfacial energy could be reduced by the adsorption of ionomer on the surface of the carbon support surface with formation of the film-like structure with backbones attached to the carbon support and sulfonic acid groups existing at the surface of the film.32 The ionomer was primarily adsorbed on Pt/C following a Langmuir isotherm at low concentration, and the amount of adsorbed ionomer was dominated by the chemical properties of the Pt/C surface. However, the surface oxidation state or susceptibility of PtRu/C can be distinguished from Pt/C owing to the difference in intrinsic physical properties, such as thermodynamic stability and atomic structure (fcc for Pt, hcp for Ru). It is well known that OH functional groups are selectively adsorbed on a surface site of Ru, owing to its thermodynamic stability.33 For these reasons, Nafion ionomer has a stronger affinity for the PtRu/C surface than for the Pt/C surface, which might be due to a favorable adsorption on hydrophilic ruthenium sites with chemisorbed OH groups.34 Likewise, the different interface energies between catalyst particle surface and solvent can result in different aggregate sizes.
Moreover, it has been reported that coarse-grained models of catalyst-layer slurries have demonstrated that, as the dielectric constant of the solvent increases, the agglomerate size decreases within an slurry owing to decreases in the ionomer cluster size,35 although there are some controversies. It was seen that with increasing dielectric constant of the solvent, the dependence of interaction energy on surface potential increases. This is because a higher value of interaction energy prevented aggregation of particles.18 Therefore, the size of the catalyst/ionomer agglomerate dispersed in MeOH is smaller than that dispersed in IPA, and the stability of the MeOH-based slurry is improved. At the same time, the hydrophobic backbones generally tend to be aggregated in solvents with high surface tension to minimize the interfacial energy by reducing the contact surface area with the solvent. The surface tension of IPA (23.0 mN m−1 at 293 K) is slightly higher than that of MeOH (22.6 mN m−1 at 293 K).32 The backbone can be dispersed more in the solvent at lower surface tension that at high surface tension.
As a matter of course, electrostatic interaction has been used usually to investigate the stability of dispersions, and the surface potential governs the electrostatic interaction potential. Thus, the zeta potential obtained from the electrophoretic mobility is traditionally applied to characterize the influence of the electrostatic interaction.36 Table 2 lists the zeta potential (ζ, mV) of catalyst particles dispersed in IPA and MeOH. In general, the larger the absolute value of the zeta potential, the better stable dispersion. Therefore, the zeta potential of the MeOH-based slurry was expected to be higher than that of the IPA-based slurry. Contrary to expectation, the zeta potential of the IPA-based dispersion was slightly higher (−50.35 mV) than that of the MeOH-based dispersion (−42.88 mV), which indicates that the Pt/C and PtRu/C should be more stably dispersed when dispersed in IPA than in MeOH. However, most of the dispersions with potentials higher than ±30 mV are believed to be stable, and the zeta potential from the experimentally measured electrophoretic mobility is only valid for hard spheres. Furthermore, the zeta potential of Nafion strongly depends on the concentration of the ionomer dispersions,37 and it is not considered an important factor for determining slurry stability in the case of non-aqueous solvents.38 Moreover advanced formulations such as nano-dispersions, have focused more on steric and entropic stabilization as well as on surface functionalization.39 For that reason, it is unreasonable to evaluate the stability of the slurry dispersion on the basis of the zeta potential only.
| Catalyst | Pt/C | PtRu/C | |||
|---|---|---|---|---|---|
| Solvent | IPA | Methanol | IPA | Methanol | |
| Zeta potential (ζ/mV) | 1 | −67.74 | −42.83 | −48.63 | −45.26 |
| 2 | −69.99 | −56.19 | −55.11 | −45.78 | |
| 3 | −58.69 | −38.44 | −49.71 | −40.77 | |
| 4 | −39.48 | −48.45 | −47.94 | −39.72 | |
| Average | −58.98 | −46.48 | −50.35 | −42.88 | |
| Contact angle on Kapton® film | — | — | 40.2° | 33.0° | |
Furthermore, in addition to slurry stability, catalyst layer slurry should also be easy to apply on a substrate, and cracks should not occur after drying. Such paintability, adhesion, and wettability are governed by viscosity, evaporation rate, surface tension, and the friction coefficient of substrate. During the slurry coating process, the control of the slurry flow on the film is a significant factor that determines the uniformity of the catalyst layer. Catalyst slurries prepared from solvents with viscosities that are too low can flow freely over the film, but solvents with very high viscosity caused poor distribution of the catalyst slurry on the film. Furthermore, besides the viscosity, the boiling point of the solvent may influence the flowability of the slurry and its surface coating quality.29 In order to compare the coatability of MeOH- and IPA-based PtRu/C catalyst slurrys, the contact angle of a catalyst slurry drop on a Kapton® film substrate was investigated.
In this study, a polyimide Kapton® film was selected as the substrate owing to its high thermal stability and good mechanical properties; furthermore, it has been reported that Kapton® can prevent Nafion skin layer formation when used as a decal substrate.40 The contact angle was 40.2° for the IPA-based slurry drop and 33.0° for the MeOH-based slurry drop (Fig. S1†). Although there is no noticeable dramatic difference, the slightly smaller contact angle of the MeOH-based catalyst slurry means that the affinity with the substrate is better. As the polarity of MeOH molecule is larger than that of IPA, wettability can be better on the surface of the Kapton® film; this is because the substrate surface is relatively hydrophilic. Thus, we can conclude that MeOH should be used as a solvent in order to fabricate catalyst slurries suitable for decal processes using PtRu/C electrocatalyst.
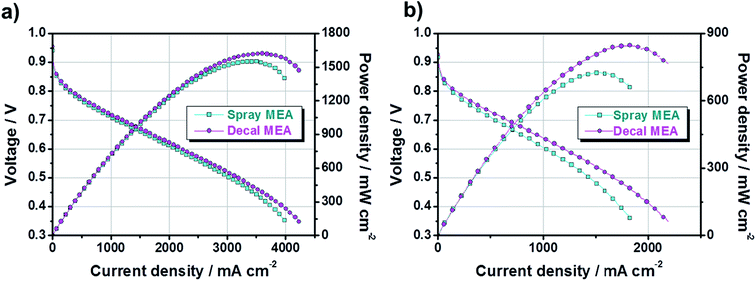
Next, to study the electrochemical properties of large-area MEAs using the decal transfer method with a PtRu/C electrocatalyst, several pre-experiments were done for the optimization of MEA fabrication condition, in advance, because the experimental specifics we used were based on Pt/C catalysts. First, it was confirmed that there was no critical performance difference between the MEAs obtained by applying Pt/C and PtRu/C electrocatalysts to the anode (Fig. S2†) via decal transfer methods when the same experimental condition Pt/C catalysts were used; the experimental conditions included ionomer ratio, slurry composition recipe, hot pressing procedure, inlet gas stoichiometry, activation procedure and so on. The two MEAs used different anode catalysts, but showed almost similar performances because the performance is completely dependent on the cathode catalyst, for the PEMFC fueled with hydrogen and oxygen, since the sluggish ORR on the cathode side, not anode. The current density at 0.6 V under O2 was 1741 mA cm−2 and the maximum power density was 1202 mW cm−2 for Pt/C-based MEA; as well as the corresponding value was 1722, mA cm−2 and 1224 mW cm−2 with PtRu/C-based MEA. Then, we fabricated two different MEAs using decal transfer and a direct spraying method with the MeOH-based PtRu/C catalyst slurry, and compared the performance characteristics. Fig. 4 indicates the polarization curves and power densities of two different MEAs; fabricated with a decal transfer method using the Kapton® film substrate (denote hereafter as decal MEA) and direct-spraying on the polymer electrolyte membrane (denote hereafter as spray MEA).
From Fig. 4, both the current density at 0.6 V (mA cm−2) and maximum power density (mW cm−2) of the decal MEA were slightly higher than those of the spray MEA. Under an H2/O2 operating condition, the current density of the decal MEA was approximately 2228 mA cm−2 at 0.6 V and the maximum power density was 1622 mW cm−2, whereas the corresponding values for the spray MEA were approximately 2016 mA cm−2 and 1551 mW cm−2, respectively. Although the performance was a little improved, there was a difference in the degree of performance difference between the oxygen condition (Fig. 4a) and air condition (Fig. 4b). The reason for this is as follows: the air electrode is affected to a greater extent by the mass transfer than the oxygen electrode.7
However, it is well known that the spray technique produces a higher MEA performance than the decal transfer process, because it provides a better ionic connection between the membrane and the ionomer in the catalyst layer.41 Contrary to these reports, the single-cell performance of decal MEA was relatively higher than that of spray MEA in this study. In order to explain this contradiction and find the reason for differences in performance, the fundamental principle of polarization curves need to be understood. Generally, fuel cell polarization curves are divided into three categories: activation, ohmic, and mass transfer losses. At low current density region, the cell voltage is dominated by the electrochemical kinetics of the cathodic oxygen reduction reaction. The cell voltage is further decreased by increasing the current load, caused by the electric resistance of the fuel cell. Furthermore, the mass transfer loss occurs over the overall current density range, but it becomes noticeable in the high current density region.
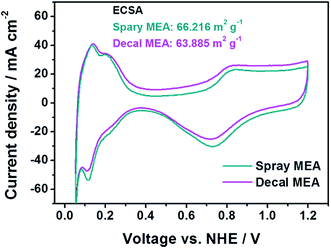
In Fig. 4, in the low current density region, there is no significant difference for the single-cell performance of each MEA due to varying the fabrication method. This indicates that the kinetic polarizations of the catalyst layer are almost identical. This corresponds to the small differences in the electrochemically active surface area (ECSA), which is calculated from the hydrogen adsorption/desorption reactions in accordance with catalytic capacity area from cyclic voltammetry (CV), as in Fig. 5. The ECSAs of spray MEA and decal MEA were 66.216 m2 g−1 and 63.885 m2 g−1, respectively. Therefore, we can infer that the measured power performances are mostly attributed to the differences in the proton or mass transport limitations of the electrode. As with this prediction, an almost difference in the performance of each electrode was observed in the high current density region. As the polymer electrolyte was identical for both electrodes, only resistances in the catalyst layer and contact resistance with polymer electrolyte could differ with fabrication method.
Various reports have mentioned that the pore structures of catalyst layers have an impact on cell performance as the catalyst layers are regions where electrochemical reactions occur. For that reason, the structures of catalyst layers will be discussed on the basis of the FE-SEM data. Fig. 6 shows that the FE-SEM images of the anode catalyst layer surface and cross-section of each MEA. The low magnification surface image (Fig. 6a and d) shows that the surface of the catalyst layer of the spray MEA is rougher than that of the decal MEA. This is because the decal MEA undergoes hot pressing during the manufacturing process, resulting in a more even surface. From the image of the cross section of the catalyst layer image (Fig. 6c and f), it can be seen that the thickness of the catalyst layer of decal MEA is thinned. The electrode thickness of the spray MEA was 5.5 μm for the anode and 9.2 μm for the cathode, and the decal MEA was reduced by about 22% to 4.2 μm and 7.4 μm, respectively. The hot pressing process results in a thinner catalyst layer as well, ensuring interfacial contact between the two electrodes and the membrane. However, in spite of this advantage, mass transport can be limited because of the decreased porosity of the electrodes.17 However, in the high magnification image (Fig. 6b and e), the two samples show no noteworthy difference in pore structure. From these observations, it can be proposed that although the thickness of the electrode was reduced, the secondary pores were not blocked, which was due to the space between catalyst agglomerates that play an important role in mass transfer. The MEA performance is the main evidence supporting the idea that preservation of secondary pores occurs. In fact, it is one of the most important attributes for finding the optimal hot pressing pressure and temperature conditions, in which the pore structure is preserved and delamination of the electrode and the membrane does not occur. In this study, various pre-experiments were conducted to determine the appropriate temperature and pressure, and the optimal values obtained were used. In addition, in terms of durability, decal MEA and spray MEA in this study both use the same electrolyte membrane, thus degradation or durability of MEA is affected by electrode deterioration rather than degradation of electrolyte membrane. Since the microstructure of the two MEAs is similar as shown in Fig. 6b and e, it can be expected that no significant difference will be observed in the MEA stability comparison.
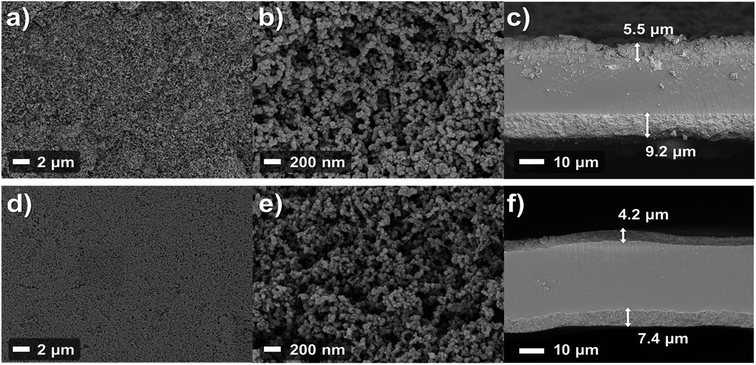 | ||
| Fig. 6 FE-SEM images of the anode surface (a and b) and cross-section (c) of spray fabrication method MEA; and corresponding images of decal MEA (d, e, and f). | ||
As a matter of course, in situ EIS of decal MEA and spray MEA was performed at 0.4 V, 0.6 V, and 0.8 V to further understand the different electrode kinetics (Fig. 7). The high frequency intercepts, which represent the ohmic resistances (RΩ, electrical contact resistance and proton conducting membrane resistance), were higher for decal MEA higher than for spray MEA in all voltage ranges. These differences increased as the cell voltage decreased. Though all the single cell components and the experimental conditions were the same, except for the catalyst layer fabrication method, the RΩ values between the two MEAs are different. These results are rationalized as follows: a sintering of the catalyst nanoparticles and the formation of Pt oxides could be occurring during the hot pressing process, in case of decal MEA. Furthermore, it has been reported42 that ionomer segregation such as a skin-like structure is likely to occur on the outside of the catalyst layer during the decal transfer processing. On the other hand, in the case of electron transfer resistance (Rct), its tendency was different compared to RΩ; the Rct value of the decal MEA was smaller than that of the spray MEA. Generally, Rct impeded the oxygen electro-reduction reaction from occurring at the interface of the catalyst and ionomer. Hence, Rct is not only related to the effective area of the three-phase interface but also reflects the mass transfer resistance. The Rct of both decal MEA and spray MEA decreased as the cell voltage decreased from 0.8 to 0.6 V, then increased as the cell voltage decreased further from 0.6 to 0.4 V. The increase in Rct in the low cell voltage region was due to the diffusion resistance adjacent to the catalyst surface or the flooding of micro- or macropores inside the agglomerate.7 As mentioned above, in the hot pressing process, the decal MEA decreased the thickness of the catalyst layer, but the secondary pore, which had a significant effect on the mass transfer, was maintained. In addition, it is possible to further increase the three-dimensional connection of the ionomer, which enhances proton transport and the development of a more connected secondary pore structure during the compression process. Thus, it can be seen that the total Rct of the spray MEA, which has a thicker catalyst layer, that is, longer proton transferring pathway and higher possibility of disconnection, is larger.
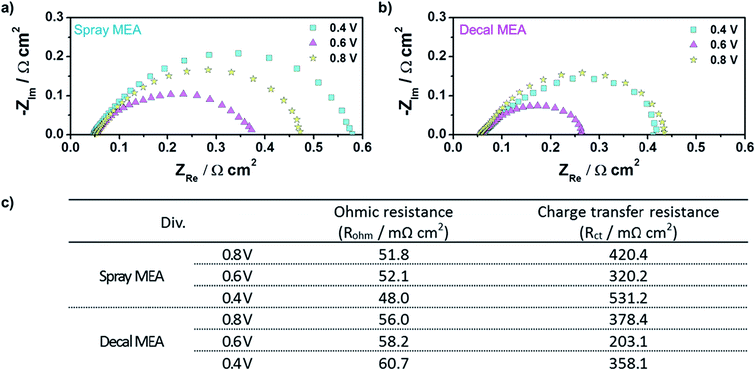 | ||
| Fig. 7 In situ EISs of (a) spray MEA and (b) decal MEA; (c) the ohmic and charge transfer resistances of the cell using a spray and decal MEA from EIS results. | ||
The Nyquist plots in Fig. 7 also reveal the limit of the thin film type catalyst layer in mass transfer; the angle between the real axis and the Nyquist plot is 45° while if only agglomerate diffusion is present, this angle should be 90°.43 These EISs results support the lower performance of spray MEA as compared with that of decal MEA in the polarization curve (Fig. 5).
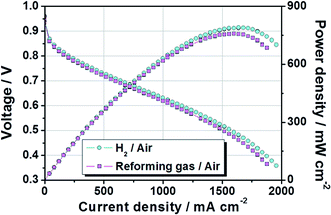
Based on previous studies, MEA having a large area was fabricated by a decal transfer method using MeOH-based PtRu/C catalyst slurry while maintaining high performance. Fig. 8 show that polarization and power density curves of PtRu/C-based MEA, whose active cell area was 51.84 cm2. The test was performed at 65 °C and fully humidified 99.999% H2 (cyan circle) and reforming H2 gas (magenta square) were used in the MEA under atmospheric pressure. The stoichiometry of H2![[thin space (1/6-em)]](https://www.rsc.org/images/entities/char_2009.gif) :
:![[thin space (1/6-em)]](https://www.rsc.org/images/entities/char_2009.gif) air was adjusted to 1.0
air was adjusted to 1.0![[thin space (1/6-em)]](https://www.rsc.org/images/entities/char_2009.gif) :
:![[thin space (1/6-em)]](https://www.rsc.org/images/entities/char_2009.gif) 2.0 for pure hydrogen gas and 1.33
2.0 for pure hydrogen gas and 1.33![[thin space (1/6-em)]](https://www.rsc.org/images/entities/char_2009.gif) :
:![[thin space (1/6-em)]](https://www.rsc.org/images/entities/char_2009.gif) 2.0 for reformed hydrogen gas, so that the same proportion of hydrogen flowed into the test equipment. It is well documented44 that CO can be adsorbed strongly onto Pt surface because of its strong adsorbing power, resulting in a decrease in surface active sites available for hydrogen adsorption and oxidation. PtRu/C portrays cutting-edge materials for anode electrocatalyst operating under reformed H2 gas. Such high reformate tolerance of PtRu/C catalyst is generally ascribed to two factors: the electronic and bifunctional mechanisms. According to electronic effects, at first, the Pt electronic structure were modifies by the added Ru atoms and the Pt–CO bond is weakened accelerating the CO oxidation by nearby OH groups, or it is possible that the CO molecules to be directly oxidized on the Pt sites via improved Pt–H2O activation. These electronic structure modifications of Pt are associated with the electron donation or back-donation of the d–d or d–π* orbital between Pt atom and the added element atom. Such modifications decrease the impurities coverage allows to remain more vacant Pt sites for hydrogen oxidation. Second, in a case of the bifunctional mechanism, the formation of OH groups on oxophilic sites of the Ru atom surface enhance the electro-oxidation of CO, and the spillover process of CO molecules to the vicinity of the sites occupied by OH adsorbates species and CO is oxidized to CO2, as follow equations:
2.0 for reformed hydrogen gas, so that the same proportion of hydrogen flowed into the test equipment. It is well documented44 that CO can be adsorbed strongly onto Pt surface because of its strong adsorbing power, resulting in a decrease in surface active sites available for hydrogen adsorption and oxidation. PtRu/C portrays cutting-edge materials for anode electrocatalyst operating under reformed H2 gas. Such high reformate tolerance of PtRu/C catalyst is generally ascribed to two factors: the electronic and bifunctional mechanisms. According to electronic effects, at first, the Pt electronic structure were modifies by the added Ru atoms and the Pt–CO bond is weakened accelerating the CO oxidation by nearby OH groups, or it is possible that the CO molecules to be directly oxidized on the Pt sites via improved Pt–H2O activation. These electronic structure modifications of Pt are associated with the electron donation or back-donation of the d–d or d–π* orbital between Pt atom and the added element atom. Such modifications decrease the impurities coverage allows to remain more vacant Pt sites for hydrogen oxidation. Second, in a case of the bifunctional mechanism, the formation of OH groups on oxophilic sites of the Ru atom surface enhance the electro-oxidation of CO, and the spillover process of CO molecules to the vicinity of the sites occupied by OH adsorbates species and CO is oxidized to CO2, as follow equations:
| (i) Ru + H2O → Ru − OH + e− + H+ |
| (ii) Ru − OH + Pt − CO → Pt + Ru + CO2 + e− + H+ |
Furthermore, other factors (composition, shape, size and structure) of the catalyst particles govern the interactions produced between the reactants (H2O, CO and H2) and the catalyst, and determine the activity of the catalyst particles.45 Also, as mentioned before, it is well known that the CO poisoning effect was strongly related to the concentration of CO, the exposure time to CO, the cell operation temperature, and anode catalyst types.23–26 The reformed gas used in this study, consisted of H2 74.98%, CO2 20.15%, CH4 1.48%, and N2 3.39%. It also contained a trace amount of CO generated during the reforming process. Despite the use of this reforming gas, no significant performance degradation was observed owing to the PtRu/C catalyst applied to the anode, as shown in Fig. 8. The current densities at 0.6 V were 1159 mA cm−2 when ordinary H2 gas was used and 1079 mA cm−2 when reforming H2 gas was used, respectively. Their corresponding power densities at 0.6 V were 695 mW cm−2 and 649 mW cm−2. The maximum power densities for the ordinary H2 gas and reforming H2 gas were 790 mW cm−2 and 758 mW cm−2, respectively. In conclusion, these findings demonstrated that it is feasible to fabricate large-area MEAs with an active area of 51.84 cm2 by MeOH-based PtRu/C catalyst slurry.
Conclusions
In this study, it has been proved that large-area MEA can be produced by using a decal transfer method with MeOH-based PtRu/C catalyst slurry. It is important to use stable slurrys when using deposition methods such as the large- scale or area decal transfer technique. Previous studies on the production of MEA with the decal transfer process have focused on using Pt/C catalysts; however, the present study has investigated a method suitable for the PtRu/C catalyst, which has the advantage of being CO resistant and allows for the use of reformed gas. First, to select a suitable solvent for the PtRu/C catalyst for stable catalyst slurry, we have considered the physical properties of organic solvents, including ionomer solubility, dielectric constant, catalyst particle surface physical properties, and the aspect of ionomer adsorption on a particle surface. The MeOH-based PtRu/C slurry dispersion showed the best stability. It was also confirmed that the MeOH-based catalyst slurry has the most suitable characteristics for coating the slurry on the substrate film. The decal technique MEA using this slurry showed excellent performance when compared with the spray MEA. Furthermore, a large-area MEA with an active area of 51.84 cm2 was fabricated, and its performance was realized by using reformed hydrogen gas, as in the case of using high purity hydrogen. These results will be meaningful for the complete commercialization and price competitiveness of the PEMFC technique, and the development of the hydrogen economy.Experimental
Preparation of the electrocatalysts slurry
Commercially available solvents and reagents were used without additional purification, unless otherwise stated. The catalysts used in this experiment were as follows: 40 wt% Pt/C (Johnson Matthey Co. JM), 46.4 wt% Pt/C (TEC10E50E; Tanaka Kikinzoku Kogyo Ltd. TKK), and 53.5 wt% PtRu/C (TEC61E54; Tanaka Kikinzoku Kougyo, Ltd. TKK). The electrocatalyst was dispersed in various organic solvents (methanol, ethanol, 2-propanol, 1-propanol, isobutyl alcohol, n-butyl alcohol, n-butyl acetate) and then deionized water and perfluorosulfonic acid ionomer (Aldrich, 5 wt% Nafion ionomer) were added to the mixture. Then, ultra-sonication was performed for 15 min to complete dispersion of the catalyst slurry. A Pt/C catalyst was used as the cathode and a PtRu/C catalyst was used as the anode. All of the preparation processes of the electrocatalysts slurry were carried out at room temperature.Fabrication of MEA
A Nafion 211 membrane (DuPont) was used as the ion-conducting membrane, and was immersed in a 2.5% H2O2 solution at 80 °C for 1 h, and then rinsed in boiling deionized water for 1 h for purification. The membrane was then boiled in a 0.5 M H2SO4 solution for 1 h and rinsed in deionized water for protonation. Polyimide films (Kapton® film, Dupont) were chosen as decal substrates. The substrates were washed with deionized water and ethanol. The geometric area of electrodes was 5.00 cm2 for the pre-test and 51.84 cm2 for the main test. The prepared slurry was coated on a substrate film with the doctor blade method using a knife coating device (KP-3000V, KIPAE. Co) and baker applicator (YBA-5, Yoshimitsu Co.). The blade heights were controlled at approximately 100 μm and the blade speed was kept at about 3.0 mm s−1 for both cathode and anode. After blading, the substrates with the electrodes were placed in a hood and dried overnight at 25 °C. The anode and cathode electrodes transferred to each side of a Nafion 211 membrane via hot-pressing, which was carried out using a plate-press machine under an applied pressure of 0.1 MPa at a temperature of 120 °C for 5 min for 5 cm2 MEA; 0.7 MPa at a temperature of 130 °C for 15 min for 51.84 cm2. JNTG-A3 carbon paper was used as a gas diffusion layer (GDL), and it was placed on each electrode side of the CCMs. The prepared MEA were inserted into a single cell unit having a graphite plate with a serpentine gas flow path. The unit cell unit was assembled with eight screws and an 8 Nm tightening torque.Morphological characterization
The morphology, surface, cross-section and thickness of MEAs were identified by field emission scanning electron microscopy (FE-SEM, MERLIN Compact, ZEISS) images. The particle size distribution in the catalyst slurrys was measured by a dynamic light scattering (DLS) spectrophotometer (Type DLS-7000, Otsuka Electronics, Osaka); furthermore, the zeta potential (ELS-Z Photal, OTSUKE ELECTRONICS) confirmed the degree of dispersion of the prepared catalyst slurry of the Pt/C, PtRu/C at room temperature conditions. The contact angles of a PtRu/C catalyst (in IPA and methanol) slurry drop on the substrate Kapton film were measured by a contact angle analyzer (Phoenix 300 Touch).Electrochemical characterization
Activation and polarization tests of the assembled single cells were performed using the current-sweep-hold method with a PEMFC test system (CNL Energy). During the activation, the current was maintained for 10 min when the current density reached 0.5, 1.0, 1.5, 2.0, 2.5, 3, and 4 A cm−2 with a current-sweep rate of 10 mA cm−2 s−1, and the current was reset to 0 when the cell potential reached 0.35 V. Furthermore, polarization curves (Fig. 4, 8 and S2†) were obtained using the current-sweep method. The cell temperature was maintained at 70 °C during activation and at room temperature during the polarization test. The test was conducted using relative humidity (RH) 100% H2/O2 (or air), which was supplied to the anode and cathode. In the case of the large-scale 51.84 cm2 of MEA, the reforming gas was injected into the anode to confirm the performance difference with the pure H2 gas. The composition ratios of the reforming gases used in this experiment are as follows: 74.98% of H2, 20.15% of CO2, 1.48% of CH4, and 3.39% of N2. After the polarization test, CV was used to determine the ECSA with a scan rate of 100 mV s−1 in the range for 0.05 V to 1.20 V in a humidified H2 and N2 (99.999%) atmosphere, with a potentiostat/galvanostat (IM-6, ZAHNER). Before the CV test, the single cell was purged with humidified N2 gas on both cell sides at least for 12 h to remove reactant gases. Electrochemical impedance spectroscopy (EIS, IM-6 ZAHNER-ELEKTRIK GMBH & Co. KG, Germany) was measured while H2 and air were fed to the anode and cathode. The cell voltage of the EIS was 0.8, 0.6, and 0.4 V with amplitude of 5 mV to identify ohmic resistance, charge transfer resistance, and mass transfer resistance. The measured frequency range was 100 mHz to 100 kHz.Conflicts of interest
There are no conflicts to declare.Acknowledgements
This research was supported by Korea Electric Power Corporation. (Grant number: R18XA06-33) Y.-H. C. acknowledges financial support from the Basic Science Research Program (2016R1D1A3B03934752) through the National Research Foundation of Korea (NRF), which is funded by the Ministry of Education. This work was supported by a project (R16EA01) of Korea Electric Power Corporation (KEPCO). This research was also supported by Daewoo Shipbuilding & Marine Engineering Co., Ltd. (DSME).Notes and references
- M. Shao, Q. Chang, J.-P. Dodelet and R. Chenitz, Chem. Rev., 2016, 116, 3594–3657 CrossRef CAS PubMed.
- A. Rabis, P. Rodriguez and T. J. Schmidt, ACS Catal., 2012, 2, 864–890 CrossRef CAS.
- D. Banham and S. Ye, ACS Energy Lett., 2017, 2, 629–638 CrossRef CAS.
- H. T. Chung, D. A. Cullen, D. Higgins, B. T. Sneed, E. F. Holby, K. L. More and P. Zelenay, Science, 2017, 357, 479–484 CrossRef CAS PubMed.
- O.-H. Kim, Y.-H. Cho, D. Y. Chung, M. J. Kim, J. M. Yoo, J. E. Park, H. Choe and Y.-E. Sung, Sci. Rep., 2015, 5, 8376 CrossRef CAS PubMed.
- O.-H. Kim, Y.-H. Cho, S. H. Kang, H.-Y. Park, M. Kim, J. W. Lim, D. Y. Chung, M. J. Lee, H. Choe and Y.-E. Sung, Nat. Commun., 2013, 4, 2473 CrossRef PubMed.
- H.-S. Park, Y.-H. Cho, Y.-H. Cho, I.-S. Park, N. Jung, M. Ahn and Y.-E. Sung, J. Electrochem. Soc., 2008, 155, B455–B460 CrossRef CAS.
- R. Borup, J. Meyers, B. Pivovar, Y. S. Kim, R. Mukundan, N. Garland, D. Myers, M. Wilson, F. Garzon and D. Wood, Chem. Rev., 2007, 107, 3904–3951 CrossRef CAS PubMed.
- A. Dicks and D. A. J. Rand, in Fuel cell systems explained, John Wiley & Sons Ltd, West Sussex, 3rd edn, 2018 Search PubMed.
- O.-H. Kim, Y.-H. Cho, T.-Y. Jeon, J. W. Kim, Y.-H. Cho and Y.-E. Sung, ACS Appl. Mater. Interfaces, 2015, 7, 14053–14063 CrossRef CAS PubMed.
- T. Suzuki, S. Tsushima and S. Hirai, Int. J. Hydrogen Energy, 2011, 36, 12361–12369 CrossRef CAS.
- M. S. Wilson and S. Gottesfeld, J. Appl. Electrochem., 1992, 22, 1–7 CrossRef CAS.
- M. Uchida, Y. Fukuoka, Y. Sugawara, H. Ohara and A. Ohta, J. Electrochem. Soc., 1998, 145, 3708–3713 CrossRef CAS.
- M. S. Wilson, J. A. Valerio and S. Gottesfeld, Electrochim. Acta, 1995, 40, 355–363 CrossRef CAS.
- S.-J. Shin, J.-K. Lee, H.-Y. Ha, S.-A. Hong, H.-S. Chun and I.-H. Oh, J. Power Sources, 2002, 106, 146–152 CrossRef CAS.
- H. J. Cho, H. Jang, S. Lim, E. Cho, T.-H. Lim, I.-H. Oh, H.-J. Kim and J. H. Jang, Int. J. Hydrogen Energy, 2011, 36, 12465–12473 CrossRef CAS.
- C.-Y. Jung, W.-J. Kim and S.-C. Yi, Int. J. Hydrogen Energy, 2012, 37, 18446–18454 CrossRef CAS.
- S. Shukla, S. Bhattacharjee, A. Weber and M. Secanell, J. Electrochem. Soc., 2017, 164, F600–F609 CrossRef CAS.
- https://www.toyota-europe.com/, (accessed July 2018).
- https://www.industry.siemens.com/, (accessed July 2018).
- R. Fernandez, P. Ferreira-Aparicio and L. Daza, J. Power Sources, 2005, 151, 18–24 CrossRef CAS.
- D.-C. Huang, P.-J. Yu, F.-J. Liu, S.-L. Huang, K.-L. Hsueh, Y.-C. Chen, C.-H. Wu, W.-C. Chang and F.-H. Tsau, Int. J. Electrochem. Sci., 2011, 6, 2551–2565 CAS.
- Y. Ra, J. Lee, I. Kim, S. Bong and H. Kim, J. Power Sources, 2009, 187, 363–370 CrossRef CAS.
- J. Zhang and R. Datta, J. Electrochem. Soc., 2002, 149, A1423–A1431 CrossRef CAS.
- L. Ma, C. Liu, J. Liao, T. Lu, W. Xing and J. Zhang, Electrochim. Acta, 2009, 54, 7274–7279 CrossRef CAS.
- I. Kim, S. Bong, S. Woo, R. K. Mahajan and H. Kim, Int. J. Hydrogen Energy, 2011, 36, 1803–1812 CrossRef CAS.
- J. N. Israelachvili, in Intermolecular and Surface Forces, Academic Press, 2011 Search PubMed.
- J. Rumble, in CRC Handbook of Chemistry and Physics, 2017 Search PubMed.
- A. Therdthianwong, P. Ekdharmasuit and S. Therdthianwong, Energy Fuels, 2010, 24, 1191–1196 CrossRef CAS.
- T. T. Ngo, T. L. Yu and H.-L. Lin, J. Power Sources, 2013, 238, 1–10 CrossRef CAS.
- F. Alcaide, G. Álvarez, P. L. Cabot, R. Genova-Koleva, H.-J. Grande and O. Miguel, Electrochim. Acta, 2017, 231, 529–538 CrossRef CAS.
- T. Mashio, A. Ohma and T. Tokumasu, Electrochim. Acta, 2016, 202, 14–23 CrossRef CAS.
- T. Takeguchi, T. Yamanaka, K. Asakura, E. N. Muhamad, K. Uosaki and W. Ueda, J. Am. Chem. Soc., 2012, 134, 14508–14512 CrossRef CAS PubMed.
- S. Ma, Q. Chen, F. H. Jøgensen, P. C. Stein and E. M. Skou, Solid State Ionics, 2007, 178, 1568–1575 CrossRef CAS.
- K. Malek, M. Eikerling, Q. Wang, T. Navessin and Z. Liu, J. Phys. Chem. C, 2007, 111, 13627–13634 CrossRef CAS.
- S. Shukla, S. Bhattacharjee and M. Secanell, ECS Trans., 2013, 58, 1409–1428 CrossRef.
- H. Zhang, J. Pan, X. He and M. Pan, J. Appl. Polym. Sci., 2008, 107, 3306–3309 CrossRef CAS.
- D. Lerche and T. Sobisch, Colloids Surf., A, 2014, 440, 122–130 CrossRef CAS.
- T. F. Tadros, in Applied surfactants: principles and applications, John Wiley & Sons, 2006 Search PubMed.
- S. Shahgaldi, I. Alaefour, G. Unsworth and X. Li, Int. J. Hydrogen Energy, 2017, 42, 11813–11822 CrossRef CAS.
- M. Prasanna, H. Ha, E. Cho, S.-A. Hong and I.-H. Oh, J. Power Sources, 2004, 137, 1–8 CrossRef CAS.
- J. Xie, F. Garzon, T. Zawodzinski and W. Smith, J. Electrochem. Soc., 2004, 151, A1084–A1093 CrossRef CAS.
- T. Springer and I. Raistrick, J. Electrochem. Soc., 1989, 136, 1594–1603 CrossRef CAS.
- A. F. Ghenciu, Curr. Opin. Solid State Mater. Sci., 2002, 6, 389–399 CrossRef.
- S. M. M. Ehteshami and S. H. Chan, Electrochim. Acta, 2013, 93, 334–345 CrossRef CAS.
Footnotes |
| † Electronic supplementary information (ESI) available. See DOI: 10.1039/c8ra07754a |
| ‡ These authors contributed equally to this work. |
| This journal is © The Royal Society of Chemistry 2018 |

