
 Open Access Article
 This Open Access Article is licensed under a Creative Commons Attribution-Non Commercial 3.0 Unported Licence
Adsorption of ng L−1-level arsenic by ZIF-8 nanoparticles: application to the monitoring of environmental water†
Durga Parajuli *a,
Kiwamu Sueb,
Akira Takahashia,
Hisashi Tanakaa and
Tohru Kawamoto*a
*a,
Kiwamu Sueb,
Akira Takahashia,
Hisashi Tanakaa and
Tohru Kawamoto*a
aNanomaterials Research Institute, National Institute of Advanced Industrial Science and Technology (AIST), 1-1-1 Higashi, Tsukuba, 305-8565, Japan. E-mail: parajuli.durga@aist.go.jp; tohru.kawaoto@aist.go.jp
bResearch Institute for Chemical Process Technology, National Institute of Advanced Industrial Science and Technology (AIST), 1-1-1 Higashi, Tsukuba, 305-8565, Japan
First published on 25th October 2018
Abstract
The provisional contamination level of arsenic in drinking water is 10 μg L−1. For decreasing this value to a safer level, a more precise method for analyzing dissolved arsenic is required. With this aim, we synthesized zeolitic imidazolate framework-8 (ZIF-8) in the aqueous phase and characterized its potential application for monitoring the trace arsenic in fresh water. In this regard, we report following three notable outcomes. First, we demonstrate the excellent performance of ZIF-8 nanoparticles (nZIF-8) for the adsorption of ng L−1 levels of AsO43−. nZIF-8 is able to adsorb over 99% of arsenic from as low as 10 ng L−1 AsO43− solutions. This performance was maintained even in the presence of commonly coexisting anions, for example, >90% adsorption from a 0.1 μg L−1 arsenic solution was observed in the presence of 10 mg L−1 of Cl−, NO3−, CO32−, or SO42−, or 1 mg L−1 of PO43−. Second, we clarified that the mechanism of arsenic adsorption by ZIF-8 is simply a ligand exchange process, in which the As(V) oxide anion replaces the imidazolate unit in the framework. Third, we propose a handy scheme for the analysis of ng L−1 levels of arsenic in drinking water, in which nZIF-8 is used for the concentration of trace level AsO43−. By doing this, as low as 100 ng L−1 arsenate in drinking water can be quantified by colorimetric analysis, the detection limit of which is 5 μg L−1 in pure water. The application of this scheme is expected to highly enhance AsO43− detection first by concentrating it to an easily detectable range, and second by excluding the majority of interfering ions present in the system. Therefore, a reduction in the minimum quantifying limit of arsenic in fresh water to as low as 1 ng L−1 can be expected if the method is coupled with ICP-MS.
1 Introduction
Arsenic in drinking water has become widespread in recent decades.1–4 Owing to its toxicity in otherwise undetectable levels, the world health organization (WHO) has set a provisional limit of 10 μg L−1 in drinking water. This 10 μg L−1 limit is set based on the detection limit of on-site analytical methods such as colorimetry and on the lowest limit for conventional decontamination techniques.5 Concerning the determination by inductively coupled plasma-mass spectroscopy (ICP-MS) or graphite-furnace atomic absorption spectroscopy (AAS), for example, it is possible to detect <1 μg L−1 as long as the concentration of other elements remains below interference levels. However, such equipment is not available to all drinking water reservoirs. Moreover, since the concentration of any element in natural water is seldom fixed, periodic analysis is necessary. Under such circumstances, practical analytical methods are required to monitor the arsenic concentration in a given system at any time.A number of colorimetric methods are currently in use for the estimation of arsenic at the μg L−1 level.6 These are usually good tools for semi-quantitative estimation as the concentration of other elements is within the interference level. For example, many colorimetric methods targeted for μg L−1 levels cannot detect arsenic in seawater or sewage water. Under such conditions, ICP-MS or graphite-furnace AAS can be good options. However, the detection limit of these instruments is also in the sub-ppb range and difficult to replicate in solutions containing several other elements. The same issue is true for other high-precision methods such as anodic or cathodic stripping voltammetry.7–10
In particular, the evaluation of As(V) is crucial. In general, inorganic arsenic in natural water exists in protonated oxide forms: As(III) as H3AsO3, As(V) as H3AsO4, or both. Among these forms, As(V) forms anionic oxides in the wide pH range of 2–14. Assuming that the pH of natural water ranges between neutral to slightly acidic, the majority of As(V) exists as H2AsO4− or HAsO42−. As(III) is known to form neutral H3AsO3 up to pH 9, and gradual ionization to H2AsO3−, HAsO32−, and AsO33− takes place with the increasing pH.11 In this sense, the removal and analysis of As(V) are considered comparatively as important as those of As(III). For this reason, the quantitative estimation of total arsenic in water is carried out first by oxidizing the As(III) species.12
In recent years, zeolitic imidazolate framework 8 (ZIF-8, Zn(2-methylimidazole)2), a metal organic framework, has been reported to be able to uptake anionic arsenic oxide from water.13–19 Such studies focused on demonstrating the significantly higher adsorption capacity of ZIF-8 and its capability of lowering arsenic levels to <10 μg L−1. Regarding the removal of arsenic, several cost-effective adsorbents and methods such as electrocoagulation have been widely reported.20–32 Therefore, we have focused on the adsorption of arsenic at trace level from systems containing several other ions.
The mechanism of arsenic adsorption by ZIF-8 remains controversial, although some hypotheses have been proposed.14,17 Liu et al. proposed a mechanism involving Zn–N bond-cleavage and subsequent adsorption of arsenic oxide on Zn. They also reported that the reduction of the adsorption load during cycle adsorption–desorption tests was due to Zn leakage.14 Li et al. proposed another mechanism: the generation of a large amount of external active sites (Zn–OH) through the dissociative adsorption of water and subsequent formation of an inner-sphere complex.17
Considering the current status, we set ourselves three aims for this work: one was to identify the lowest arsenic concentration that can be detected. As described above, although the administrative level has been set to 10 μg L−1, a more accurate method for monitoring and decontamination is highly desirable. The second one was to clarify the arsenic adsorption mechanism by ZIF-8. Finally, we propose a new application where ZIF-8 is used for the pre-concentration of arsenic for determination at the 0.01 μg L−1 (=10 ng L−1) level.
Concerning the analysis of arsenic by ICP-MS or colorimetry, interference by coexisting ions remains the main issue. Therefore, high-selectivity materials that are effective even at trace concentrations can not only lead to the enrichment of elements on the adsorbent but also help separate many of the interfering ions in the system from the target anal0yte. Therefore, adsorption on ZIF-8, followed by dissolution, may provide a solution providing enriched levels of arsenic and relatively negligible concentrations of most of the other elements present in the feed system (Fig. 1). This specific ability of ZIF-8, in combination with a colorimetric method, for example, has great potential for the monitoring of trace levels of arsenic in a wide variety of water systems, including drinking water and seawater. The final aim of this study was to reduce the measurable arsenic level from 10 μg L−1 to at least below 0.1 μg L−1, hence reducing the detection limit to 1/100 of the current provisional value.
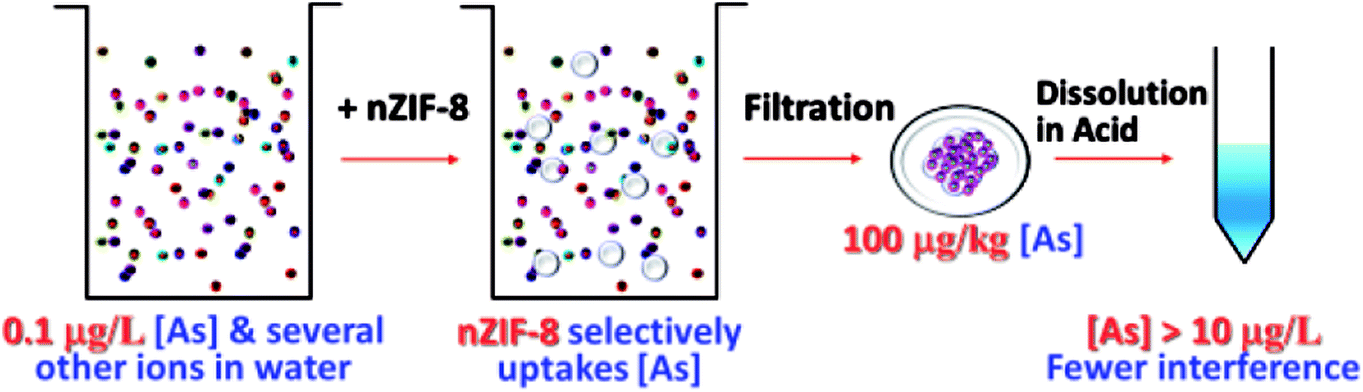 | ||
| Fig. 1 Schematic illustration of the monitoring method of trace arsenic by selective pre-concentration using ZIF-8. | ||
2 Experimental
2.1 Materials and instrumentation
2-Methyl imidazole (2Mim) and zinc nitrate (Wako Chemicals) were used for the aqueous synthesis of ZIF-8. Potassium dihydrogen arsenate (KH2AsO4) (Wako Chemicals) was used for the preparation of an AsO43− solution. All the reagents used were of analytical grade. Commercially available ZIF-8, Basolite Z1200, was purchased from Sigma Aldrich, Japan, denoted hereafter as bZIF-8. It was used without further treatment for the characterization of the arsenic adsorption from pure water solutions.The arsenic concentration was mainly analyzed using a Perkin Elmer NexION 300 inductively coupled plasma mass spectrometer. For the estimation of enriched arsenic by a colorimetric method, the MQuant™ 117927 arsenic test kit from Merck KGaA, Germany, was used, with a measurement range of 0.005 to 0.5 mg L−1. The concentration of potassium was analyzed using an Agilent4100 microwave plasma atomic emission spectrometer. A Beckman Coulter Delsa™ Nano instrument was used for zeta potential measurement. A Bruker D2 Phaser was used to obtain the XRD profiles. FT-IR spectra were recorded on a Thermo Scientific Nicolet iS5 spectrophotometer and SEM images were taken using a Hitachi High Technology S-4800 FE-SEM microscope. Thermogravimetric analysis was performed using a Rigaku Thermoplus Evo TG8120 instrument. The total organic carbon (TOC) and total nitrogen (TN) contents were analyzed using an Analytik Jena Multi N/C 3100 TOC/TN analyzer.
2.2 Synthesis of ZIF-8 nanoparticles (nZIF-8) in aqueous phase
The room temperature synthesis33 of nZIF-8 was carried out in the flow using a micromixing system, as shown in Fig. S1.† For this, 3.33 mol L−1 2Mim prepared in pure water was mixed in flow with a 0.05 mol L−1 zinc nitrate solution in pure water. The 2Mim solution rate was 6 mL min−1 while that of zinc nitrate was 2 mL min−1. The concentration difference and flow rate overall afforded a mixing ratio of 2Mim-to-zinc nitrate of 200![[thin space (1/6-em)]](https://www.rsc.org/images/entities/char_2009.gif) :1. T-shaped micromixer with a 0.5 mm internal diameter was connected to two inlets of the feed solutions and an outlet. The outlet was connected to a 3 m long microreactor with a 0.5 mm internal diameter and an additional 60 m long reactor with a 1.59 mm internal diameter. The residence times in these reactors were 4.4 s and 15 min, respectively. Finally, the mixture was collected in a beaker with continuous stirring (750 rpm) to obtain particles with a small size range. The nZIF-8 obtained in this way was collected by centrifugation at 14000 rpm for 1 h, followed by washing the residue with methanol. The ZIF-8 nanoparticles obtained after washing were denoted nZIF-8 and evaluated for their potential application in trace-level arsenic monitoring.
:1. T-shaped micromixer with a 0.5 mm internal diameter was connected to two inlets of the feed solutions and an outlet. The outlet was connected to a 3 m long microreactor with a 0.5 mm internal diameter and an additional 60 m long reactor with a 1.59 mm internal diameter. The residence times in these reactors were 4.4 s and 15 min, respectively. Finally, the mixture was collected in a beaker with continuous stirring (750 rpm) to obtain particles with a small size range. The nZIF-8 obtained in this way was collected by centrifugation at 14000 rpm for 1 h, followed by washing the residue with methanol. The ZIF-8 nanoparticles obtained after washing were denoted nZIF-8 and evaluated for their potential application in trace-level arsenic monitoring.
2.3 Characterization of ZIF-8
The composition of both ZIF-8 samples (nZIF-8 and bZIF-8) was determined by measuring the concentration of Zn, C, N, and the water content. The water content was estimated based on the TG-DTA profiles obtained in air at a 5 °C min−1 heating rate. The XRD profiles of the residues after total oxidation were recorded to identify the oxides formed. Elemental analysis was carried out to measure the total C and N contents incorporated in ZIF-8. The concentration of Zn and any other foreign element in the material was estimated by dissolving ZIF-8 in 1 mol L−1 nitric acid solution, followed by ICP-MS analysis. Based on the water content and total Zn, C, and N in the material, the compositions of nZIF-8 and bZIF-8 were determined.So as to compare the size of nZIF-8 prepared in the aqueous phase to that of the commercial sample, FE-SEM images and XRD profiles were obtained. In addition, since the current study aims at the adsorption of trace-level arsenic in water, the zeta potential of the materials was measured to evaluate their dispersion properties.
2.4 Adsorption of arsenate onto ZIF-8
Adsorption tests with AsO43− on nZIF-8 and bZIF-8 were carried out to compare the adsorption capacities of these materials and elucidate the mechanism of adsorption. For this, solutions of 0.1 to 100 mg L−1 AsO43− were prepared by dissolving KH2AsO4 in pure water. Each solution (20 mL) was added to 10 mg of the respective adsorbents and mixed at 600 rpm for 1 h at 25 °C unless stated otherwise. The mixture was separated by centrifugation for 10 min at 16000 rpm, followed by filtration through a 0.2 μm membrane filter (Millipore). The concentration of arsenic before and after adsorption was analyzed by ICP-MS using a calibration curve between 0.1 and 25 μg L−1 arsenic prepared in a 2% nitric acid solution.
Since the purpose of the current work is the demonstration of the potential application of ZIF-8 for monitoring trace-level arsenic in environmental water, the adsorption of 0.01–10 μg L−1 AsO43− on nZIF-8 was evaluated. In this case, the adsorbent-to-solution ratio was varied from 1000 to 2000 g mL−1. To determine the effect of coexisting anions, a 0.1 μg L−1 AsO43− solution was prepared with 1, 10, and 100 mg L−1 solutions of Cl−, CO32−, NO3−, SO42−, and PO43− from the respective potassium salts. Each solution (20 mL) was added to 10 mg of nZIF-8 and mixed at 600 rpm and 25 °C for 1 h. After separation using a 0.45 μm filter, the concentration of arsenic was analyzed by ICP-MS. Similarly, adsorption tests at 5, 15, 25, and 45 °C were carried out to identify any effect of the mixing temperature.
To clarify the potential application of nZIF-8 for arsenic monitoring in seawater, adsorption tests at 0.1, 1, and 10 mg L−1 AsO43− in simulated seawater were carried out. Since at least 100-fold dilution of seawater is necessary to avoid matrix effects, the starting arsenic concentration should be at least 0.1 mg L−1.
2.5 Monitoring trace levels of arsenate using nZIF-8
Monitoring experiments were carried out for the on-site determination of soluble arsenic. For this, 100 mg nZIF-8 was added to 1 L of 1, 0.1, and 0.01 μg L−1 AsO43− solutions. The mixtures were shaken at 130 rpm for 1 h at room temperature (22 °C). After filtration, the residue was recovered and dissolved in a 1 mol L−1 nitric acid solution to measure the enriched concentration. Based on the initial and final concentrations of the solution, and the concentration recovered in the residue, the mass balance was evaluated. In addition to the ICP-MS analysis, the enriched concentration range was estimated using a colorimetric method. In this case, however, since the interference limit of nitrate is quite low (<100 mg L−1), a mixture of hydrochloric acid and sulfuric acid was used to dissolve ZIF-8 while keeping the concentration of interfering ions within the measurable range.Simulated monitoring experiments were carried out by mixing 3 L of 0.1 μg L−1 of an AsO43− solution with 100 mg nZIF-8. After hand mixing for a minute, the mixture was left to stand for 1 h with occasional hand mixing. Then, nZIF-8 was recovered by suction filtration. For the colorimetric estimation of arsenic using MQuant™ 117927, 60 mL of the sample solution was used; interference due to foreign substances was found to be quite limiting (as shown in Table S1†). For this reason, the nZIF-8 residue after adsorption was dissolved in a mixture of 3 mL HCl and 1 mL H2SO4 (0.5 mol L−1 each). By doing so, nZIF-8 could be completely dissolved and the concentrations of Cl and SO42− could be maintained below 1000 mg L−1 (the interfering level).
In order for quantitatively estimate arsenic, UV-VIS measurement of the MQuant™ test stripes was carried out in reflection mode. A calibration curve from 0.005 to 0.15 mg L−1 of arsenic was constructed by plotting the concentration against the peak area of the absorbance between 420 and 800 nm (Fig. S3†). Then, the enriched arsenic level was estimated tentatively from the color of the test stripe. As such, nearly quantitative determination became possible using the calibration curve.
3 Results and discussion
3.1 Characterization of nZIF-8
The composition of nZIF-8 prepared in an aqueous system was evaluated in comparison with the commercial bZIF-8. The thermogravimetric analysis confirmed that both materials were nearly free of water (Fig. S2†). The weight loss was about 63% for bZIF-8 and 65% for nZIF-8 and the XRD profiles of the oxidized material confirmed both to contain ZnO. Based on the water content and concentration of Zn analyzed by total dissolution and C, H, N analysis, the compositions of bZIF-8 and nZIF-8 were determined as Zn(2Mim)1.95 and Zn(2Mim)2.13, respectively. This difference suggests that nZIF-8 is a 2Mim rich material in comparison to the standard formula Zn(2Mim)2 of ZIF-8. The excess 2Mim molecules are likely attached to the Zn(2Mim) particles, as in the case of other water dispersible porous coordination polymers.34 In fact, nZIF-8 shows rapid dispersion in the aqueous phase, while bZIF-8 remained floating on the surface when not stirred. The zeta potential of these two ZIF-8 materials was also found to be remarkably different. bZIF-8 displays a positive value of about +21 mV, in contrast to the zeta potential of about −30 mV of nZIF-8. This difference can be largely correlated to the Zn-rich and 2Mim-rich compositions of the materials. Different zeta potential values could be responsible for the observed dispersion behavior in water.The SEM images of nZIF-8 (Fig. 2) show homogeneously distributed hexagonal particles, much finer than those of bZIF-8. In addition, from the XRD profiles of nZIF-8, the crystallite size was found to be ∼43 nm, while that of bZIF-8 was ∼65 nm. In the SEM images, the size of nZIF-8 is much finer, indicating the dense aggregation of the nanocrystals of bZIF-8.
 | ||
| Fig. 2 SEM images showing the finer and homogeneously distributed (a and b) nZIF-8 particles in comparison with those of (c) bZIF-8. | ||
3.2 Adsorption performance with ng L−1 concentration AsO43−
Since our focus was on the lower concentration limit of ZIF-8 adsorption, we performed experiments using initial arsenic solutions with 0.01, 0.1, 1, and 10 μg L−1 in pure water mixed with nZIF-8 at the liquid to solid ratio (v/m) of 10000 mL g−1. Before that the kinetics of adsorption of low concentration As(V) onto nZIF-8 was studied. For this, a relatively higher starting concentration of about 120 μg L−1 was used so that the residual concentration can still be quantitatively measured. This experiment was carried out in v/m of 10000. The adsorption took place smoothly and the residual concentration reached 1/1000 of the starting concentration in 1 h, Fig. 3. Irrespective of the high solution volume, achieving near total adsorption demonstrates the high potential of nZIF-8 for the adsorption of arsenic in drinking water.
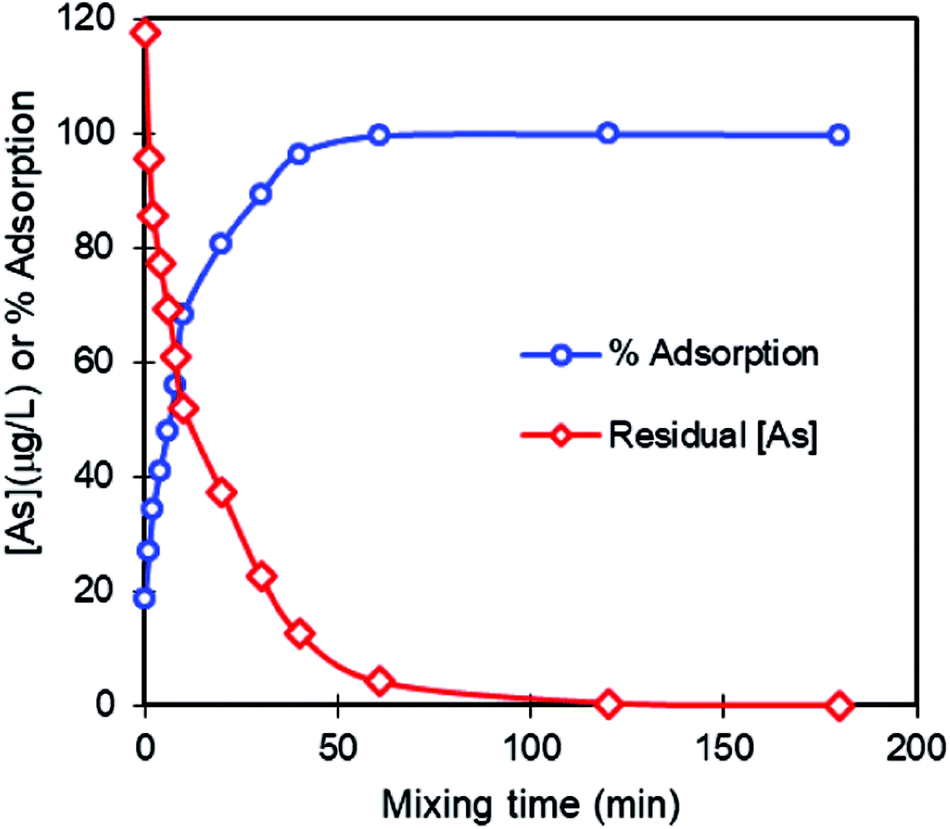 | ||
| Fig. 3 Kinetics of adsorption of arsenic onto nZIF-8. Initial concentration = 117 μg L−1. 80 mg nZIF-8, 800 mL solution, sampling volume = 0.1 mL, replicates = 3, mixing temperature = 25 °C, mixing rate = 130 rpm. | ||
After observing the kinetics result, 1 h mixing time was set for all the trace concentration tests. The adsorption rate was investigated by evaluating the equilibrium arsenic concentration in the solution. As shown in Fig. 4(a), almost total adsorption was observed, with less than 1% standard deviation (5 data points) at 0.1 μg L−1 and higher concentrations. We next evaluated the amount of arsenic in nZIF-8 after adsorption. Since ZIF-8 is soluble in acid, it was dissolved in a 5% nitric acid solution to recover the residue and the enriched concentration of arsenic in said solution was analyzed by ICP-MS. For the concentration >0.1 μg L−1, the mass balance, which is the ratio of the amount of arsenic in the nZIF-8 dissolved solution and the amount of arsenic adsorbed (calculated by the difference between the initial and final arsenic concentrations in the solution phase), was found to be nearly 100%.
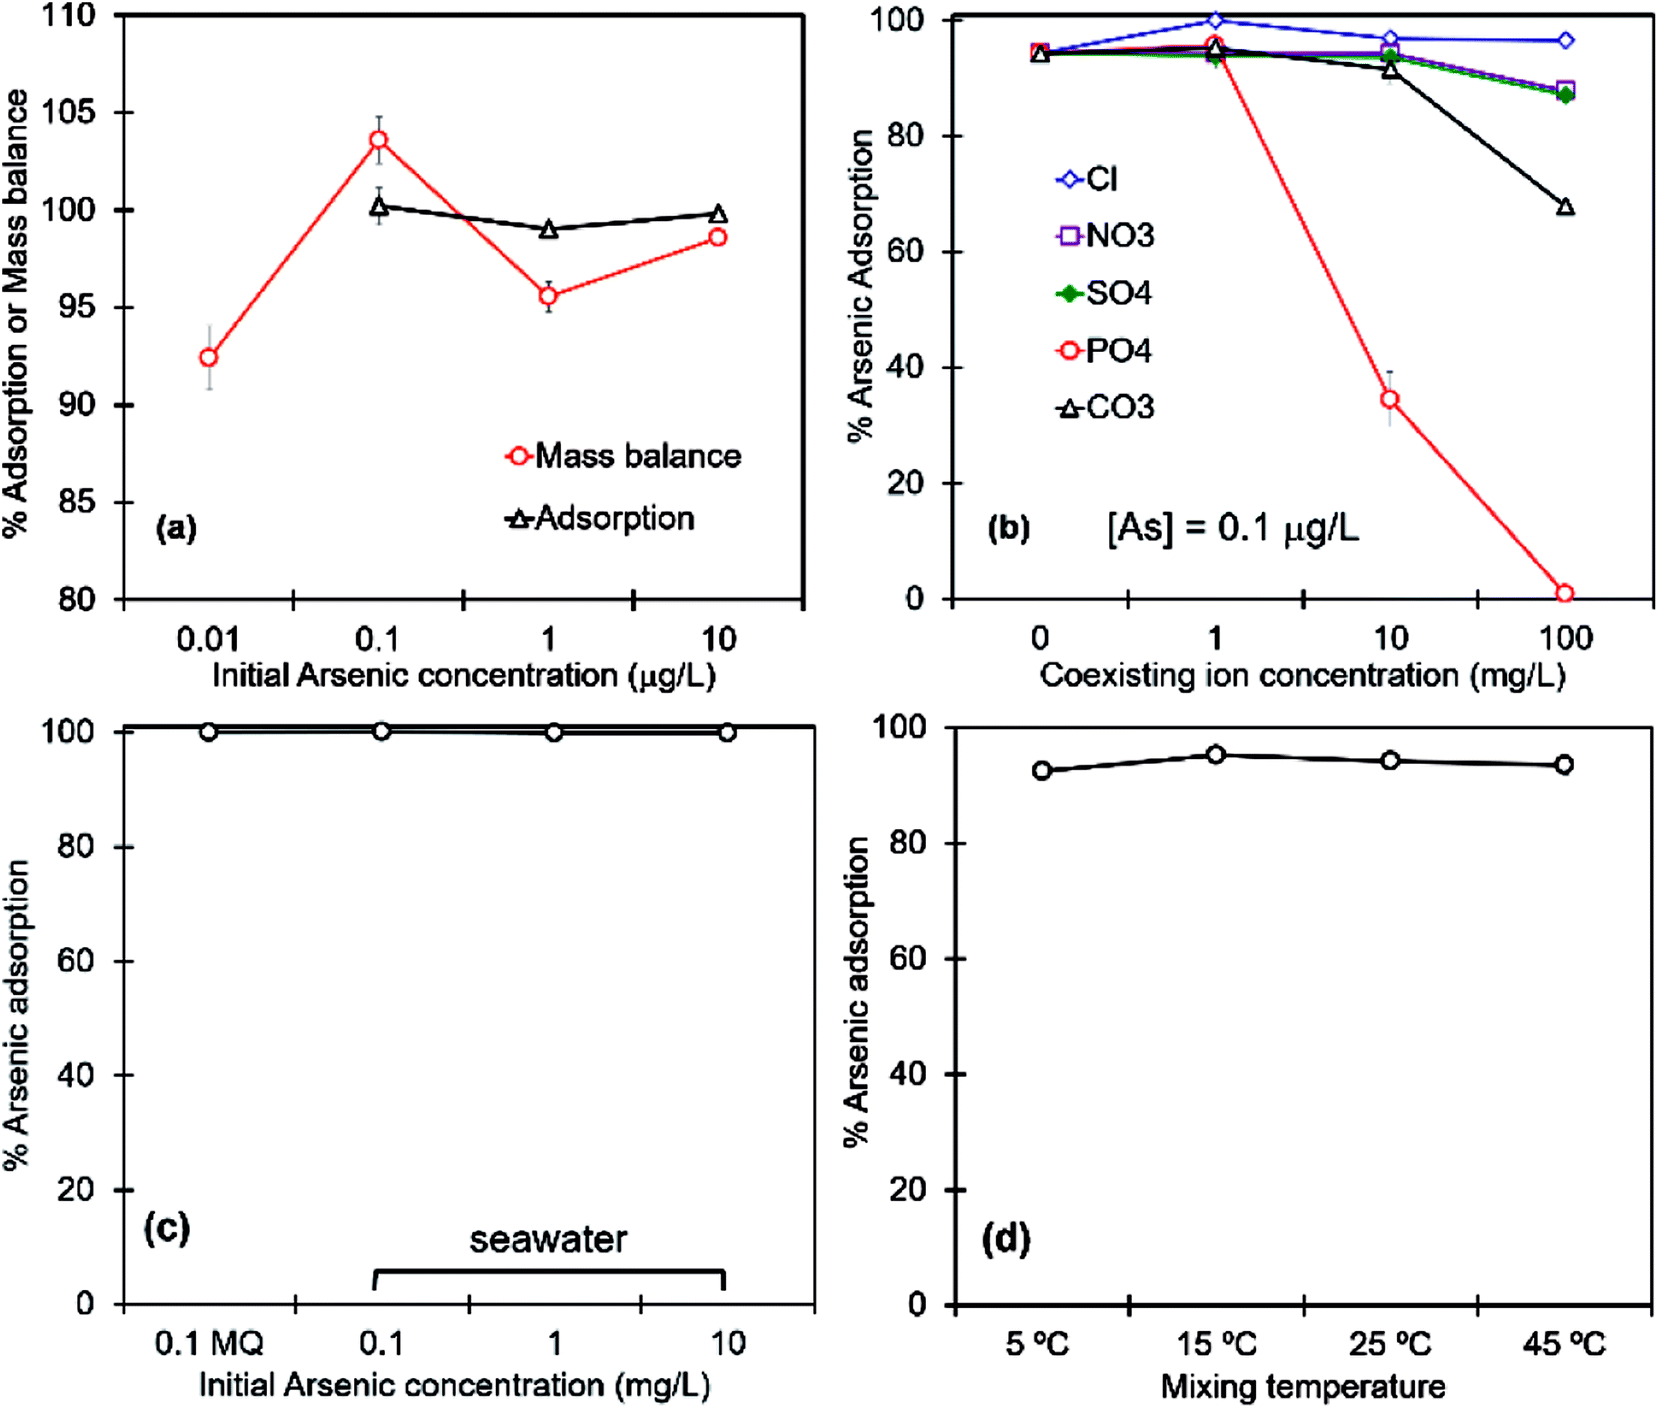 | ||
| Fig. 4 (a) Enrichment of 0.01–10 μg L−1 arsenic in pure water using nZIF-8 and estimation of the enrichment ratio by analyzing the concentration of arsenic in the solid phase upon dissolution followed by ICP-MS analysis. v/m = 10000, 100 mg nZIF-8 in 1 L AsO43− solution, 1 h mixing at room temperature, 130 rpm. (b) Effect of coexisting ions on the adsorption of arsenic on nZIF-8 for 0.1 μg L−1 arsenic in pure water with 1, 10, 100 mg L−1 respective anion in pure water. (c) Arsenic adsorption on nZIF-8 from seawater. (d) Adsorption of 0.1 μg L−1 arsenic on nZIF-8 at various temperatures. (b–d) v/m = 2000, 600 rpm at 25 °C for 1 h. | ||
Because the final concentration is below the quantifying lower limit of ICP-MS in the case of the initial concentration 0.01 μg L−1, both the adsorption and mass balance results show large deviations. Therefore, for initial 0.01 μg L−1 or less, the method can be used only for semi-quantitative estimation.
We also demonstrate that trace arsenic adsorption by nZIF-8 is maintained even in the presence of high-concentrated coexisting anions. The effect of coexisting anions was studied by adding 0.1 μg L−1 of an arsenic solution to 1, 10, and 100 mg L−1 solutions of Cl−, CO32−, SO42−, PO43−, and NO3−. As shown in Fig. 4(b), even at 0.1 μg L−1 arsenic, the effect of abundant co-ions was not that disturbing, except for PO43−, which displays almost the same aqueous chemistry as AsO43− (Fig. S3†). Compared to commonly used materials, the adsorption of more than 90% AsO43− from a 0.1 μg L−1 solution itself is an impressive outcome. In addition to that, the significantly higher adsorption from solutions containing other anions suggests nZIF-8 as a material with great potential as an arsenic adsorbent.
The experiments with commonly coexisting anions (Fig. 4(b)) suggest the highly selective performance of nZIF-8 for trace-level arsenic. We then turned our attention to seawater matrices. As such, 0.1 to 10 mg L−1 arsenic solutions were prepared in artificial seawater (Daigo's Artificial Seawater 395-01343, sold by Wako Chemicals, Japan). In this case, the initial concentration of arsenic could not be set to less than 10 μg L−1 owing to the limitations of ICP-MS analysis. At least 1000 time dilution of seawater is necessary to obtain data free of deviation due to matrix effects of the Na ions. Thus, the starting concentration of arsenic was set at 0.1 mg L−1 and the results were compared to those obtained for a pure water solution (Fig. 4(c)). The outcome is of high application importance as the material selectively recovered a major fraction of AsO43−. In general, the analysis of low concentration ions in seawater is very difficult owing to its high salinity. However, with the use of nZIF-8, arsenic can be selectively separated from saline water and re-dissolved or extracted affording a concentrated solution with little to no salinity.
For the evaluation of trace arsenic adsorption at different temperatures, the effect of the solution temperature was studied. Adsorption of 0.1 μg L−1 AsO43− from 5 to 45 °C was studied at a v/m of 2000 mL g−1. Since the nZIF-8 powder gets dispersed in water forming fine and translucent microbead-like structures, the effect of the temperature is almost negligible (Fig. 4(d)). At mixing temperatures of 5, 15, 25, and 45 °C, recoveries of 93% to 95% of arsenic were obtained. In other words, under the given conditions, more than 90% of arsenic in AsO43− form, at a concentration level that is otherwise considered undetectable, can be collected and measured after adsorption on nZIF-8.
3.3 Adsorption mechanism: a ligand exchange process
For our second aim, the elucidation of the mechanism, a typical adsorption experiment was carried out taking 100 mg L−1 arsenic in the form of KH2AsO4 in pure water at varying pH values. The pH was adjusted using HCl or NaOH solutions. As shown in the inset of Fig. 5(a), for 10 mg ZIF-8 with 20 mL of the solution, the amount of arsenic adsorbed was higher for nZIF-8. An interesting observation in this experiment is the final solution pH. At acidic to neutral starting pH values, the value at equilibrium was increased to 8.5–8.9. It was thus interesting to investigate the relation between the solution pH and the total amount of arsenic adsorbed. For both bZIF-8 and nZIF-8, despite their different respective adsorption loadings, a gradual decrease in the capacity was observed with the increasing initial pH. | ||
| Fig. 5 (a) XRD profiles and (b) FT-IR spectra of bZIF-8 and nZIF-8 confirming that the ZIF-8 structure has been maintained after adsorption of high-concentration arsenic under different pH conditions. Legend: (1) nZIF-8 pH 9; (2) nZIF-8 pH 6.5; (3) nZIF-8 pH 4.8; (4) Pure nZIF-8; (5) bZIF-8 pH 9; (6) bZIF-8 pH 6.5; (7) bZIF-8 pH 4.8; (8) Pure bZIF-8. The inset in (a) shows the decrease in the arsenic adsorption capacity of ZIF-8 with the increasing solution pH. Conditions: 20 mL of a 100 mg L−1 solution, 10 mg ZIF-8, 1 h, 25 °C. | ||
Assuming that the increase in the solution pH is the result of the material dissolution, it would be interesting to observe the changes in the material morphology. The XRD profiles and FT-IR spectra (Fig. 5), however, do not show any sharp variations in the structure or functionality after adsorption of a significant amount of AsO43−. In addition, only a negligible amount of Zn (less than 5 μg L−1) was detected in the solution after adsorption, suggesting that almost no Zn in ZIF-8 was released into the solution. A point to note here is that the concentration of K in the solution from KH2AsO4 also remained nearly unchanged. Therefore, neither Zn leaves the ZIF-8 structure nor K is encapsulated in it. In other words, the adsorption can be considered as either the result of the encapsulation of AsO43− or its exchange with the 2Mim ligand. The increase of the solution pH after ZIF-8 addition was the same irrespective of the amount of KH2AsO4 in the solution or the initial pH. Therefore, it can be concluded that this phenomenon is not necessarily correlated with the adsorption of arsenic.
In order to clarify the adsorption mechanism, an elaborated study using different starting concentrations of AsO43− was carried out. Together with the solution pH as well as the concentration of K and Zn in the solution before and after adsorption, the TOC and TN contents of the solution were also determined. For this, AsO43− solutions at 1–100 mg L−1 were mixed with nZIF-8 at 2000 mL g−1 of solid-to-solution ratio. A typical variation in the amount of adsorption (Fig. S5†) with the initial concentration suggests that the process mainly follows single mechanism. Since the solution pH varies with the concentration of KH2AsO4, at 1 mg L−1 it is nearly neutral while the pH of the 100 mg L−1 solution was ∼4.2. Two sets of solutions, one without pH adjustment and the other with the pH adjusted to 6 were used. In both cases, the pH was found to increase to 8.6 ± 0.2.
Although pH shifts and unchanged concentrations of K and Zn were observed as in the previous cases, large variations in the TOC and TN values were measured. As shown in Fig. 6, a minimum value was obtained, ∼0.9 mol kg−1 TOC (and the corresponding amount of TN, not shown in the figure), which was the same for nZIF-8 and bZIF-8. This concentration most likely represents the amount of 2Mim required to increase the solution pH to the favored weakly alkaline value of 8.6 ± 0.2. However, when the concentration of arsenic was over 1 mg L−1, a linear increase in the TOC and TN values was observed, corresponding to the amount of 2Mim dissolved in the solution phase. This trend was also observed for the commercial bZIF-8 sample. Since the solution pH remains at about 8.6, the majority of AsO43− is expected to exist as HAsO42−. Therefore, the expected exchange takes place according to eqn (1), releasing two moles of 2Mim per mole of adsorbed arsenic.
| Zn(C4H5N2)2 + HAsO42− → ZnHAsO4 + 2C4H5N2− | (1) |
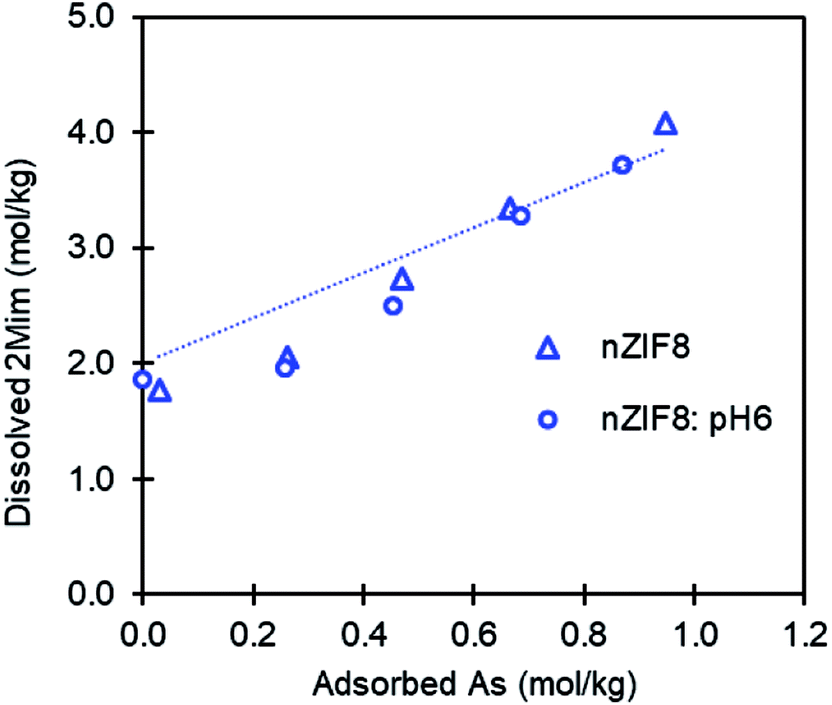 | ||
| Fig. 6 Dissolved 2Mim (TOC-based) showing the mole to mole exchange of HAsO42− with 2Mim. | ||
This outcome suggests that the increased solution pH and adsorption of AsO43−, respectively, occurs at the cost of 2Mim molecules from ZIF-8. Also, as explained in the previous section, the XRD profile of the AsO43−-adsorbed material was, in general, consistent with that of pristine ZIF-8. Overall, the uptake of AsO43− takes place basically by replacing the 2Mim-anions in the ZIF-8 framework with H2AsO42−, maintaining the structure up to at least 90 mg of adsorbed arsenic per gram of material. However, if the adsorbate is arsenite, As(III), since its oxide remains in neutral form in the pH range of drinking water, a different mechanism is expected. Relatively lower capacity for As(III) and the deformation of the crystal structure after its adsorption, which was not observed in the present study suggest the possibility of a different driving mechanism.14,15
3.4 Application for the analysis of arsenic levels below the WHO-recommended level
As described above, nZIF-8 exhibits high adsorption performance toward arsenic even at the ng L−1 level in aqueous solution. However, its repeated utilization for decontamination would be unfeasible, because a certain level of 2Mim is eluted every time arsenic is adsorbed. However, its use for the pre-concentration of arsenic before conventional analysis is promising. If a 100-fold concentrated arsenic solution could be obtained using nZIF-8, the limit of quantification of a conventional method could be lowered by that magnitude. In principle, for example in combination with ICP-MS or colorimetry methods, the minimum limits of 0.1 and 10 μg L−1, respectively, would be reduced to 0.001 and 0.1 μg L−1 arsenic by means of a pre-concentration step by nZIF-8.It is well known that the concentration of arsenic itself in flowing waters varies with the location. For example, in Japanese rivers, the arsenic concentration is below 2 μg L−1 with an average of 0.57 μg L−1. However, the average concentrations of Cl−, NO3−, and SO42− are 4.6, 1.6, and 7.4 mg L−1, respectively. The average concentration of phosphorus, which includes the highly competing PO43− ion, is 12.1 μg L−1, a value which presents almost no effect on the adsorption of trace-level AsO43− on nZIF-8.
The provisional value by the WHO is below 10 μg L−1 and it is the same in many countries. The term provisional suggests that the value has not been proved yet as safe; moreover, it will need updating once more suitable methodologies are developed. Under such circumstances, nZIF-8, which offers highly selective uptake of soluble arsenic oxyanions (except in the presence of 100 mg L−1 PO43−), could be used for concentration followed by quantitative estimation. The high selectivity of nZIF-8 for arsenic adsorption is a key factor for systems such as seawater or industrial water consisting of other elements. When counter ions hamper the reliable analysis by ICP-MS for high precision determination, this scheme of selective uptake on nZIF-8, followed by dissolution to afford a solution with a higher arsenic concentration and manageable matrix effects, offers clear advantages. For practical analysis, adsorption followed by colorimetric analysis is preferred. However, one should keep in mind the limitations of the test kits themselves. The only limitation to consider when using MQuant™, the kit employed in the current study, is the use of an acidic solution to dissolve nZIF-8.
Upon achieving the successful concentration of as low as 0.01 μg L−1 arsenic using nZIF-8, realistic experiments using 0.5–300 ng L−1 solutions in pure water, nZIF-8, a 5 L bottle for the adsorption process, a filtration system with a 0.45 μm membrane filter, and the MQuant™ colorimetric kit were carried out. In order to ascertain the degree of enrichment not only by visual comparison of the colored stripes with the MQuant™'s standard color/concentration spectrum, a calibration curve using UV-Vis spectroscopy in reflection mode at concentrations of 0.005–0.15 mg L−1 arsenic was constructed by plotting the peak area between 420 and 750 nm (Fig. S5†). This plot, which passes through the origin, presents an R2 value of 0.998 and a slope of 1397.2. Using this plot, quantitative estimation of the arsenic content in the color stripe was achieved. For solutions in fresh water, the kit could estimate traces of arsenic with 90–106% accuracy (Table 1). However, only 42% accuracy was obtained for 100 ng L−1 arsenic in seawater.
| The 3 L solution in | Initial conc. (ng L−1) | Final conc. (mg L−1) | % accuracy | |
|---|---|---|---|---|
| Estimated | MQuant analysis | |||
| Pure water | 50 | 2.5 | 2.67 | 106.8 |
| 100 | 5.0 | 4.54 | 90.8 | |
| 300 | 15 | 15.12 | 100.8 | |
| Seawater | 100 | 5.0 | 2.08 | 42 |
In fresh water, this preliminary work aimed for the monitoring of trace concentration arsenic has shown the highly positive result. The next step in this regard would be making the process more feasible for the field tests. For this, the process will be repeated taking the simulated or real contaminated water. Also, because the size of nZIF-8 is <50 nm, work on making nZIF-8 film or membrane will be carried out so that the filtration step in the presented scheme can be avoided. In addition, the discussion on arsenite, As(III), is intentionally avoided in this work. The primary reason is to focus on explaining the so far vague mechanism of arsenic oxide anion adsorption by ZIF-8. Regarding the application, because several works have demonstrated the adsorption of substantial concentration of the arsenite by ZIF-8, we expect that the results discussed in this work can be replicated for the arsenite as well.
4 Conclusion
nZIF-8 prepared in the aqueous phase with negative zeta potential is found to be highly dispersible in water. This property is expected to ease the adsorption of trace concentration arsenate in a large solution to material ratio. Almost complete adsorption of 10 ng L−1 arsenate onto nZIF-8 is an encouraging outcome for the monitoring purpose. However, because the arsenate adsorption is confirmed to be a ligand exchange process, ZIF-8 cannot be recommended for the decontamination application, even though the material offers a very high adsorption capacity. The monitoring-oriented experiment coupled with the handy colorimetric tool showed a high precision result. This outcome can certainly be implemented in the regions where the analysis of below mg L−1 arsenic is still a big deal. Because nZIF-8 is obtained in <50 nm size, it can be fabricated into membrane or film form so that the process becomes even handier. Real application oriented work taking arsenate contaminated water and the nZIF-8 film is going on.Conflicts of interest
There are no conflicts to declare.Acknowledgements
The authors are thankful to Hiromi Noguchi, Masami Kawakami, and Koji Sakurai for their technical assistance.References
- U. K. Chowdhury, B. K. Biswas, T. R. Chowdhury, G. Samanta, B. K. Mandal, G. C. Basu, C. R. Chanda, D. Lodh, K. C. Saha, S. K. Mukherjee, S. Roy, S. Kabir, Q. Quamruzzaman and D. Chakraborti, Environ. Health Perspect., 2000, 108, 393–397 CrossRef CAS PubMed.
- A. Pal, U. K. Chowdhury, D. Mondal, B. Das, B. Nayak, A. Ghosh, S. Maity and D. Chakraborti, Environ. Sci. Technol., 2009, 43, 3349–3355 CrossRef CAS PubMed.
- M. Amini, K. C. Abbaspour, M. Berg, L. Winkel, S. J. Hug, E. Hoehn, H. Yang and C. A. Johnson, Environ. Sci. Technol., 2008, 42, 3669–3675 CrossRef CAS PubMed.
- R. Smith, R. Knight and S. Fendorf, Nat. Commun., 2018, 9, 2089 CrossRef PubMed.
- WHO, Guidelines for Drinking-water Quality, 3rd edn, 2016, vol. 1, ISBN 92 4 154638 7 Search PubMed.
- R. K. Dhar, Y. Zheng, J. Rubenstone and A. van Geen, Anal. Chim. Acta, 2004, 526, 203–209 CrossRef CAS.
- F. T. Henry, T. O. Kirch and T. M. Thorpe, Anal. Chem., 1979, 51, 215–218 CrossRef CAS.
- Y. Song and G. M. Swain, Anal. Chem., 2007, 79, 2412–2420 CrossRef CAS PubMed.
- Y. He, Y. Zheng, M. Ramnaraine and D. C. Locke, Anal. Chim. Acta, 2004, 511, 55–61 CrossRef CAS.
- L. Bu, T. Gu, Y. Ma, C. Chen, Y. Tan, Q. Xie and S. Yao, J. Phys. Chem. C, 2015, 119, 11400–11409 CrossRef CAS.
- P. L. Smedley and D. G. Kinniburgh, Appl. Geochem., 2002, 17, 517–568 CrossRef CAS.
- B. Petrusevski, S. Sharma, J. Schippers and K. Shordt, Arsenic in Drinking Water, 2007, vol. 17, pp. 3–24 Search PubMed.
- B. K. Jung, J. W. Jun, Z. Hasan and S. H. Jhung, Chem. Eng. J., 2015, 267, 9–15 CrossRef CAS.
- M. Jian, B. Liu, G. Zhang, R. Liu and X. Zhang, Colloids Surf., A, 2015, 465, 67–76 CrossRef CAS.
- B. Liu, M. Jian, R. Liu, J. Yao and X. Zhang, Colloids Surf., A, 2015, 481, 358–366 CrossRef CAS.
- A. J. Howarth, Y. Liu, J. T. Hupp and O. K. Farha, CrystEngComm, 2015, 17, 7245–7253 RSC.
- J. Li, Y. Wu, Z. Li, B. Zhang, M. Zhu, X. Hu, Y. Zhang and F. Li, J. Phys. Chem. C, 2014, 118, 27382–27387 CrossRef CAS.
- Z. Zou, S. Wang, J. Jia, F. Xu, Z. Long and X. Hou, Microchem. J., 2016, 124, 578–583 CrossRef CAS.
- Y.-N. Wu, M. Zhou, B. Zhang, B. Wu, J. Li, J. Qiao, X. Guan and F. Li, Nanoscale, 2013, 6, 1105–1112 RSC.
- S. E. Amrose, S. R. S. Bandaru, C. Delaire, C. M. van Genuchten, A. Dutta, A. DebSarkar, C. Orr, J. Roy, A. Das and A. J. Gadgil, Sci. Total Environ., 2014, 488–489, 539–546 CrossRef CAS PubMed.
- C. M. Van Genuchten, S. E. A. Addy, J. Peña and A. J. Gadgil, Environ. Sci. Technol., 2012, 46, 986–994 CrossRef CAS PubMed.
- L. Li, C. M. Van Genuchten, S. E. A. Addy, J. Yao, N. Gao and A. J. Gadgil, Environ. Sci. Technol., 2012, 46, 12038–12045 CrossRef CAS PubMed.
- A. Gupta, V. S. Chauhan and N. Sankararamakrishnan, Water Res., 2009, 43, 3862–3870 CrossRef CAS PubMed.
- K. Gupta, T. Basu and U. C. Ghosh, Engineering, 2009, 2222–2228 CAS.
- C. Hang, Q. Li, S. Gao and J. K. Shang, Ind. Eng. Chem. Res., 2012, 51, 353–361 CrossRef CAS.
- C.-S. Jeon, K. Baek, J.-K. Park, Y.-K. Oh and S.-D. Lee, J. Hazard. Mater., 2009, 163, 804–808 CrossRef CAS PubMed.
- S. Luther, N. Borgfeld, J. Kim and J. G. Parsons, Microchem. J., 2012, 101, 30–36 CrossRef CAS.
- A. Maiti, J. K. Basu and S. De, Chem. Eng. J., 2012, 191, 1–12 CrossRef CAS.
- S. M. Maliyekkal, L. Philip and T. Pradeep, Chem. Eng. J., 2009, 153, 101–107 CrossRef CAS.
- C. A. Martinson and K. J. Reddy, J. Colloid Interface Sci., 2009, 336, 406–411 CrossRef CAS PubMed.
- G. S. Zhang, J. H. Qu, H. J. Liu, R. P. Liu and G. T. Li, Environ. Sci. Technol., 2007, 41, 4613–4619 CrossRef CAS PubMed.
- M. L. Chen, Y. Sun, C. B. Huo, C. Liu and J. H. Wang, Chemosphere, 2015, 130, 52–58 CrossRef CAS PubMed.
- D. Yamamoto, T. Maki, S. Watanabe, H. Tanaka, M. T. Miyahara and K. Mae, Chem. Eng. J., 2013, 227, 145–150 CrossRef CAS.
- A. Gotoh, H. Uchida, M. Ishizaki, T. Satoh, S. Kaga, S. Okamoto, M. Ohta, M. Sakamoto, T. Kawamoto, H. Tanaka, M. Tokumoto, S. Hara, H. Shiozaki, M. Yamada, M. Miyake and M. Kurihara, Nanotechnology, 2007, 18, 345609 CrossRef.
Footnote |
| † Electronic supplementary information (ESI) available: Table S1: List of interfering ions for arsenic analysis using the MQuant™ kit. Fig. S1:† Schematic diagram of the in-flow synthesis of nZIF-8. Fig. S2:† TG-DTA profiles of nZIF-8 and bZIF-8. Fig. S3:† Ion speciation diagram of arsenate and phosphate. Fig. S4.† Adsorption isotherm. Fig. S5:† Calibration curve for arsenic analysis using the MQuant™ kit. See DOI: 10.1039/c8ra07776b |
| This journal is © The Royal Society of Chemistry 2018 |