 Open Access Article
Large enhanced photocatalytic activity of g-C3N4 by fabrication of a nanocomposite with introducing upconversion nanocrystal and Ag nanoparticles†
Feifei Zhao‡
,
Kyu Kyu Khaing‡,
Dongguang Yin *,
Bingqi Liu,
Tao Chen,
Chenglong Wu,
Kexian Huang,
LinLin Deng and
Luqiu Li
School of Environmental and Chemical Engineering, Shanghai University, Shanghai, 200444, China. E-mail: ydg@shu.edu.cn
First published on 19th December 2018
Abstract
A novel heterostructured nanocomposite UCNPs@SiO2@Ag/g-C3N4 was developed for the first time to substantially boost the solar-light driven photocatalytic activity of g-C3N4. Its photocatalytic properties and photocatalytic mechanism were investigated. The as-synthesized photocatalyst with excellent improvement in the solar absorption and separation efficiency of photoinduced electron–hole pairs exhibited optimum solar-induced photocatalytic activity in dye degradation and hydrogen production. The experimental results showed that the rates of degradation of Rhodamine B (RhB) and hydrogen evolution were about 10 and 12 times higher than that of pristine g-C3N4, respectively. The excellent photocatalytic activity was attributed to the synergetic effect of upconversion nanoparticles (UCNPs) and Ag nanoparticles (NPs) on the modification of the photocatalytic properties of g-C3N4, resulting in a broad light response range for g-C3N4 as well as the fast separation and slow recombination of photoinduced electron–hole pairs. This study provides new insight into the fabrication of g-C3N4-based nanocomposite photocatalysts with high catalytic efficiency through the artful assembly of UCNPs, Ag NPs and g-C3N4 into a hetero-composite nanostructure. The prominent improvement in photocatalytic activity enables the potential application of g-C3N4 in the photocatalytic degradation of organic pollutants and hydrogen production utilizing solar energy.
1. Introduction
In recent years, the energy crisis and the continued deterioration of the global environment have become serious problems that have attracted great attention all over the world.1,2 Semiconductor-based photocatalysis is a potential strategy for solving these problems through photocatalytic water splitting to produce clean energy hydrogen and the degradation of organic pollutants using solar energy.3–5 Semiconductor photocatalysts with low toxicity, good stability, and high activity under solar light are essential for practical photocatalytic applications.6 However, the most widely used and representative semiconductor photocatalysts, such as TiO2 and ZnO, can only respond to UV light with low quantum efficiency under solar light irradiation, which greatly limits their practical applications using solar energy.7 Therefore, the development of new visible light response photocatalysts with high quantum efficiency has become a hot issue in the field of photocatalysis.Recently, as a metal-free polymeric semiconductor, graphitic carbon nitride (g-C3N4) has gained extensive attention owing to its outstanding merits such as visible-light response, Earth-abundance, high chemical and thermal stabilities, and suitable valence and conduction band potentials for producing hydrogen and oxygen by photocatalytic water splitting.8,9 These unique properties make g-C3N4 a promising photocatalyst for photocatalytic hydrogen production and the degradation of organic pollutants using solar energy. However, it has been found that g-C3N4 suffers from narrow visible-light response range, fast charge recombination, and small specific surface area, which limit its practical applications.10–12 To date, various strategies have been developed, such as morphology modification, coupling with other semiconductors to form nanoheterojunctions, doping of metal and/or nonmetal ions, and copolymerization with other kinds of π-conjugated organic molecules.13–17 Although the photocatalytic activity of g-C3N4 has been improved to varying degrees by the above strategies, the obtained g-C3N4-based photocatalysts still cannot satisfy the needs of the practical applications with respect to photocatalytic activity under solar light irradiation.
In order to utilize solar energy, most strategies in previous studies have focused on extending the optical response range of g-C3N4 into the visible region.6,17–19 Nonetheless, having photocatalysts that respond only to visible light, with the near-infrared (NIR) light being wasted, is far from satisfactory. It is well-known that the NIR light accounts for a large proportion (∼46%) of the whole solar energy.20 Moreover, electron–hole pairs that are photo-generated by the excitation of visible light usually possess low oxidation–reduction potentials.7,20,21 Only those electron–hole pairs produced from the excitation of ultraviolet light possess high oxidation and reduction capabilities to completely degrade pollutants.22,23 In view of these, the combination of semiconductors with rare earth UCNPs is a facile and efficient method to substantially utilize the solar energy and improve the photocatalytic activity of semiconductor photocatalysts.24,25 The UCNPs can convert two or more NIR photons with lower energy into UV and visible emission,26 which can subsequently be absorbed by the semiconductor. This enables the indirect utilization of the NIR photons for photocatalysis. Moreover, the high-energy UV light from the UCNPs can excite the semiconductor to generate electron–hole pairs with high oxidation–reduction potentials. There have been reports, including ours, on the combination of UCNPs with some inorganic semiconductors such as TiO2 and CeO2.27,28 It has been proved that this strategy is effective for improving the photocatalytic activity of semiconductor photocatalysts.25 However, there are few reports about the coupling of UCNPs with g-C3N4. Furthermore, these inorganic semiconductors have inflexible band structures, and they can hinder light absorption due to serious light scattering, but g-C3N4 has a readily tunable energy band and highly transparent morphology.27,28 Thus, a combination of g-C3N4 with UCNPs is likely to make better use of the upconversion energy from NIR light and subsequently improve the photocatalytic performances of g-C3N4 more efficiently.
Plasmonic metallic nanostructures, for example, Ag NPs, combined with semiconductor photocatalysts for achieving high-efficiency photocatalysis by the efficient separation of charge carriers have been reported.17,29,30 In this study, in view of combining g-C3N4 with UCNPs and Ag NPs for the substantial utilization of solar energy as well as restraining the recombination rate of photo-generated electrons and holes, we designed and synthesized a novel g-C3N4-based nanocomposite photocatalyst UCNPs@SiO2@Ag/g-C3N4. We first prepared a sandwich-structure nanocomposite of UCNPs@SiO2@Ag and then loaded this nanocomposite onto the surface of g-C3N4 to form the final product. Taking advantage of the synergistic effect from UCNPs and Ag NPs, the nanocomposite photocatalyst shows very high photocatalytic efficiency for dye degradation and hydrogen evolution under solar light irradiation, demonstrating that the designed strategy can significantly improve the photocatalytic activity of g-C3N4 under solar light irradiation.
2. Experimental section
2.1. Materials
Rare-earth oxides Lu2O3 (99.999%), Gd2O3 (99.999%), Yb2O3 (99.999%), and Tm2O3 (99.999%) were purchased from Shanghai Yuelong New Materials Co. Ltd. Oleic acid (OA; >90%), 1-octadecene (ODE; >90%), CO-520, tetraethylorthosilicate (TEOS; >99%), 1,4-benzoquinone (BQ), disodium ethylenediaminetetraacetate (Na2EDTA), tert-butyl alcohol (t-BuOH), and Rhodamine B (RhB) were purchased from Sigma-Aldrich. Trifluoroacetic acid (99.0%), (3-aminopropyl)triethoxysilane (APTES; >98%), NH3·H2O (28 wt%), ethanol, cyclohexane, acetone, sodium carbonate, silver nitrate, sodium citrate, and urea were purchased from Sinopharm Chemical Reagent Co. Ltd. (Shanghai). Ln(CF3COO)3 (Ln: Lu, Gd, Yb, and Tm) precursors were prepared by dissolving the corresponding metal oxides in trifluoroacetic acid at elevated temperature. Milli-Q water was used in the experiments. All other chemical reagents were of analytical grade and were used without further purification.2.2. Synthesis
The nanosheets of g-C3N4 were prepared by thermal oxidation etching of the bulk g-C3N4 obtained as above in static air as follows:32 400 mg of the bulk g-C3N4 was placed in an open ceramic container and was heated at 500 °C for 2 h with a ramp rate of 5 °C min−1. A light yellow powder of g-C3N4 nanosheets was finally obtained.
![[thin space (1/6-em)]](https://www.rsc.org/images/entities/char_2009.gif) :
:![[thin space (1/6-em)]](https://www.rsc.org/images/entities/char_2009.gif) 1, v/v) three times. The collected precipitate was dispersed in cyclohexane.
1, v/v) three times. The collected precipitate was dispersed in cyclohexane.![[thin space (1/6-em)]](https://www.rsc.org/images/entities/char_2009.gif) :
:![[thin space (1/6-em)]](https://www.rsc.org/images/entities/char_2009.gif) 1 v/v) twice and then re-dispersed in ethanol.
1 v/v) twice and then re-dispersed in ethanol.![[thin space (1/6-em)]](https://www.rsc.org/images/entities/char_2009.gif) :
:![[thin space (1/6-em)]](https://www.rsc.org/images/entities/char_2009.gif) 1 v/v). The final product was dispersed in ethanol.
1 v/v). The final product was dispersed in ethanol.Based on the procedures in 2.2.5 and 2.2.6, the UCNPs@SiO2@Ag/g-C3N4 photocatalysts with different loading levels of Ag NPs were prepared by adding different amounts of AgNO3 and sodium citrate. The obtained samples were marked as UCNPs@SiO2@Xwt%Ag/g-C3N4, with X representing the weight percentage of Ag relative to g-C3N4 in the nanocomposite and X varied from 0 to 10 (X = 0, 1, 3, 5, and 10).
![[thin space (1/6-em)]](https://www.rsc.org/images/entities/char_2009.gif) :
:![[thin space (1/6-em)]](https://www.rsc.org/images/entities/char_2009.gif) 1 v/v). The final product was dispersed in 10 mL ethanol, then 34 mg of g-C3N4 dispersed in 20 mL deionized water was added to the solution and magnetic stirring was continued for 12 h at room temperature. The as-obtained Ag/g-C3N4 suspension was transferred into a Teflon-lined stainless steel autoclave and heated at 180 °C for 24 h in an electric oven. After the reaction, the product was collected by centrifugation, followed by washing with deionized water and ethanol three times. Finally, the product was dried in vacuum at 80 °C overnight.
1 v/v). The final product was dispersed in 10 mL ethanol, then 34 mg of g-C3N4 dispersed in 20 mL deionized water was added to the solution and magnetic stirring was continued for 12 h at room temperature. The as-obtained Ag/g-C3N4 suspension was transferred into a Teflon-lined stainless steel autoclave and heated at 180 °C for 24 h in an electric oven. After the reaction, the product was collected by centrifugation, followed by washing with deionized water and ethanol three times. Finally, the product was dried in vacuum at 80 °C overnight.2.3. Characterization
The sizes and morphologies of the prepared products were characterized using a JEOL JEM-2010F transmission electron microscope (TEM) operating at 200 kV, equipped with an energy-dispersive X-ray (EDX) spectrometer. The powder X-ray diffraction (XRD) patterns were recorded by a Rigaku D/max-2500 X-ray diffractometer using Cu-Kα radiation. The 2θ angle of the XRD spectra was recorded at a scanning rate of 6 deg min−1 and was then converted to Cu-Kα radiation values using Bragg's law. The upconversion photoluminescence emission spectra were measured using an Edinburgh Instruments FLS920 fluorescence spectrophotometer. The samples were excited by a 980 nm continuous wave laser under the power density of 2 W cm−2. UV-Vis absorption spectra were obtained on a Hitachi 3010 UV-Vis spectrophotometer (Hitachi, Japan). UV-Vis-NIR diffuse reflectance spectra (DRS) were obtained on a Shimadzu UV-3600 spectrometer by using BaSO4 as a reference. Photoluminescence (PL) spectra were recorded by using an F-4500 fluorescence spectrophotometer with an excitation wavelength of 330 nm at room temperature.2.4. Photocatalytic degradation of RhB and the detection of active species
Photocatalysis was performed via monitoring RhB degradation by measuring the variation of the optical absorption of RhB with a Hitachi U-3010 spectrophotometer using an SGY-IB multifunction photochemical reactor (Nanjing Sidongke Electric Co. Ltd) as the photocatalytic reaction device. In a typical experiment, 20 mg of catalyst was dispersed in a quartz cuvette containing 50 mL of RhB aqueous solution (20 mg L−1). The suspension was magnetically stirred in the dark for 30 min to attain adsorption–desorption equilibrium between dye and catalyst. The photoreaction vessels were then exposed to the simulated solar light irradiation produced by a 300 W Xe lamp (PL-X500D) with a wavelength distribution similar to solar light. At given time intervals, the photoreacted solutions were analyzed by recording the variation in the absorption band maximum (554 nm) in the UV-Vis spectra of RhB.2.5. Photocatalytic hydrogen evolution
Photocatalytic hydrogen generation reactions were conducted in an outer Pyrex irradiation cell connected to a closed gas circulation system. In a typical experiment, 20 mg of the photocatalyst powder was dispersed in 100 mL of aqueous solution containing 10 vol% triethanolamine (TEOA) as a scavenger. The deposition of 3 wt% Pt as a reducing co-catalyst was achieved by dissolving H2PtCl6 in the above 100 mL reaction solution. Before the reaction, the system was thoroughly vacuumed and nitrogen was introduced. The reaction temperature was kept at around 10 °C. The photocatalytic reactions were initiated by using a 300 W Xe-lamp (PLS-SXE300). The amount of H2 generated was analyzed by online GC7900 gas chromatography.2.6. Electrochemical and photoelectrochemical measurements
The photocurrents were measured by using an electrochemical workstation (CHI660A, Chen Hua Instruments, Shanghai, China) in a standard three-electrode system, which employed a platinum wire as the counter electrode, Ag/AgCl as the reference electrode, and the as-prepared photocatalysts served as working electrodes. The photocurrent intensity of the photocatalysis was measured at 0.0 V with the light on and off. Na2SO4 (0.1 M) was used as the supporting electrolyte for photocurrent measurements. A 300 W Xe lamp was utilized as a light source. The Nyquist plots were determined over the frequency range of 100–106 Hz with an ac amplitude of 10 mV at the open circuit.3. Results and discussion
The fabrication of the nanocomposite photocatalyst is depicted in Scheme 1. The UCNPs of NaLuF4:Gd,Yb,Tm@NaLuF4:Gd,Yb were first synthesized through a thermal decomposition method.33 A layer of amorphous SiO2 as the media shell was generated outside the UCNPs via a reverse microemulsion method.34 Ag NPs generated by the reduction of AgNO3 using sodium citrate as the reductant were immobilized on the surface of the SiO2 shell through a chemical affinity towards primary amines.35 The primary amine originally acted as a ligand coming from APTES, which was introduced during the synthetic process. The obtained composite nanoparticles of UCNPs@SiO2@Ag were immobilized on the surface of g-C3N4 through a hydrothermal treatment process to obtain the final product of the nanocomposite photocatalyst UCNPs@SiO2@Ag/g-C3N4.3.1. Structural and morphological characterization
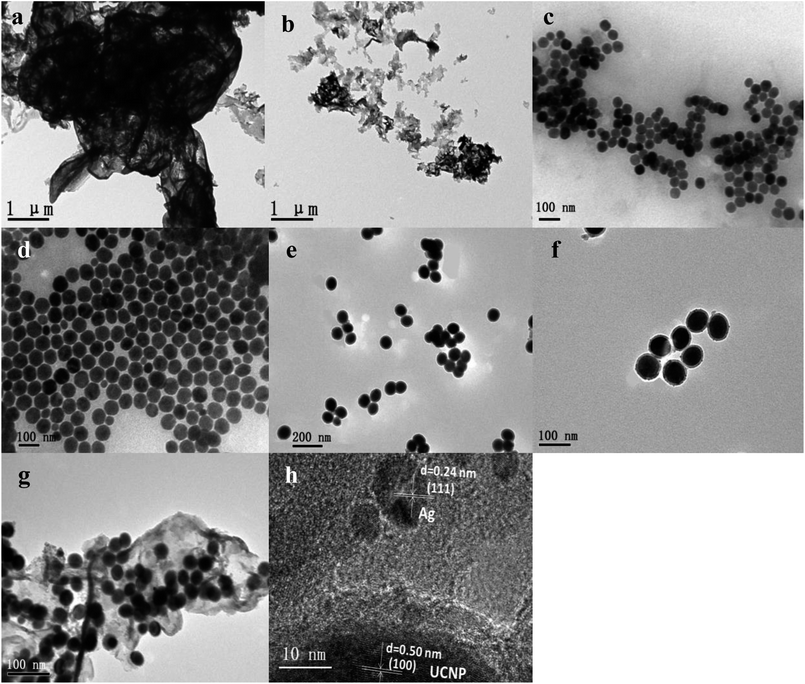
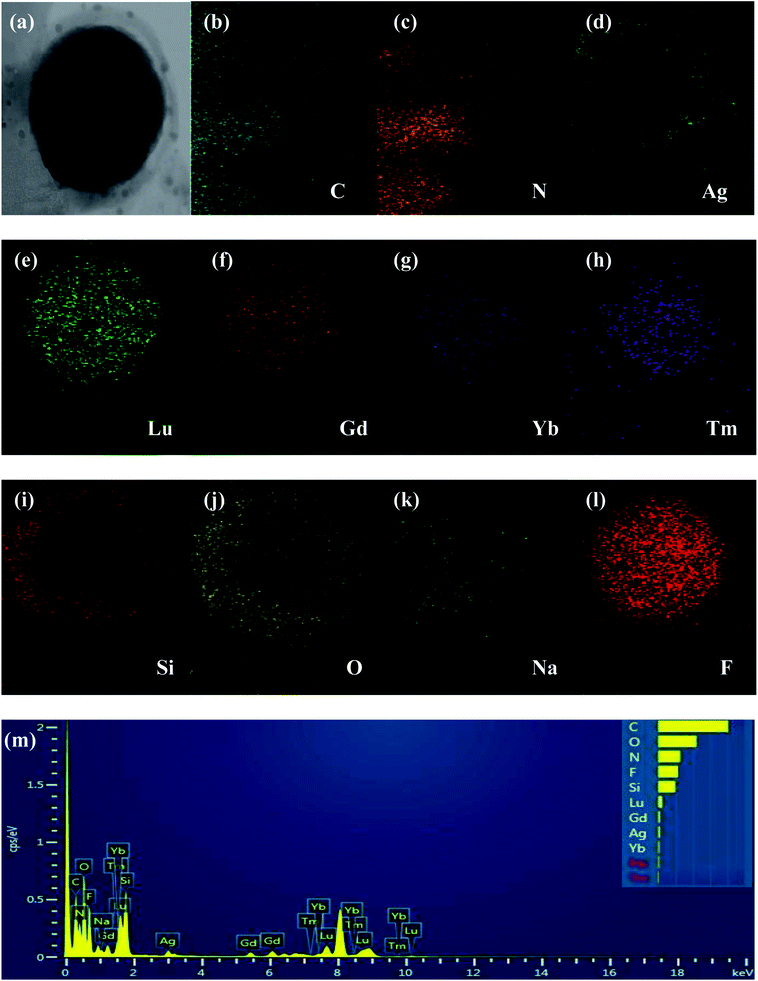
The UCNPs@SiO2@Xwt%Ag/g-C3N4 (X = 0, 1, 3, 5, and 10) photocatalysts were characterized by various instruments. All of the samples show a similar structure and morphology. Herein, the UCNPs@SiO2@3wt%Ag/g-C3N4 sample is used as an example to demonstrate the typical microstructure and morphology. The content of the Ag used in the sample for all studies, such as optical properties, structural and morphological, and photocatalytic, is the same as that of the 3 wt%.As shown in Fig. 1a and b, both bulk g-C3N4 and g-C3N4 nanosheets display wrinkled laminar morphologies. The size of the bulk g-C3N4 is several micrometers (Fig. 1a), while the g-C3N4 nanosheets have average diameters in the submicrometer and/or nanometer range (Fig. 1b). As shown in Fig. 1c and d, both the core UCNPs (NaLuF4:Gd,Yb,Tm) and core–shell UCNPs (NaLuF4:Gd,Yb,Tm@NaLuF4:Gd,Yb) are all hexagonal-phase crystals, with relatively uniform morphologies and sizes. The average diameters of the core and core–shell nanocrystals are 48 and 68 nm, respectively. Fig. 1e and f show that a light and smooth layer of SiO2 with thickness of about 10 nm is coated around the UCNPs to form UCNPs@SiO2 nanoparticles with uniform morphologies and sizes (Fig. 1e), and Ag NPs (about 6 nm) are attached to the surface of UCNPs@SiO2 to form UCNPs@SiO2@Ag nanoparticles (Fig. 1f). For the UCNPs@SiO2@Ag/g-C3N4 sample, the g-C3N4 nanosheets serve as a catalyst and the support of the UCNPs@SiO2@Ag nanoparticles. The UCNPs@SiO2@Ag nanoparticles retain their initial morphology after being immobilized on the surface of the g-C3N4 nanosheets. As shown in Fig. 1g, all of the UCNPs@SiO2@Ag nanoparticles are anchored to the g-C3N4 nanosheets, and no unanchored nanoparticles are observed. The HRTEM images of NaLuF4:Gd,Yb,Tm@NaLuF4:Gd,Yb and Ag NPs reveal the highly crystalline nature of the as-prepared products (Fig. 1h). The determined values of interplanar distances between adjacent lattice fringes are 0.50 and 0.224 nm, corresponding to (100) and (111) crystal planes of UCNPs and Ag nanoparticles,27 respectively. The measured lattice space (0.50 nm) of UCNPs in UCNPs@SiO2@Ag, corresponding to the (100) hexagonal phase crystal plane of UCNPs, demonstrates that the hexagonal phase structure of UCNPs remains unchanged after forming UCNPs@SiO2@Ag nanoparticles. EDX spectroscopy was applied to confirm the chemical composition of the as-prepared samples. As shown in Fig. 2, all of the elements including C, N, Si, O, Na, F, Lu, Gd, Yb, Ag, and Tm were detected in UCNPs@SiO2@Ag/g-C3N4, indicating that the exact ingredients were desirably built into the product. The elemental analysis of EDX mapping was further employed to identify the internal structure of UCNPs@SiO2@Ag/g-C3N4. It can be seen from Fig. 2b–l that the elements of C and N are distributed homogeneously in the nanosheet, while the elements of Na, F, Lu, Gd, and Yb are mainly distributed in the core–shell UCNPs (NaLuF4:Gd,Yb,Tm@NaLuF4:Gd,Yb). The elements of Si, O and Ag are mainly distributed in the outermost shell of NaLuF4:Gd,Yb,Tm@NaLuF4:Gd,Yb@SiO2, while the Tm is mainly distributed in the core. These results confirm the formation of core–shell–shell sandwich-structure nanoparticles of NaLuF4:Gd,Yb,Tm@NaLuF4:Gd,Yb@SiO2 and the final nanocomposite catalyst of NaLuF4:Gd,Yb,Tm@NaLuF4:Gd,Yb@SiO2@Ag/g-C3N4.
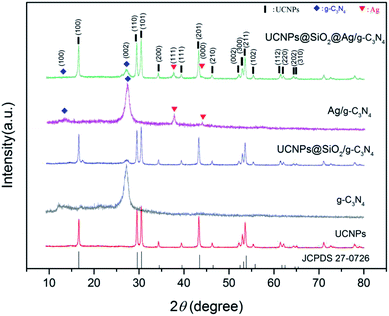
The crystal structures of the as-prepared samples were analyzed by XRD (Fig. 3). In the XRD pattern of g-C3N4, there are two prominent peaks at 13.1° and 27.4°, suggesting the presence of the phase pure g-C3N4 layered structure.36 The peak at 13.1° for the (100) diffraction plane and 27.4° for the (002) diffraction plane were derived from the in-plane structural packing of tri-s-triazine units and interplanar stacking of conjugated aromatic systems, respectively.25 The diffraction peak of the g-C3N4 at 27.4° also appeared in the UCNPs@SiO2/g-C3N4 (Fig. S1 in ESI†) and UCNPs@SiO2@Ag/g-C3N4 samples, indicating that the interplanar stacking structure of the g-C3N4 remained unchanged after it coupled with UCNPs. The samples of UCNPs, UCNPs@SiO2/g-C3N4, and UCNPs@SiO2@Ag/g-C3N4 show multiple characteristic diffraction peaks (100, 110, 101, 111, 200, 210, 002, 211, 112), which match well with the standard of β-NaLuF4 (JCPDS 27-0726).37 Both Ag/g-C3N4 and UCNPs@SiO2@Ag/g-C3N4 show a typical face-centered cubic phase of silver (JCDS 04-0783),38 confirming the formation of Ag NPs. All of the XRD results are in good agreement with the measured TEM results.
3.2. Optical properties
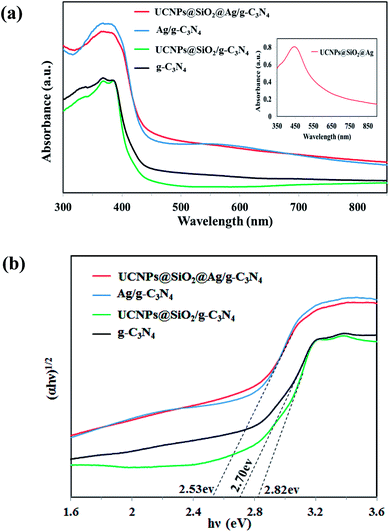
The photocatalytic activity of the photocatalysts is closely related to their light absorption ability and response range. For comparison of the optical properties, the UV-Vis-NIR diffuse reflectance spectra (DRS) of solid g-C3N4, 3 wt%Ag/g-C3N4, UCNPs@SiO2/g-C3N4, and UCNPs@SiO2@3wt%Ag/g-C3N4 were measured and shown in Fig. 4a. The g-C3N4 showed a strong intrinsic absorption band from the UV to the visible range with an absorption edge at 460 nm, which was caused by the excitation of electrons from the valence band to the conduction band of g-C3N4.10 The UCNPs@SiO2/g-C3N4 exhibited a comparative low absorption and a blue-shifted absorption edge relative to the g-C3N4. The low absorption can be assigned to the multiple light scattering effects and shielding effect caused by the silica layer and UCNPs.39 The blue-shifted absorption edge is due to the widening of the band gap energy of g-C3N4. As shown in Fig. 4b, the evaluated band gap energy of UCNPs@SiO2/g-C3N4 is 2.82 eV, which is larger than that of g-C3N4 (2.70 eV). After assembly with UCNPs, the UCNPs@SiO2/g-C3N4 presented a distinctive absorption band in the NIR region at about 980 nm, attributed to the 2F7/2 → 2F5/2 transition of the dopant Yb3+ ions in the UCNPs (Fig. S4 in ESI†).40 After introducing Ag NPs into the composite or g-C3N4, an obvious red-shift of the absorption edge, and an enhanced absorption of g-C3N4 in the entire range from UV up to red were observed. The enhanced absorption in the visible light region is mainly attributed to the surface plasmon resonance (SPR) absorption of Ag NPs.34 The red-shift of the absorption edge can be assigned to the narrowing of the band gap caused by the Ag nanoparticles. Ag, possessing a favorable Fermi level, can serve as a good electron acceptor. Therefore, the photogenerated electrons on the conduction band of g-C3N4 can quickly transfer to Ag NPs, resulting in a narrowing of the band gap of g-C3N4.41 As shown in Fig. 4b, the estimated band gap energies for g-C3N4, Ag/g-C3N4 and UCNPs@SiO2@Ag/g-C3N4 are 2.7, 2.53 and 2.53, respectively. The narrowing of the band gap is ascribed to the introduction of Ag nanoparticles. The optical absorption spectra for UCNPs@SiO2@Ag/g-C3N4 samples with different contents of Ag were also investigated. As shown in Fig. S5,† the light absorption increases with increasing Ag content due to the SPR absorption of Ag nanoparticles. Meanwhile, the red-shift of the absorption edge increases with increasing Ag content due to the narrowing of the band gap energies arising from the Ag nanoparticles. The additional absorption band centered at 550 nm for the Ag/g-C3N4 spectra is assigned to the SPR absorption of Ag nanoparticles, which can also be seen in UCNPs@SiO2@Ag/g-C3N4, but cannot be seen in g-C3N4 and UCNPs@SiO2/g-C3N4 due to the absence of Ag nanoparticles. The extinction spectrum of UCNPs@SiO2@Ag dispersed in water exhibits an absorption band in the wavelength range of 350–550 nm with a maximum absorption peak at 445 nm (Fig. 4a inset), corresponding to the SPR absorption of Ag NPs. Apparently, the SPR absorption, red-shift and enhanced absorption all over the spectral range, caused by Ag NPs, can greatly help the nanocomposite photocatalyst to harvest excitation light, leading to the much more efficient utilization of solar energy. This is a significant benefit to the improvement of the photocatalytic activity of the catalyst.The migration, transfer and recombination of electron–hole pairs in the interfaces of composite photocatalysts have great influence on the photocatalytic activity. PL spectra were used to investigate the behavior of the electron–hole pairs.6 Usually, a lower PL intensity of the photocatalyst indicates a lower recombination efficiency of electron–hole pairs.17 The PL spectra of pure g-C3N4, 3wt%Ag/g-C3N4, and UCNPs@SiO2@Xwt%Ag/g-C3N4 nanocomposites (X = 0, 1, 3, 5, 10) are shown in Fig. 5. The excitation wavelength of the PL spectra was set at 330 nm and all the samples display a similar band-to-band fluorescence emission, characteristic of g-C3N4. Two emission peaks located at 440 nm and 460 nm are observed in Fig. 5. The emission centered at 440 nm is caused by the transition between the δ* conduction band and the LP valence band, which is related to the sp2 C–N bond.42 The emission band centered at 460 nm is attributed to the transition between the π* conduction band and the LP valance band.42 It can be observed that g-C3N4 displays an intense fluorescence emission peak at 440 nm, while the PL intensity of other samples is much lower than that of g-C3N4. The strong fluorescence emission of g-C3N4 indicates a fast recombination of charge carriers, and the distinct fluorescence quenching of UCNPs@SiO2@Ag/g-C3N4 indicates an efficient inhibition in the recombination of charge carriers. This might be due to the accelerated separation process of electron–hole pairs associated with the Ag NPs. It is well known that the noble metal Ag can act as an effective electron acceptor and transporter, trapping the photogenerated electrons, thereby improving the separation of electron–hole pairs and inhibiting their recombination.43 In principle, the PL intensity of the nanocomposite would decrease with increasing Ag loading; however, the 3 wt% Ag loaded sample was found to display the lowest PL intensity. As the Ag loading increases to a certain degree, the Ag NPs aggregate on the surface and conversely work as recombination centers for charge carriers.44 As for Ag/g-C3N4 and UCNPs@SiO2@Ag/g-C3N4, the red-shift of the PL peak by Ag introduction reveals the narrowed bandgap relative to g-C3N4, which is in accord with the red-shift of the optical absorption edge, implying that the red-shift in the PL spectra is correlated to the red-shift of the optical absorption edge.
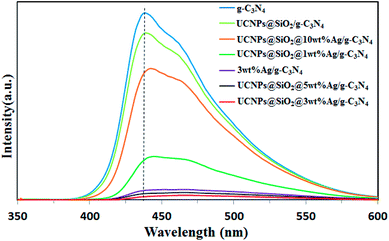 | ||
| Fig. 5 Photoluminescence spectra of g-C3N4, 3wt%Ag/g-C3N4, and UCNPs@SiO2@Xwt%Ag/g-C3N4 (X = 0, 1, 3, 5, 10) under 330 nm excitation. | ||
The UCNPs were employed to upconvert the NIR light into higher energy emissions in the UV and visible ranges, which are capable to excite the g-C3N4. As a crucial factor for the energy-transfer efficiency, the energy match between the emission of UCNPs and the absorption of g-C3N4 was investigated. The upconversion luminescence (UCL) spectra of the prepared samples under 980 nm excitation were measured and the results were shown in Fig. 6. The UCL intensities of the samples were measured at the same concentration of 2.0 mg mL−1 in ethanol. It can be seen that each of the samples shows a similar spectrum characteristic of the UCL of Tm3+. Two blue-emission peaks at 476 and 450 nm, and two peaks at 361 and 345 nm in the UV region correspond to the 1G4 → 3H6, 1D2 → 3F4, 1D2 → 3H6, and 1I6 → 3F4 transitions of Tm3+, respectively.45,46 A very weak UV emission peak at 310 nm originated from the 6P7/2→8S7/2 transitions of Gd3+ ions.47 As shown in Fig. 6, the emission intensities of the UCNPs are varied after coupling with SiO2, Ag, or g-C3N4. The luminescence intensity of UCNPs@SiO2 decreased to some extent in comparison to that of pure UCNPs due to the light scattering effects by the silica layer.39 Though the presence of the SiO2 shell leads to a small negative effect for the UCL intensity, the SiO2 shell can serve as an interface for Ag decoration as well as an isolating layer to prevent fluorescence quenching induced by energy transfer from UCNPs to the metal Ag.48,49 Moreover, this SiO2 layer can protect the UCNPs from the photocatalytically-induced corrosion to prolong their lifetime.50 As shown in Fig. 6, after loading Ag NPs, the UCL intensity of UCNPs@SiO2 was significantly enhanced, which is attributed to the metal-enhanced fluorescence (MEF) of Ag NPs.51 It is well known that noble metal nanoparticles can modulate the spectroscopic properties of nearby chromophores.52 MEF arises from the interaction between the fluorophore and SPR of noble metal nanoparticles.53 In our case, Ag NPs are located near the fluorophore of UCNPs. Induced by the SPR of Ag NPs, the local electric field in the proximity of Ag NPs drastically increases, which leads to the increase in the excitation rates of the UCNPs.54 In addition, the interaction between fluorophore and SPR of Ag NPs can increase the emission rate as well as emission intensity of the fluorophore (UCNPs) by surface plasmon-coupled emission (SPCE).22 As shown in Fig. 4 and 6, the SPR frequency of the Ag NPs overlaps well with the emission band of UCNPs, which permits an efficient SPCE. After the UCNPs@SiO2@Ag is coupled with g-C3N4, the UCL intensity decreases remarkably, indicating that the upconverted emission is absorbed by g-C3N4, resulting from efficient energy transfer from UCNPs to the g-C3N4. As shown in Fig. 4 and 6, the absorbance band of g-C3N4 in the whole UV-Vis range overlaps with all the emission bands of UCNPs, indicating an energy match between the emission of the UCNPs and the absorption of the g-C3N4, which leads to an efficient energy transfer between the UCNPs and g-C3N4.
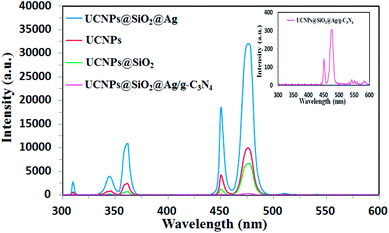 | ||
| Fig. 6 UCL spectra of UCNPs, UCNPs@SiO2, UCNPs@SiO2@Ag, and UCNPs@SiO2@3wt%Ag/g-C3N4 under 980 nm excitation. The inset is the enlarged view for UCNPs@SiO2@3wt%Ag/g-C3N4. | ||
3.3. Photoelectrochemical measurements
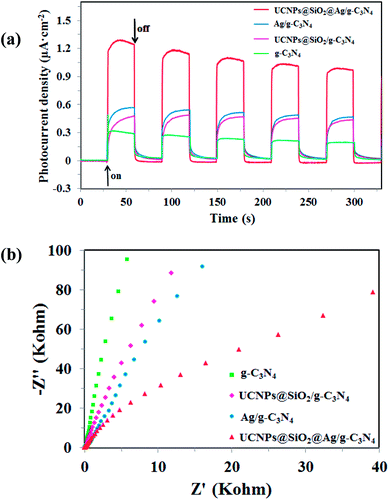
Photoelectrochemical measurements, including transient photocurrent responses and electrochemical impedance spectroscopy (EIS) of the obtained g-C3N4, UCNPs@SiO2/g-C3N4, Ag/g-C3N4, and UCNPs@SiO2@Ag/g-C3N4 samples are shown in Fig. 7. The saturation photocurrent densities remain constant with the light on, and immediately drop to nearly zero once the light is switched off (Fig. 7a). Both photocurrent densities of the Ag/g-C3N4 and UCNPs@SiO2/g-C3N4 are higher than that of pure g-C3N4. The increased photocurrent of Ag/g-C3N4 is ascribed to the Ag NPs, which facilitate the separation and prolong the lifetime of the photoinduced charge carries.43 The increased photocurrent density of UCNPs@SiO2/g-C3N4 as compared to the bare g-C3N4 is ascribed to the surface states of SiO2, which is favorable for the separation and transfer of electron–hole pairs of g-C3N4.55 The UCNPs@SiO2@Ag/g-C3N4 composites present the highest photocurrent response intensity, which is about 4.2-fold higher than that of bare g-C3N4, indicating a lower recombination rate of charge carriers and faster photogenerated electron migration on g-C3N4. The increased photocurrent confirms that the incorporation of Ag NPs can facilitate the separation and prolong the lifetime of the photogenerated charge carriers, which is essential for the enhanced photocatalytic activity of g-C3N4. As mentioned above (in Section 3.2), the Ag NPs can act as effective electron acceptors and transporters, trapping the photogenerated electrons, thereby improving the separation of electron–hole pairs and prolonging the lifetime of the photogenerated charge carriers.43 Moreover, due to the surface state of SiO2, it can facilitate the separation and transfer of photogenerated electron–hole pairs due to the fact that photogenerated electrons on the CB of g-C3N4 tend to be transferred to impurity energy levels of SiO2, prolonging the lifetime of the photogenerated charge carriers.55 The almost unchanged photocurrent response during repeated light on–off cycles implies the excellent stability of the as-prepared photocatalysts. Electrochemical impedance spectroscopy (EIS) is another available method for studying the charge transfer efficiency and interface reaction ability.56 Fig. 7b reveals the EIS Nyquist plots of the samples, which correspond to their charge transfer resistance. The smaller arc radius of the EIS Nyquist plot implies the lower impedance and faster interface charge transfer.57 The UCNPs@SiO2@Ag/g-C3N4 has the smallest arc radius of the EIS Nyquist plot, indicating that the UCNPs@SiO2@Ag/g-C3N4 possesses the lowest impedance and fastest interface charge transfer. The results are in accord with those obtained by the photocurrent measurement.3.4. Photocatalytic degradation of RhB
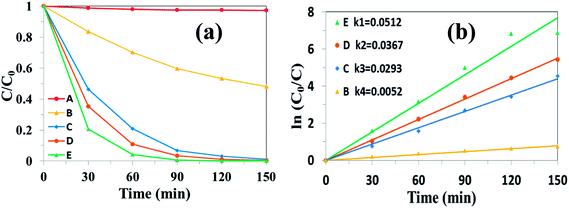
The photocatalytic properties of the as-prepared samples were evaluated firstly by the degradation of RhB under simulated solar light irradiation. Fig. 8 shows the absorbance spectra of RhB catalyzed by UCNPs@SiO2@Ag/g-C3N4 under simulated solar light irradiation as a function of the irradiation time. The intensity of the characteristic peak of RhB, positioned at 554 nm, gradually decreased with the increase of light irradiation time, indicating the degradation of RhB upon simulated solar light irradiation. The photocatalytic activity of the nanocomposite was evaluated by calculating the time-dependent degradation ratio of the RhB with the controls of g-C3N4, Ag/g-C3N4, UCNPs@SiO2/g-C3N4 and UCNPs@SiO2@Ag. Fig. 9a shows the time profile of C/C0 under stimulated solar light irradiation, where C is the concentration of RhB at the irradiation time and C0 is the concentration at adsorption equilibrium with the photocatalyst before irradiation. As shown in Fig. 9a, the photocatalytic efficiency of the UCNPs@SiO2@Ag/g-C3N4 nanocomposite is obviously higher than that of the controls, where RhB is completely degraded in the presence of UCNPs@SiO2@Ag/g-C3N4 after exposure under Xe lamp for 90 min. The rate constant of UCNPs@SiO2@Ag/g-C3N4 is about 10 times higher than that of bare g-C3N4 (Fig. 9b). No significant degradation of RhB was observed in the presence of UCNPs@SiO2@Ag, which implies that UCNPs or Ag cannot directly trigger the photocatalytic reaction, confirming the pivotal role of the g-C3N4 in the photocatalysis. After the g-C3N4 was integrated with UCNPs@SiO2 nanoparticles, its photocatalytic activity was distinctly enhanced, which can be ascribed to the function of UCNPs. The UCNPs can absorb NIR light and convert it into UV and visible light, which are reabsorbed by g-C3N4. By utilizing the UCNPs, NIR light can be absorbed and harvested indirectly by g-C3N4 to broaden the absorption region and consequently enhance the photocatalytic activity of g-C3N4.25 In addition, when the highly energetic UV photons produced by UCNPs are absorbed by the g-C3N4, it can drive the g-C3N4 to generate highly energetic charge carriers.22 These highly energetic charge carriers possess high oxidation–reduction abilities, resulting in high catalytic activity.23 As shown in Fig. 9b, the photocatalytic efficiency of UCNPs@SiO2@Ag/g-C3N4 is higher than that of UCNPs@SiO2/g-C3N4, and Ag/g-C3N4 is higher than that of g-C3N4, demonstrating that the Ag NPs present in the composite can result in the enhancement of photocatalytic activity. The Ag NPs play an important role in the composites. Firstly, the upconversion luminescence of UCNPs is enhanced by the presence of Ag NPs on the outer shell layer of UCNPs due to its metal-enhanced fluorescence effect,51 which can make better use of UCNPs as an upconversion luminescent center in the composite. Secondly, Ag NPs serve as effective electron acceptors and transporters,58 which can trap the photogenerated electrons of g-C3N4, thereby improving the separation of electron–hole pairs and inhibiting their recombination.59 Finally, the Ag NPs act as visible light harvesting components via the excitation of the SPR to enhance the light absorption ability of the composite.39,60 Notably, the photocatalytic degradation activity of the as-prepared nanocomposite is also higher than the various UCNPs-modified photocatalysts reported previously (Table S1 in ESI†).25,27,28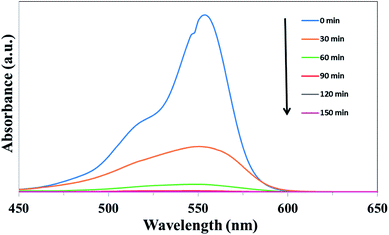 | ||
| Fig. 8 Time-dependent absorption spectra for the photocatalytic degradation of RhB over UCNPs@SiO2@Ag/g-C3N4 under simulated solar light irradiation. | ||
Considering that the amount of Ag loading may be an important factor in the photocatalysis, the dependence of the degradation efficiency of RhB on the amount of Ag loading (0–10 wt%) was studied further. As shown in Fig. S6 (ESI),† with the increase in Ag content, the photocatalytic efficiency of UCNPs@SiO2@Ag/g-C3N4 increases and reaches a maximum value for the 3 wt% Ag loaded sample. The rate constant of UCNPs@SiO2@3wt%Ag/g-C3N4 is about 2 times higher than that of UCNPs@SiO2/g-C3N4. Further increase in the Ag NPs loading (>3 wt%) causes a reduction in the photocatalytic efficiency. The defects introduced by excessive Ag NPs at the interface between Ag NPs and g-C3N4 can act as the recombination centers for charge carriers,6 which account for the presence of the optimal Ag loading amount.
The possible mechanism of photodegradation of RhB in the presence of the UCNPs@SiO2@Ag/g-C3N4 photocatalyst under simulated solar light irradiation is depicted in Fig. S7 (ESI).† To further confirm the contribution of the upconversion materials, a test of the photocatalytic degradation of RhB under NIR irradiation was performed. The obtained results are shown in Fig. S8.† Similar to the results obtained under simulated solar irradiation, the highest photocatalytic efficiency was also obtained by UCNPs@SiO2@3wt%Ag/g-C3N4, which is much higher than that of the controls. Since g-C3N4 or Ag NPs cannot be directly excited by the NIR light, no significant degradation of RhB was observed in the presence of UCNPs@SiO2@Ag, g-C3N4, and Ag/g-C3N4. These results further confirm the pivotal role of UCNPs for photocatalysis.
3.5. Detection of active species in the photocatalysis
For the in-depth investigation of the photodegradation mechanism of RhB, the radical capture experiments were performed. Generally, superoxide radicals (·O2−), hydroxyl radicals (·OH), and photogenerated holes (h+) are the acknowledged active species in the photocatalytic degradation of organic molecules.61 Therefore, trapping experiments were performed to identify the active species involved in this reaction system by using three different types of scavengers over the UCNPs@SiO2@Ag/g-C3N4 sample, namely, BQ (a quencher of ·O2−), t-BuOH (a quencher of ·OH), and Na2EDTA (a quencher of h+). Fig. 10 shows the photodegradation ratios of RhB in the presence of different scavengers under simulated solar light irradiation for 90 min. It was found that ∼100% RhB degradation was achieved without adding scavengers. However, the degradation ratio decreased significantly to 18.3% with the addition of BQ (1 mM), indicating that ·O2− is the major reactive species. Meanwhile, the addition of t-BuOH (1 mM) and Na2EDTA (1 mM) as scavengers was also found to inhibit the degradation ratio to 64.5% and 88.7%, respectively, which indicates that ·OH plays a more important role than h+ in the reaction. Therefore, the influence of the active species in the process of RhB photodegradation follows the trend ·O2− > ·OH > h+.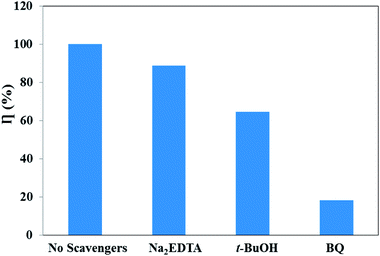 | ||
| Fig. 10 Photodegradation ratios of RhB over UCNPs@SiO2@3wt%Ag/g-C3N4 in the presence of different scavengers under simulated solar light irradiation. | ||
3.6. Photocatalytic hydrogen evolution and stability
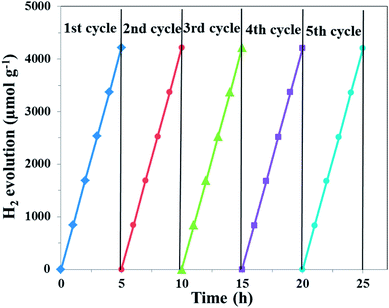
The photocatalytic hydrogen evolution ability of the samples was evaluated under simulated solar light irradiation, which is shown in Fig. 11. Compared with pure g-C3N4, the UCNPs@SiO2/g-C3N4 and 3wt%Ag/g-C3N4 nanocomposites showed higher hydrogen evolution rates of 319 and 507 μmol h−1 g−1, respectively. The highest photocatalytic hydrogen evolution rate of 873 μmol h−1 g−1 was realized with the UCNPs@SiO2@3wt%Ag/g-C3N4 nanocomposite, which was about 12 times higher than that of bare g-C3N4 (72 μmol h−1 g−1). The improved photocatalytic activity is mainly ascribed to the synergistic effect of UCNPs and Ag NPs, which results in a broad light-response range of g-C3N4 as well as the fast separation and slow recombination of the photoinduced electron–hole pairs. Interestingly, the photocatalytic H2 production activity of the UCNPs@SiO2@3wt%Ag/g-C3N4 is also higher than other previously reported photocatalysts involving upconversion materials (Table S2 in ESI†).62,63 In the recycling test of the UCNPs@SiO2@3wt%Ag/g-C3N4 nanocomposite for photocatalytic hydrogen evolution (Fig. 12), the hydrogen evolved per hour hardly decreased during each cycle. Moreover, in the five successive cycles, the catalytic effect of each period remained almost consistent, indicating that the photocatalyst is reusable and possesses excellent stability. The high performance and stability of the as-synthesized photocatalysts are beneficial to the large-scale application of photocatalysis in the field of energy and environment.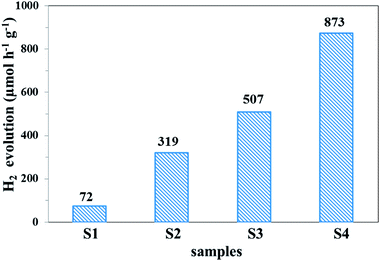 | ||
| Fig. 11 Hydrogen evolution rates of (S1) g-C3N4, (S2) UCNPs@SiO2/g-C3N4, (S3) 3wt%Ag/g-C3N4, and (S4) UCNPs@SiO2@3wt%Ag/g-C3N4 under simulated solar light irradiation (irradiation time = 5 h). | ||
3.7. Photocatalytic mechanisms of hydrogen evolution
To better understand the photocatalytic process, the possible mechanism of hydrogen evolution in the presence of the UCNPs@SiO2@Ag/g-C3N4 photocatalyst under simulated solar light irradiation is depicted in Fig. 13. The g-C3N4 is an n-type semiconductor with the redox potential of the conduction band (CB) and the valence band (VB) located at −1.3 eV and +1.4 eV vs. NHE,64 respectively. The substrate material of g-C3N4 can harvest UV and visible light shorter than 460 nm due to its intrinsic properties. The high penetrability of the NIR from the solar light is absorbed by the UCNPs of NaLuF4:Gd,Yb,Tm@NaLuF4:Gd,Yb to emit UV and visible light, which can subsequently be absorbed by g-C3N4. After absorbing the solar and upconverted light, the excited g-C3N4 generates electron–hole pairs. The Ag NPs with the Fermi level at +0.4 eV vs. NHE65 can act as an excellent electron reservoir that favors the electron transfer from the VB of g-C3N4 to the surface of Ag NPs. The electrons accumulate on Ag NPs to create a Schottky barrier that inhibits the recombination of the photogenerated electron–hole pairs. The strong local electromagnetic field induced by the SPR effect of Ag NPs can enhance the captured electron energy and transfer rate so that the electrons can react more easily with H+ for H2 production. Simultaneously, most of the holes are consumed by TEOA, promoting the separation of photogenerated charge carriers and producing more H+ to participate in the following reaction. Moreover, the SPR effect strengthens the sunlight harvesting capacity of the photocatalysts, resulting in the boosted generation rate of photogenerated charge carriers.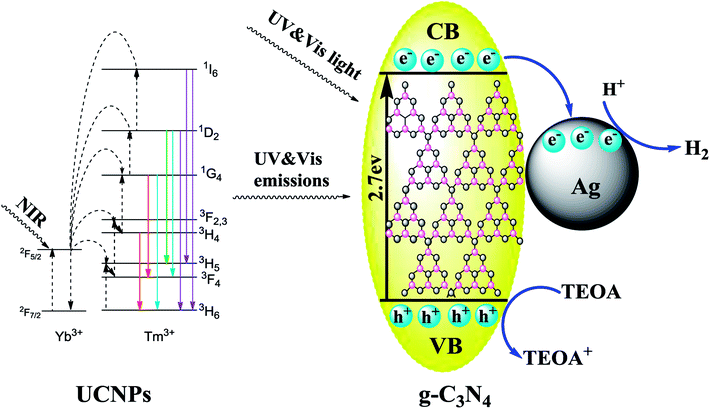 | ||
| Fig. 13 Schematic of the photocatalytic mechanism in the UCNPs@SiO2@Ag/g-C3N4 photocatalysts under simulated solar light irradiation. | ||
4. Conclusions
In this work, both upconversion and plasmonic effects were introduced into photocatalysis to gain a largely broadened light response range and fast separation of photoinduced electron–hole pairs. The UCNPs@SiO2@Ag/g-C3N4 composite photocatalysts with different Ag content were successfully designed and synthesized for the first time by subtly integrating UCNPs, Ag NPs and g-C3N4 nanosheets into a single nanoarchitecture. The as-prepared photocatalysts successfully used solar energy and restrained the recombination of charge carriers, showing exceptional activity in the photocatalytic degradation of RhB and hydrogen production as compared with plain g-C3N4. The effects of Ag loading on the photocatalytic properties of the catalyst were investigated and the photocatalytic mechanism was suggested. The present work offers a feasible strategy for designing and synthesizing high-performance photocatalysts by utilizing upconversion and plasmon-enhanced effects. The novel photocatalyst may have the potential for application in the removal of pollutants and hydrogen production in the future.Conflicts of interest
There are no conflicts to declare.Acknowledgements
The authors acknowledge the National Natural Science Foundation of China (No. 21271126), Program for Innovative Research Team in University (No. IRT 13078), and National 973 Program (No. 2010CB933901).References
- K. X. Li, Z. X. Zeng, L. S. Yan, S. L. Luo, X. B. Luo, M. X. Huo and Y. H. Guo, Appl. Catal., B, 2015, 165, 428–437 CrossRef CAS.
- Q. Li, N. Zhang, Y. Yang, G. Z. Wang and D. H. L. Ng, Langmuir, 2014, 30, 8965–8972 CrossRef CAS PubMed.
- M. Tahir, C. B. Cao, F. K. Butt, S. Butt, F. Idrees, Z. Ali, I. Aslam, M. Tanveer, A. Mahmood and N. Mahmood, CrystEngComm, 2014, 16, 1825–1830 RSC.
- K. Srinivasu, B. Modak and S. K. Ghosh, J. Phys. Chem. C, 2014, 118, 26479–26484 CrossRef CAS.
- D. J. Martin, P. J. T. Reardon, S. J. A. Moniz and J. W. Tang, J. Am. Chem. Soc., 2014, 136, 12568–12571 CrossRef CAS PubMed.
- Z. Zhu, Z. Y. Lu, D. D. Wang, X. Tang, Y. S. Yan, W. D. Shi, Y. S. Wang, N. L. Gao, X. Yao and H. J. Dong, Appl. Catal., B, 2016, 182, 115–122 CrossRef CAS.
- M. Koelsch, S. Cassaignon, C. T. T. Minh, J. F. Guillemoles and J. P. Jolivet, Thin Solid Films, 2004, 451, 86–92 CrossRef.
- H. Wang, X. Z. Yuan, H. Wang, X. H. Chen, Z. B. Wu, L. B. Jiang, W. P. Xiong and G. M. Zeng, Appl. Catal., B, 2016, 193, 36–46 CrossRef CAS.
- H. Wang, X. Z. Yuan, Y. Wu, G. M. Zeng, X. H. Chen, L. J. Leng and H. Li, Appl. Catal., B, 2015, 174, 445–454 CrossRef.
- A. Zada, M. Humayun, F. Raziq, X. L. Zhang, Y. Qu, L. L. Bai, C. L. Qin, L. Q. Jing and H. G. Fu, Adv. Energy Mater., 2016, 6, 1601190 CrossRef.
- C. Ye, J. X. Li, Z. J. Li, X. B. Li, X. B. Fan, L. P. Zhang, B. Chen, C. H. Tung and L. Z. Wu, ACS Catal., 2015, 5, 6973–6979 CrossRef CAS.
- Y. Wang, J. S. Zhang, X. C. Wang, M. Antonietti and H. R. Li, Angew. Chem., Int. Ed., 2010, 49, 3356–3359 CrossRef CAS PubMed.
- D. D. Zheng, C. Y. Pang, Y. X. Liu and X. C. Wang, Chem. Commun., 2015, 51, 9706–9709 RSC.
- Y. Shiraishi, Y. Kofuji, S. Kanazawa, H. Sakamoto, S. Ichikawa, S. Tanaka and T. Hirai, Chem. Commun., 2014, 50, 15255–15258 RSC.
- T. Xiong, W. L. Cen, Y. X. Zhang and F. Dong, ACS Catal., 2016, 6, 2462–2472 CrossRef CAS.
- D. Lu, G. K. Zhang and Z. Wan, Appl. Surf. Sci., 2015, 358, 223–230 CrossRef CAS.
- J. Y. Qin, J. P. Huo, P. Y. Zhang, J. Zeng, T. T. Wang and H. P. Zeng, Nanoscale, 2016, 8, 2249–2259 RSC.
- X. Xin, J. Y. Lang, T. T. Wang, Y. G. Su, Y. X. Zhao and X. J. Wang, Appl. Catal., B, 2016, 181, 197–209 CrossRef CAS.
- M. T. Song, Y. H. Wu, X. J. Wang, M. Q. Liu and Y. G. Su, J. Colloid Interface Sci., 2018, 529, 375–384 CrossRef CAS PubMed.
- G. Liu, Y. N. Zhao, C. H. Sun, F. Li, G. Q. Lu and H. M. Cheng, Angew. Chem., Int. Ed., 2008, 47, 4516–4520 CrossRef CAS PubMed.
- S. Lee, I. Cho and Y. Sohn, J. Nanosci. Nanotechnol., 2015, 15, 8362–8369 CrossRef CAS PubMed.
- C. C. Wang, K. L. Song, Y. Feng, D. G. Yin, J. Ouyang, B. Liu, X. Z. Cao, L. Zhang, Y. L. Han and M. H. Wu, RSC Adv., 2014, 4, 39118–39125 RSC.
- Y. N. Tang, W. H. Di, X. S. Zhai, R. Y. Yang and W. P. Qin, ACS Catal., 2013, 3, 405–412 CrossRef CAS.
- X. F. Li, H. Ren, Z. J. Zou, J. J. Sun, J. Y. Wang and Z. H. Liu, Chem. Commun., 2016, 52, 453–456 RSC.
- Q. Z. Zhang, J. J. Deng, Z. H. Xu, M. Chaker and D. L. Ma, ACS Catal., 2017, 7, 6225–6234 CrossRef CAS.
- Z. H. Xu, M. Quintanilla, F. Vetrone, A. O. Govorov, M. Chaker and D. L. Ma, Adv. Funct. Mater., 2015, 25, 2950–2960 CrossRef CAS.
- D. G. Yin, L. Zhang, X. Z. Cao, Z. W. Chen, J. X. Tang, Y. M. Liu, T. T. Zhang and M. H. Wu, Dalton Trans., 2016, 45, 1467–1475 RSC.
- D. G. Yin, F. F. Zhao, L. Zhang, X. Y. Zhang, Y. M. Liu, T. T. Zhang, C. L. Wu, D. W. Chen and Z. W. Chen, RSC Adv., 2016, 6, 103795–103802 RSC.
- F. Wang, T. T. Wang, J. Y. Lang, Y. G. Su and X. J. Wang, J. Mol. Catal. A: Chem., 2017, 426, 52–59 CrossRef CAS.
- T. T. Wang, J. Y. Lang, Y. J. Zhao, Y. G. Su, Y. X. Zhao and X. J. Wang, CrystEngComm, 2015, 17, 6651–6660 RSC.
- D. J. Martin, K. P. Qiu, S. A. Shevlin, A. D. Handoko, X. W. Chen, Z. X. Guo and J. W. Tang, Angew. Chem., Int. Ed., 2014, 53, 9240–9245 CrossRef CAS PubMed.
- P. Niu, L. L. Zhang, G. Liu and H. M. Cheng, Adv. Funct. Mater., 2012, 22, 4763–4770 CrossRef CAS.
- F. F. Zhao, D. G. Yin, C. L. Wu, B. Q. Liu, T. Chen, M. T. Guo, K. X. Huang, Z. W. Chen and Y. Zhang, Dalton Trans., 2017, 46, 16180–16189 RSC.
- P. Y. Yuan, Y. H. Lee, M. K. Gnanasammandhan, Z. P. Guan, Y. Zhang and Q. H. Xu, Nanoscale, 2012, 4, 5132–5137 RSC.
- J. W. Lee, M. R. Othman, Y. Eom, T. G. Lee, W. S. Kim and J. Kim, Microporous Mesoporous Mater., 2008, 116, 561–568 CrossRef CAS.
- Y. Y. Kang, Y. Q. Yang, L. C. Yin, X. D. Kang, L. Z. Wang, G. Liu and H. M. Cheng, Adv. Mater., 2016, 28, 6471–6477 CrossRef CAS PubMed.
- D. G. Yin, X. Z. Cao, L. Zhang, J. X. Tang, W. F. Huang, Y. L. Han and M. H. Wu, Dalton Trans., 2015, 44, 11147–11154 RSC.
- D. G. Yin, C. C. Wang, J. Ouyang, X. Y. Zhang, Y. Feng, K. L. Song, B. Liu, X. Z. Cao, L. Zhang, H. Y. Lin and M. H. Wu, ACS Appl. Mater. Interfaces, 2014, 6, 18480–18488 CrossRef CAS PubMed.
- P. Zhao, Y. H. Zhu, X. L. Yang, X. Jiang, J. H. Shen and C. Z. Li, J. Mater. Chem. A, 2014, 2, 16523–16530 RSC.
- S. Heer, K. Kömpe, H. U. Güdel and M. Haase, Adv. Mater., 2004, 16, 2102–2105 CrossRef CAS.
- Y. B. Wang, X. Zhao, D. Cao, Y. Wang and Y. F. Zhu, Appl. Catal., B, 2017, 211, 79–88 CrossRef CAS.
- B. B. Wang, Q. J. Cheng, L. H. Wang, K. Zheng and K. Ostrikov, Carbon, 2012, 50, 3561–3571 CrossRef CAS.
- H. H. Yin, K. Yu and C. Q. Song, ACS Appl. Mater. Interfaces, 2014, 6, 14851–14860 CrossRef CAS PubMed.
- E. Z. Liu, L. M. Kang, Y. H. Yang, T. Sun, X. Y. Hu, C. J. Zhu, H. C. Liu, Q. P. Wang, X. H. Li and J. Fan, Nanotechnology, 2014, 25, 165401 CrossRef PubMed.
- G. Chen, J. Damasco, H. Qiu, W. Shao, T. Y. Ohulchanskyy, R. R. Valiev, X. Wu, G. Han, Y. Wang, C. Yang, H. Ågren and P. N. Prasad, Nano Lett., 2015, 15, 7400–7407 CrossRef CAS PubMed.
- S. H. Tang, J. N. Wang, C. X. Yang, L. X. Dong, D. L. Kong and X. P. Yan, Nanoscale, 2014, 6, 8037–8044 RSC.
- Y. Chen, X. H. Yan, Q. Liu and X. F. Wang, J. Alloys Compd., 2013, 562, 99–105 CrossRef CAS.
- F. Zhang, G. B. Braun, Y. F. Shi, Y. C. Zhang, X. H. Sun, N. O. Reich, D. Y. Zhao and G. Stucky, J. Am. Chem. Soc., 2010, 132, 2850–2851 CrossRef CAS PubMed.
- D. M. Cheng and Q. H. Xu, Chem. Commun., 2007, 248–250 RSC.
- J. Kummerlen, A. Leitner, H. Brunner, F. R. Aussenegg and A. Wokaun, Mol. Phys., 1993, 80, 1031–1046 CrossRef.
- A. Camplon, A. R. Gallo, C. B. Harris, H. J. Robota and P. M. Whitmore, Chem. Phys. Lett., 1980, 73, 447–450 CrossRef.
- H. J. Chen, T. Ming, L. Zhao, F. Wang, L. D. Sun, J. F. Wang and C. H. Yan, Nano Today, 2010, 5, 494–505 CrossRef CAS.
- S. Eustis and M. A. El-Sayed, Chem. Soc. Rev., 2006, 35, 209–217 RSC.
- W. Wang, W. J. Huang, Y. R. Ni, C. H. Lu and Z. Z. Xu, ACS Appl. Mater. Interfaces, 2013, 6, 340–348 CrossRef PubMed.
- Q. Hao, X. X. Niu, C. S. Nie, S. M. Hao, W. Zou, J. M. Ge, D. M. Chen and W. Q. Yao, Phys. Chem. Chem. Phys., 2016, 18, 31410–31418 RSC.
- F. He, G. Chen, Y. G. Yu, S. Hao, Y. S. Zhou and Y. Zheng, ACS Appl. Mater. Interfaces, 2014, 6, 7171–7179 CrossRef CAS PubMed.
- X. F. Chang, S. B. Wang, Q. Qi, M. A. Gondal, S. G. Rashid, D. Y. Yang, M. A. Dastageer, K. Shen, Q. Y. Xu and P. Wang, Appl. Catal., B, 2015, 176, 201–211 CrossRef.
- H. Chen, F. Gao, R. He and D. X. Cui, J. Colloid Interface Sci., 2007, 315, 158–163 CrossRef CAS PubMed.
- D. G. Yin, L. Zhang, B. H. Liu and M. H. Wu, J. Nanosci. Nanotechnol., 2012, 12, 2248–2253 CrossRef CAS PubMed.
- D. G. Yin, B. H. Liu, L. Zhang and M. H. Wu, J. Biomed. Nanotechnol., 2012, 8, 458–464 CrossRef CAS PubMed.
- K. C. Christoforidis, T. Montini, E. Bontempi, S. Zafeiratos, J. J. D. Jaén and P. Fornasiero, Appl. Catal., B, 2016, 187, 171–180 CrossRef CAS.
- W. Gao, W. Y. Zhang and G. X. Lu, Appl. Catal., B, 2017, 212, 23–31 CrossRef CAS.
- J. W. Shi, J. H. Ye, L. J. Ma, S. X. Ouyang, D. W. Jing and L. J. Guo, Chem.–Eur. J., 2012, 18, 7543–7551 CrossRef CAS PubMed.
- M. Xu, L. Han and S. J. Dong, ACS Appl. Mater. Interfaces, 2013, 5, 12533–12540 CrossRef CAS PubMed.
- Y. X. Yang, Y. N. Guo, F. Y. Liu, X. Yuan, Y. H. Guo, S. Q. Zhang, W. Guo and M. X. Huo, Appl. Catal., B, 2013, 142, 828–837 CrossRef.
Footnotes |
| † Electronic supplementary information (ESI) available. See DOI: 10.1039/c8ra07901c |
| ‡ Feifei Zhao and Kyu Kyu Khaing are co-first authors. |
| This journal is © The Royal Society of Chemistry 2018 |


