 Open Access Article
High-performance quantum dot light-emitting diodes using chip-scale package structures with high reliability and wide color gamut for backlight displays†
Chun-Feng Lai *a,
Yu-Chien Tiena,
Hung-Chun Tongb,
Chang-Zhi Zhongb and
Yu-Chun Leeb
aDepartment of Photonics, Feng Chia University, No. 100, Wenhwa Road, Seatwen, Taichung 40724, Taiwan. E-mail: chunflai@fcu.edu.tw
bLextar Electronics Corp., Hsinchu Science Park, Hsinchu 30075, Taiwan
First published on 22nd October 2018
Abstract
High reliability and wide color gamut light-emitting diodes (LEDs) that use composite quantum dot films (CQDFs) protected by chip-scale package (CSP) structures are presented. CQDFs containing CdZnSeS/ZnS core–shell QDs and the K2SiF6:Mn4+ phosphors were mixed with silicone gel and used as color converters in the CSP QD-LEDs. The CSP QD-LEDs, used for backlight displays, transmitted through a color filter and exhibited ITU-R Recommendation BT.2020 of approximately 86% (a National Television System Committee value of 115%). Furthermore, we performed a long-term reliability analysis test on the CSP QD-LEDs for 2352 h to verify whether the optical performance of CSP QD-LEDs does not significantly degrade relative to that of a conventional plastic leaded chip carrier QD-LEDs. We implemented a highly reliable package technology that can protect the QDs, solve the moisture/oxygen problems in defective QD-LEDs, and produce a backlight source for display with a wide color gamut.
Introduction
With the evolution of display technology, people have come to demand true and saturated colors. Therefore, the specification pursued for liquid crystal display (LCD) is high color saturation, that is, wide color gamut display technology. Quantum dots (QDs), including the Cd-, InP-, and perovskite-based QDs, with excellent optical properties have shown great potential in next-generation displays owing to their tunable emission wavelength, narrow full width at half maximum (FWHM), high quantum efficiency, and high peak brightness.1–3 Therefore, QD light-emitting diodes (LEDs) have been widely proposed for use in backlight display as they offer the widest color gamut possible and an increased system efficiency. QD-film4 and QD-on-chip5 are two types of QDs used for displays. The QD-films, known as QD enhancement films, are commonly used on QD LCDs. The QD-on-chip consumes the least amount of QD material, and is the most economical and cost effective. In addition, the QD-on-chip could be compatible with current LED backlight modules without the optical system redesign.6 Unfortunately, the requirements of QD-on-chip in terms of lifetime and stability of QDs are much higher than those of other types because QDs are affected by moisture, oxygen, high flux density and high junction temperature of LEDs. Recently, chip-scale package (CSP) LEDs have been widely proposed for use in illumination applications because of their advantages over the commercial plastic leaded chip carrier (PLCC) package. However, CSP QD-LEDs have some advantages compared with the commercial PLCC package, including small volume, lead-free frame, and high luminous density.In this study, we propose for the first time the glass encapsulation of CSP QD-LEDs for the application on QD-on-chip type. Glass encapsulation for CSP QD-LEDs is used as an isolating layer to prevent moisture and oxygen damage on QDs. We developed a protective packaging technique for QDs, as a result of which CSP QD-LEDs can pass the inspection of long-term reliability analysis (RA) test. In addition, we discuss the fabrication and optoelectronic properties of the CSP QD-LEDs and their actual use for backlight displays. The CSP QD-LEDs exhibited high-reliability and high-performance optoelectronic properties.
Experimental section
Composite QD film prepared as a color converter
The composite QD film (CQDF) as a color converter combined with the narrow band of green QDs and red phosphors was used in this study for the implementation of wide color gamut displays. We synthesized green CdZnSeS/ZnS core–shell QDs according to the methods used in a previous report.7,8 The mean diameters of green QDs were measured to be approximately 14 nm using a scanning transmission electron microscope (STEM). The elements in the QDs were accurately analyzed by energy-dispersive X-ray spectroscopy (EDS) (Fig. S1†). The green QDs not only had dominant wavelength and FWHM (approximately 530 nm and 20.3 nm, respectively, Fig. S2(a)†) but also high quantum yields (QYs approximately 75%). Our green QDs exhibited optical properties comparable to those previously reported.7,8In addition, the red phosphors (K2SiF6:Mn4+, KSF) with five narrow emission peaks had the average peak wavelength centers at approximately 631 nm (Fig. S2(b)†).9 Furthermore, KSF phosphors with multiple emission peaks have been discussed at length in reported literature,9–11 including the electronic structure properties, synthesis methods, and luminescent properties. CQDF was prepared by homogenously mixing green QD powders, red KSF phosphors, and silicone (OE-6636) in a ratio of 1![[thin space (1/6-em)]](https://www.rsc.org/images/entities/char_2009.gif) :
:![[thin space (1/6-em)]](https://www.rsc.org/images/entities/char_2009.gif) 49
49![[thin space (1/6-em)]](https://www.rsc.org/images/entities/char_2009.gif) :
:![[thin space (1/6-em)]](https://www.rsc.org/images/entities/char_2009.gif) 50 by weight. Importantly, the amount of surface ligands of green QDs decrease during the purification process of solution-mixing method,12,13 which improved the dispersion of QDs in a silicone resin matrix. Therefore, the QYs of green QDs after ligand removal decreased from 75% to 70%. Then, the CQDFs were fabricated using the doctor blade coating (DBC) method. We used the DBC approach to ensure a uniform CQDF coating on the glass barrier layer. Glass and silicone resin, with high transmittance of over 90%, was then uniformly coated on the CQDF surface as the barrier layer. Finally, the silicone resin was thermally cured in an oven for the formation of a protective layer on the CQDF surface.
50 by weight. Importantly, the amount of surface ligands of green QDs decrease during the purification process of solution-mixing method,12,13 which improved the dispersion of QDs in a silicone resin matrix. Therefore, the QYs of green QDs after ligand removal decreased from 75% to 70%. Then, the CQDFs were fabricated using the doctor blade coating (DBC) method. We used the DBC approach to ensure a uniform CQDF coating on the glass barrier layer. Glass and silicone resin, with high transmittance of over 90%, was then uniformly coated on the CQDF surface as the barrier layer. Finally, the silicone resin was thermally cured in an oven for the formation of a protective layer on the CQDF surface.
CSP QD-LED preparation
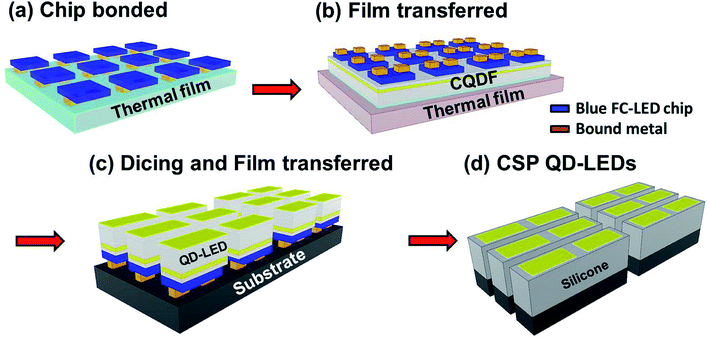
CSP QD-LEDs are based on GaN flip-chip (FC) LEDs. Blue FC-LEDs, with an emission wavelength of 444 nm and dimensions of approximately 8 mil × 47 mil, were used for the fabrication of the CSP QD-LEDs. The fabrication process for the CSP QD-LEDs was compatible with the LED processing equipment. The CSP QD-LEDs were manufactured as follows (Scheme 1).(a) We prepared an FC-LED, which contains a symmetric electrode and exhibits excellent transferability, and used it to obtain a high manufacturing yield. First, the FC-LEDs were bonded on poly(dimethylsiloxane) (PDMS) coated on a polyvinyl chloride (PVC) substrate as the thermal film (thermal release tape).14
(b) The as-fabricated FC-LEDs were peeled-off from the thermal film and transferred onto the CQDF substrate. CQDF with a barrier layer (Fig. 2(a)) was integrated into the FC-LED and then, the thermal film was released by heating at 60 °C.
(c) Once all the FC-LEDs were soldered onto the CQDF, the isolated QD-LEDs were subjected to chip dicing using a CO2 laser cutting machine, and then transferred again onto the substrate.
After ensuring that the chip pad of the QD-LEDs was fully in contact with the substrate, we applied the QD-LEDs to the backlight displays. A white silicone resin through compression molding was used for the insulation of the CQDFs from the environment. Finally, the CSP QD-LED substrates were diced to single light-emitting devices. Currently, the yield rate of the CSP QD-LEDs production line is as high as 80% with an input of 10![[thin space (1/6-em)]](https://www.rsc.org/images/entities/char_2009.gif) 000 LEDs per batch.
000 LEDs per batch.
Characterization
The morphologies of the CQDFs were observed using field-emission scanning electron microscopy (FESEM, S-4800, Hitachi). The element distribution of the CQDFs was detected by EDS. The size distribution of green CdZnSe/ZnS core–shell QDs was measured by STEM. The absolute photoluminescence quantum yields (QYs) were obtained using a Quanta-phi integrating sphere measurement system (F-3029, Horiba scientific). The luminous flux, luminous efficacy, CRI, CCT, and International Commission on Illumination (CIE) color chromaticity coordinates (x, y) of the white LEDs were measured using a 20 in-integration sphere with a radiometer and a photometer (CDS-610, Labsphere). The 3D-emitted photometric distribution images were taken using imaging spheres (ISLI, Radiant imaging). The reflectance spectrum of the silicone resin films was measured using a HR2000 + CG-UV-VIS-NIR spectrometer (Ocean Optics) with an optical resolution of 1.0 nm. Thermal conductivities were measured by a thermal image camera system (P384A3-20, Ching Hsing Instrument Co. Ltd.). The temperature and humidity test chamber (MHU 150LU, Terchy Environmental Technology Ltd.) was used by Lextar Electronics Corp. in Taiwan to conduct the reliability analysis test.Results and discussion
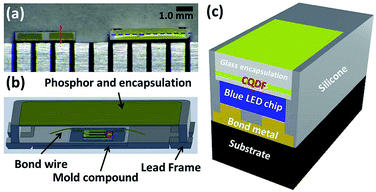
Structures of the different white LED types used in this study are shown in Fig. 1. Fig. 1(a) shows photographs of the top-view of CSP QD-LEDs and commercial 3806 PLCC LEDs, which are used for notebook display applications. CSP QD-LEDs (Fig. 1(c)) with encapsulate compared with the PLCC LEDs (Fig. 1(b)) were simplified by removing their lead frames (reduce thermal resistance), mold compounds (block moisture/oxygen), and bonding wires (high yield rate), that compared with the PLCC LEDs (Fig. 1(b)). Therefore, the CSP technique reduces the volume of CSP QD-LEDs by 60% compared with that of commercial 3806 PLCC packages and thus, they are suitable for the backlight modules of cellular phones and notebooks. Furthermore, CSP QD-LEDs containing CQDFs and glass encapsulation were developed. CSP QD-LEDs were fabricated using GaN-based blue FC-LED and varying amounts of green QD powder and red narrow band KSF phosphors mixed with a silicone encapsulant. Fig. 1(c) shows a schematic of the CSP QD-LEDs, which comprise a FC-LED dye and a light converting CQDF layer.CQDF contained CdZnSeS/ZnS core–shell QDs with narrow FWHM and narrow-band phosphors of KSF that were used as light converters in the CSP QD-LEDs. Fig. 2(a) exhibits a sandwich structure of CQDF, which is taking from the film transferred of CSP QD-LEDs fabrication process (Scheme 1). CQDF comprises three layers – one glass barrier layer and one silicone barrier layer sandwiching a layer of CQDF. We propose this design because QDs are very susceptible to high temperatures and need to be located away from the heat sources of FC-LEDs to maintain their quantum efficiency. Therefore, we used a thermal curable silicone resin coating on the CQDF; also, we used the DBC method to improve stability.15,16 The glass and silicone resin as an up and down barrier layer, respectively, was cured by heating. The permeation of moisture and oxygen into the CQDFs was prevented by embedding each of the CQDFs with glass barrier layers, as shown in Fig. 2(a). In addition, the glass barrier layer for CQDF is optically clear to pass light with high transmittance of over 93%. The CdZnSeS/ZnS core–shell QDs were analyzed by STEM (Fig. 2(b) and S1†). Moreover, different element distributions on the CQDF were also detected by EDS elemental mapping of the FESEM. The distribution area of each element was perfectly fitted with the EDS images (Fig. 2(c)). In addition, the QD and KSF particles were uniformly distributed on the CQDF without stacking on one side. The uniformity or non-uniformity of CQDF depended on the DBC fabrication process and machine parameters, and affected the color distribution of CSP QD-LEDs, as shown in Fig. S3.†
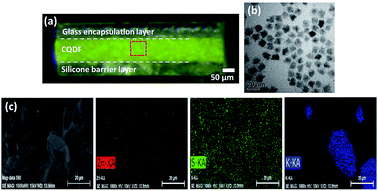 | ||
| Fig. 2 (a) Optical image of the cross-section of the CQDF structure. (b) STEM image of CdZnSeS/ZnS core–shell QDs. (c) FESEM image and EDS elemental mappings of Zn–K, S–K, and K–K in CQDF structures. | ||
We investigated the optical properties of the CSP QD-LEDs by characterizing their luminescence spectra, Commission Internationale De L'Elcairage (CIE) 1931 chromaticity coordinates, and luminous fluxes. A photometer and a radiometer with a 20 inch-integrating sphere system were used. The commercial PLCC LEDs were prepared using yellow Y3Al5O12:Ce3+ phosphors. The electroluminescence (EL) spectra of CSP QD-LEDs and commercial PLCC LEDs at an input power of 0.1 W at room temperature are shown in Fig. 3. In addition, color filters (CFs) also play an important role in the color gamut performance of LCD. The transmission spectra of commercial CFs are shown in the Fig. 3, which shows higher transmittance and larger overlap between the green/red and the blue/green regions, respectively. Therefore, only the luminescence spectra of white LEDs with a narrow FWHM are very close to the transmittance spectrum of CFs, and can obtain the higher Rec. 2020 (or NTSC) values. As shown in Fig. 3, the emission spectra of the green QDs and the red KSF phosphors have a narrow FWHM with high color purity that matches the color purity of commercial CFs. This strategy has demonstrated lower filtering losses and a wide color gamut for LCD. In this study, the spectrum of CSP QD-LEDs exhibited no color crosstalk with the overlapped CF spectrum in the green and red regions when compared with commercial PLCC LEDs (Fig. 3).
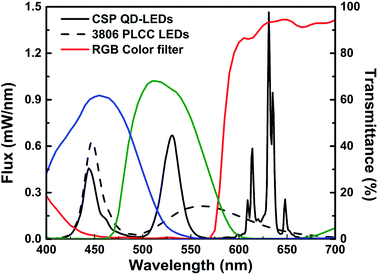 | ||
| Fig. 3 Luminescence spectra of CSP QD-LEDs and commercial PLCC LEDs. Inset shows the transmission spectra of commercial CFs. | ||
After CSP QD-LEDs were transmitted through CFs, the narrow linewidth of the green QD emission wavelength at 530 nm was well preserved, thus providing an increased color gamut. Recently, β-SiAlON:Eu2+-based narrow-band green phosphors have been developed and used for displays,17,18 but they have a FWHM passage of approximately 50 nm through CFs with higher filtering losses. Therefore, another strategy used combinations of narrow-band green phosphors and red QDs that only reach Rec. 2020 approximately 88% (NTSC-88%). Therefore, the current demand for green QDs is predominantly in display applications. Fig. S4† shows that the CIE 1931 color coordinates of CSP QD-LEDs and PLCC LEDs are (0.3023, 0.3414) and (0.3016, 0.2909) at correlated color temperatures (CCT) of 6939 K and 7828 K, respectively. The as-fabricated CSP QD-LEDs show a luminous flux of 11.9 lm, which is nearly equal to that of a commercial 3806 PLCC LED under the same operating power. Optoelectronic properties of the two types of white LEDs are summarized in Table 1.
| Sample [I@20 mA] | Luminous flux (lm) | CCT (K) | CIE coordinate (x, y) | ΔCCT (K) | NTSC coverage [%] | Rec. 2020 coverage (%) |
|---|---|---|---|---|---|---|
| CSP QD-LEDs | 11.9 | 6939 | (0.3023, 0.3414) | 546 | 114.5 | 85.6 |
| 3806 PLCC LEDs | 11.2 | 7828 | (0.3016, 0.2909) | 1003 | 82.2 | 61.5 |
The CSP QD-LEDs exhibited color uniformity, unlike commercial PLCC structures, because of the controllable package thickness of the top and sides.19–21 To inspect the color distribution of CSP QD-LEDs, we recorded the angular CCT with the imaging sphere for the luminous intensity measurement. Fig. 4(a) and (b) show the real photometric images of CSP QD-LEDs and commercial PLCC LEDs. The colors shown in the images are consistent with those shown in Fig. S4.† Fig. 4(c) shows the angular-dependent CCT values for the two types of LEDs with different packages at an operation power of 0.1 W. The angular CCT deviations (ΔCCT) of CSP QD-LEDs and PLCC LEDs were 546 K and 1003 K in the range of −80° to 80°. The CSP QD-LEDs demonstrated excellent color distribution uniformity in all angular ranges. The white silicone resin of the reflective sidewall of CSP QD-LEDs had high visible-light reflectance of over 90% (Fig. S5†), which improved the color uniformity of CSP QD-LEDs. The excellent color distribution uniformity was attributed to the reflective sidewall (side silicone resin) of the CSP, which reduced the amount of the side-emitted light (blue-ring effect).22,23 These results indicated that the CSP may have a potential in illumination applications that require high color uniformity.
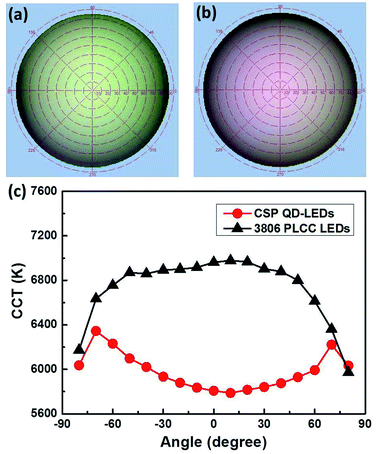 | ||
| Fig. 4 Real photometric images of (a) CSP QD-LEDs and (b) commercial PLCC LEDs. (c) Angle-dependent CCT values of CSP QD-LEDs and PLCC LEDs of white LEDs. | ||
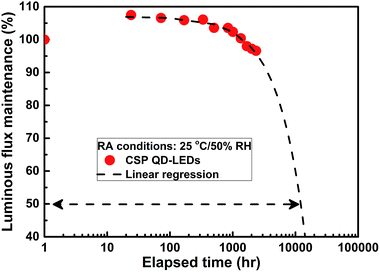
In this study, we also determined the thermal characteristics of CSP QD-LEDs.24–27 The surface working temperature of CSP QD-LEDs was measured after operating for 1 h, that is, once the device was thermally stable. In addition, the temperature controller of the active cooling system, set at different environment temperatures, was connected to the back of the substrates. A thermal image camera was used to evaluate the surface temperature of CSP QD-LEDs at different operating flux densities and substrate temperatures (Fig. 5). The surface working temperature of CSP QD-LEDs exhibited dependence on operating flux density and substrate temperature. The accelerated ageing testing (AAT) and long-term RA test,24,28,29 which were conducted by Lextar Electronics Corp. in Taiwan, were crucial for the application of QD-LEDs for backlight displays. Therefore, we performed a series of temperature, RH, and long-term life tests. First, we used the AAT method at temperature and RH of 60 °C and 90%, respectively, to evaluate the performance of CSP QD-LEDs with and without glass encapsulation under operating flux density of 15.8 W cm−2. The results in Fig. 6 exhibit the glass encapsulation significance of CSP QD-LEDs. Therefore, we used a different operating test environment to evaluate the long-term RA performance of CSP QD-LEDs.30 The CSP QD-LEDs at an operating flux density of 4.5 W cm−2 were subjected to the conditions of 25 °C and 50% RH, and the results indicate excellent stabilities (only 3% decay after 2352 h, Fig. 7). The life of CSP QD-LEDs was predicted under an operating flux density of 4.5 W cm−2 for 12![[thin space (1/6-em)]](https://www.rsc.org/images/entities/char_2009.gif) 000 h at 25 °C and 50% RH, according to the L50 life testing standards.
000 h at 25 °C and 50% RH, according to the L50 life testing standards.
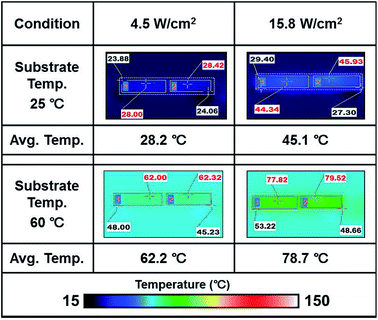 | ||
| Fig. 5 Real surface working temperature of CSP QD-LEDs at different operating flux densities and substrate temperatures. | ||
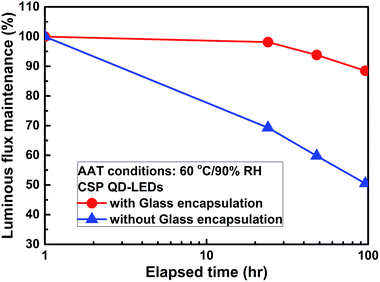 | ||
| Fig. 6 AAT of the stability of CSP QD-LEDs with and without glass encapsulation subjected to 60 °C/90% RH at an operating flux density of 15.8 W cm−2. | ||
In addition, the two types of QD-LEDs with different packages at operating flux density of 15.8 W cm−2 were also subjected to a temperature and RH of 25 °C and 50%, respectively. The results are shown in Fig. S6.† The CSP QD-LEDs exhibited a slight fluctuation, that is, an approximately 5% weak drift in lumen maintenance after 1008 h. The lumen maintenance of PLCC QD-LEDs decreased rapidly to 40% after 1008 h. The CSP QD-LEDs clearly demonstrated their ability to block moisture and oxygen, and are highly stable relative to PLCC QD-LEDs. The CSP LED structure provided an excellent glass barrier to protect the CQDF, resulting in the long-term stability of CSP QD-LEDs for backlight displays. However, the lifetime of CSP QD-LEDs will still decay because the water vapor transmission rate (WVTR) of a silicone resin is only approximately 16 g per m2 per day (operating at 40 °C/90% RH), which will cause the sidewall of QDEF to be damaged due to moisture and oxygen (Fig. S7†). Therefore, for the CSP QD-LEDs in fabricated in this study, we used glass encapsulation to protect the QDs because the glass exhibited an excellent WVTR (approximately 0 g per m2 per day) and a high visible-light transmittance of over 93%. Finally, both reliability and long-term stability of CSP QD-LEDs are enhanced significantly compared with those of commercial PLCC QD-LEDs. This novel packaging technique for QD materials can be effectively used for QD-LED fabrication to produce high-performance QD-LEDs.
We are the first group to successfully demonstrate the use of CSP QD-LEDs in 14 inch notebook displays using edge emission backlight that features a luminance of 150 nits while consuming power of only 1.5 W, as shown in Fig. 8(a). Edge emission backlight of LCD using CSP QD-LEDs has some advantages because the size of the CSP QD-LEDs is small, due to which ultra-thin, narrow border, and super low power QD-LCD can be developed. The displays using CSP QD-LEDs demonstrated by virtue of the narrow QD linewidths a much higher efficiency and lower energy consumption. A wide color gamut was measured, as shown in Fig. 8(b). The color coordinates of the CSP QD-LEDs were (0.3023, 0.3414) in the CIE 1931 chromaticity diagram, and their luminous flux was approximately 12 lm. For backlight display, the ITU-R Recommendation BT.2020 (Rec. 2020) or National Television System Committee (NTSC) value of the two types of white LEDs have also been measured, as listed in Table 1. The CSP QD-LEDs passed through the CFs for notebook LCD. The RGB CIE 1931 coordinates were (0.686, 0.306), (0.171, 0.751), and (0.150, 0.067) after the CSP QD-LEDs were transmitted through the CFs. The color gamut overlap of the Rec. 2020 was approximately 86% (and NTSC of 115%), which was higher than that of the commercially used 3806 PLCC LED (Rec. 2020 of 62% and NTSC value of 82%). QD-LEDs deliver up to 40% increase in color gamut compared with commercial white LEDs. Moreover, this is currently the only technology that puts us in the proximity of achieving Rec. 2020 color space. This result was attributed to the narrow FWHM spectra of the green QDs and the red KSF phosphors.31 CSP QD-LEDs were successfully developed for notebook backlight displays.
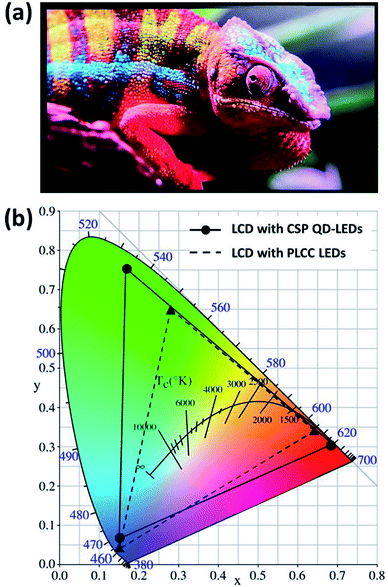 | ||
| Fig. 8 (a) Real image of LCD using CSP QD-LEDs for notebook backlight displays. (b) Color gamut of CSP QD-LEDs and PLCC LEDs used for notebook LCD. | ||
Conclusions
In summary, we demonstrated the novel CSP process of fabricating QD-LEDs that can be applicable for notebook backlight displays. CSP QD-LEDs were subjected to a RA test for 2352 h to verify that the optical performance of CSP QD-LEDs was not visibly degraded. The performance of CSP QD-LEDs improved significantly when compared with that of conventional PLCC QD-LEDs. Impressively, CSP QD-LEDs achieved excellent optoelectronic properties and transmitted through the CFs with a wide color gamut of Rec. 2020 standard for backlight displays of approximately 86%, which is significant for the future ultra-high definition display technology. We implemented a highly reliable package technology that can protect QDs, solve the moisture/oxygen problems of defective QD-LEDs, and fabricate a backlight source for displays with a wide color gamut.Conflicts of interest
There are no conflicts to declare.Acknowledgements
This study was supported by the Ministry of Science and Technology (MOST) in Taiwan, under contract numbers MOST106-2221-E-035-076, MOST106-2622-E-035-016-CC2, and MOST106-2622-E-035-010-CC3. The authors appreciate the Precision Instrument Support Center of Feng Chia University in providing the fabrication and measurement facilities.Notes and references
- S. Sadeghi, B. G. Kumar, R. Melikov, M. M. Aria, H. B. Jalali and S. Nizamoglu, Optica, 2018, 5, 793–802 CrossRef.
- D. C. Gary, M. W. Terban, S. J. L. Billinge and B. M. Cossairt, Chem. Mater., 2015, 27, 1432–1441 CrossRef CAS.
- H. C. Wang, S. Y. Lin, A. C. Tang, B. P. Singh, H. C. Tong, C. Y. Chen, Y. C. Lee, T. L. Tsai and R. S. Liu, Angew. Chem., Int. Ed., 2016, 55, 7924 CrossRef CAS PubMed.
- J. Chen, V. Hardev, J. Hartlove, J. Hofler and E. Lee, SID Symp. Dig. Tech. Papers, 2012, 43, 895–896 CrossRef.
- E. Jang, S. Jun, H. Jang, J. Lim, B. Kim and Y. Kim, Adv. Mater., 2010, 22, 3076–3080 CrossRef CAS PubMed.
- J. Kurtin, N. Puetz, B. Theobald, N. Stott and J. Osinski, SID Symp. Dig. Tech. Papers, 2014, 45, 146–148 CrossRef.
- K. H. Lee, C. Y. Han, H. D. Kang, H. Ko, C. Lee, J. Lee, N. S. Myoung, S. Y. Yim and H. Yang, ACS Nano, 2015, 9, 10941–10949 CrossRef CAS PubMed.
- A. O. Yalcin, B. Goris, R. J. A. Dijk-Moes, Z. Fan, A. K. Erdamar, F. D. Tichelaar, T. J. H. Vlugt, G. V. Tendeloo, S. Bals, D. Vanmaekelbergh, H. W. Zandbergen and M. A. Huis, Chem. Commun., 2015, 51, 3320–3323 RSC.
- H. F. Sijbom, R. Verstraete, J. J. Joos, D. Poelman and P. F. Smet, Opt. Mater. Express, 2017, 7, 3332–3365 CrossRef CAS.
- H. F. Sijbom, J. J. Joos, L. I. D. J. Martin, K. Van den Eeckhout, D. Poelman and P. F. Smet, ECS J. Solid State Sci. Technol., 2016, 5, R3040–R3048 CrossRef CAS.
- J. H. Oh, H. Kang, Y. J. Eo, H. K. Park and Y. R. Do, J. Mater. Chem. C, 2015, 3, 607–615 RSC.
- N. N. Trung, Q. P. Luu, B. T. Son, L. H. Sinh and J. Y. Bae, Polym. Compos., 2012, 33, 1785–1791 CrossRef CAS.
- C. S. Lee, B. Kim, S. Jeon, C. J. Han and S. K. Hong, Bull. Korean Chem. Soc., 2013, 34, 3787–3789 CrossRef CAS.
- D. Y. Kang, Y. S. Kim, G. Ornelas, M. Sinha, K. Naidu and T. P. Coleman, Sensors, 2015, 15, 23459–23476 CrossRef CAS PubMed.
- D. K. Yi, S. T. Selvan, S. S. Lee, G. C. Papaefthymiou, D. Kundaliya and J. Y. Ying, J. Am. Chem. Soc., 2005, 127, 4990–4991 CrossRef CAS PubMed.
- R. Kumar, H. Ding, R. Hu, K. T. Yong, I. Roy, E. J. Bergey and P. N. Prasad, Chem. Mater., 2010, 22, 2261–2267 CrossRef CAS.
- J. J. Joos, K. W. Meert, A. B. Parmentier, D. Poelman and P. F. Smet, Opt. Mater., 2012, 34, 1902–1907 CrossRef CAS.
- X. Zhang, H. C. Wang, A. C. Tang, S. Y. Lin, H. C. Tong, C. Y. Chen, Y. C. Lee, T. L. Tsai and R. S. Liu, Chem. Mater., 2016, 28, 8493–8497 CrossRef CAS.
- K. J. Chen, H. V. Han, H. C. Chen, C. C. Lin, S. H. Chien, C. C. Huang, T. M. Chen, M. H. Shih and H. C. Kuo, Nanoscale, 2014, 6, 5378–5383 RSC.
- Z. Liu, S. Liu, K. Wang and X. Luo, IEEE Photonics Technol. Lett., 2008, 20, 2027–2029 Search PubMed.
- H. C. Kuo, C. W. Hung, H. C. Chen, K. J. Chen, C. H. Wang, C. W. Sher, C. C. Yeh, C. C. Lin, C. H. Chen and Y. J. Cheng, Opt. Express, 2011, 19, A930–A936 CrossRef CAS PubMed.
- B. Fan, L. Yan, Y. Lao, Y. Ma, Z. Chen, X. Ma, Y. Zhuo, Y. Pei and G. Wang, Appl. Phys. Lett., 2017, 111, 072104 CrossRef.
- Z. Li, Y. Tang, J. Li, C. Wu, X. Ding and B. Yu, IEEE Photonics Technol. Lett., 2018, 30, 989–992 Search PubMed.
- C. F. Lai, J. S. Li and C. W. Shen, ACS Appl. Mater. Interfaces, 2017, 9, 4851–4859 CrossRef CAS PubMed.
- B. Xie, H. Liu, R. Hu, C. Wang, J. Hao, K. Wang and X. Luo, Adv. Funct. Mater., 2018, 28, 1801407 CrossRef.
- H. Zheng, X. Lei, T. Cheng, S. Liu, X. Zeng and R. Sun, Nanotechnology, 2017, 28, 265204 CrossRef PubMed.
- X. Luo, R. Hu, S. Liu and K. Wang, Prog. Energy Combust. Sci., 2016, 56, 1–32 CrossRef.
- Z. Chen, Q. Zhang, K. Wang, X. Luo and S. Liu, J. Semicond., 2011, 32, 014007 CrossRef.
- M. Meneghini, A. Tazzoli, G. Mura, G. Meneghesso and E. Zanoni, IEEE Trans. Electron Devices, 2010, 57, 108–118 CAS.
- Y. Fu, D. Kim, W. Jiang, W. Yin, T. K. Ahn and H. Chae, RSC Adv., 2017, 7, 40866–40872 RSC.
- J. He, H. Chen, H. Chen, Y. Wang, S. T. Wu and Y. Dong, Opt. Express, 2017, 25, 12915–12925 CrossRef CAS PubMed.
Footnote |
| † Electronic supplementary information (ESI) available: EDS spectrum of CdZnSeS/ZnS core–shell QDs. CIE chromaticity diagrams of the CSP QD-LEDs and commercial PLCC LEDs. RA test of the long-term stability of two types of QD-LEDs with different packages. See DOI: 10.1039/c8ra07928e |
| This journal is © The Royal Society of Chemistry 2018 |

