 Open Access Article
A novel approach to iron oxide separation from e-waste and bisphenol A detection in thermal paper receipts using recovered nanocomposites†
Muthumariappan Akilarasan‡
a,
Sakthivel Kogularasu‡a,
Shen-Ming Chen *a,
Tse-Wei Chena and
Bih-Show Lou*bc
aDepartment of Chemical Engineering and Biotechnology, National Taipei University of Technology, No. 1, Section 3, Chung-Hsiao East Road, Taipei 106, Taiwan. E-mail: smchen78@ms15.hinet.net; Fax: +886 2270 2523; Tel: +886 2270 17147
bChemistry Division, Center for General Education, Chang Gung University, Taoyuan, Taiwan. E-mail: blou@mail.cgu.edu.tw; Fax: +886 3211 8700; Tel: +886 3211 8800
cDepartment of Nuclear Medicine and Molecular Imaging Center, Chang Gung Memorial Hospital, Taoyuan, Taiwan
First published on 29th November 2018
Abstract
To promote sustainability, the effective reutilization of electronic waste and profitable recovery of valuable materials from e-scrap are essential. A recent report showed that 500 million printer cartridges enter landfill annually, creating immense interest in establishing a facile recovery method for transforming waste toner into a ferrous resource. Furthermore, the European Union and US Food and Drug Administration have published guidelines concerning bisphenol A (BPA) use in the manufacture of thermal paper receipts. Accordingly, in this study, BPA levels in thermal receipts collected from various stores in Taiwan were detected by glassy carbon electrodes fabricated using graphene oxide-recovered Fe3O4 nanocomposites.
1. Introduction
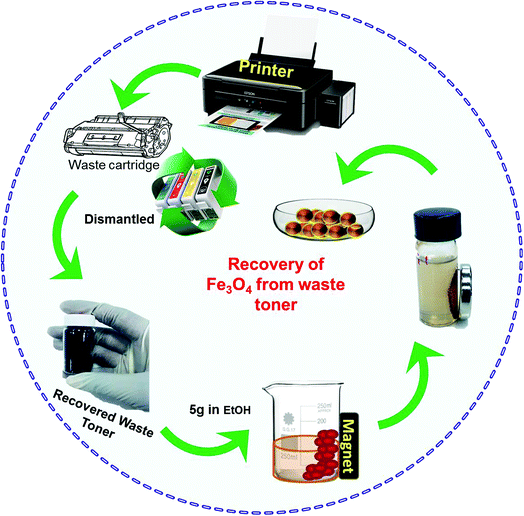
The everyday use of electronic devices and rapid recent technological expansion have led to the production of enormous amounts of electronic waste (e-waste).1–3 Many electronic devices, such as printers, fax machines, and photocopiers, use toner cartridges to print documents. A recent report from the “Inkjet Remanufacturers Association” stated that 1.1 billion cartridges were sold annually, with 500 million cartridges entering landfill internationally.4–6 Those discarded cartridges contain nearly 8% of the fresh toner content, which can leak out and contaminate water sources.7 To avoid this e-waste, we have developed a facile recovery method using magnetic separation followed by calcination to convert waste toner into an excellent ferrous resource.Meanwhile, endocrine disruptor bisphenol A (BPA), normally used as a key component in the polythene production,8 is hazardous to certain hormones and can adversely affect metabolism.9–11 A recent study of the effects of BPA on pregnant women showed that even trace BPA levels can move across the placenta and damage the embryo in utero.12 BPA also poses health risks such as childlessness,13,14 damage to the central nervous system,15,16 and behavioral variation.17,18 Therefore, following a prolonged study on BPA toxicity, in February 2018 the European Union and US Food and Drug Administration (FDA) publishing guidelines to prohibit BPA use as a component in thermal paper manufacture.19–22 Accordingly, our research group collected thermal receipt paper from various stores in Taiwan, including 7-Eleven, Family Mart, PX Mart, OK Mart, Hi-Life, and KFC, as well as ATM receipts, to determine their constituent BPA levels. A standardized HPLC-UV detection method was used to detect the BPA levels in thermal receipt samples prepared using migration and digestion techniques. Surprisingly, high BPA levels were found in the collected thermal receipts. This inspired our research group to establish a trace level BPA detector. Recently, Fe3O4 was reported as an active participant in the selective detection of BPA,23,24 while graphene oxide (GO) sheets have also been shown to improve the sensing capability of BPA detection.25,26
Herein, Fe3O4 nanoparticles recovered from toner were sonicated with GO nanosheets to obtain a GO–Fe3O4 composite, which was then fabricated onto a glassy carbon electrode (GCE). Owing to a large synergetic effect,26 electron transfer between BPA and the electrode surface was improved by GO–Fe3O4, resulting in selective and stable sensing. As expected, the sensor showed superior analytical parameters against lab samples. Therefore, the prepared sensor was employed for selective and sensitive detection of BPA in real thermal receipt samples.
2. Experimental
2.1 Chemicals
BPA, butyl acetate, and ethanol were purchased (see ESI, S1†) and used as received. Electrochemical studies were conducted using 0.1 M phosphate buffer (pH 7) as the supporting electrolyte. The preparation of electrolytes, chemical consumption, and equipment used are described in the ESI (S1†).2.2 Extraction and purification of Fe3O4
Initially, discarded cartridges were dismantled to recover the waste toner inside (Scheme 1). As-obtained toner (5 g) was dissolved in ethanol (50 mL) in a beaker with a magnet attached to the side and stirred vigorously with a glass rod. When stirring was stopped, some material had settled near the magnet, while the rest remained moving in solution. The supernatant was decanted and the same stirring procedure was repeated with fresh solvent, followed by decanting again. The magnetically separated powder was collected, finely ground, dissolved in butyl acetate (15 mL), and stirred for 30 min to remove impurities inside the lumps of toner. The solution was centrifuged several times with ethanol and dried in an oven at 90 °C for 7 h. Finally, the resulting dried powder was calcined at 500 °C for 2 h. The recovered material was placed under 5% H2/Ar flowing at 40 mL min−1 and heated from 50 °C to 500 °C at a rate of 10 °C min−1. The resulting powder was further characterized.2.3 Preparation of GO–Fe3O4 composite
To prepare the GO–Fe3O4 composite, Fe3O4 (1 mg) was added to GO dispersion (2 mL, 1 mg mL−1) in 45% ethanol and magnetically stirred for 15 min. The resulting mixture was ultrasonicated for another 15 min, which ensured sufficient interfacial self-assembly of negative GO sheets on positively charged Fe3O4 via electrostatic interactions, resulting in a stable network of Fe3O4 encapsulated by thin layers of GO.3. Results and discussion
3.1 Structural and elemental characterization
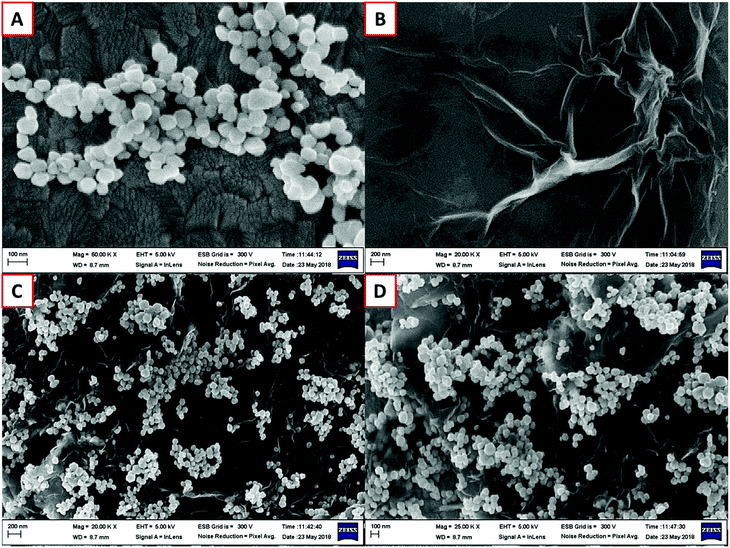
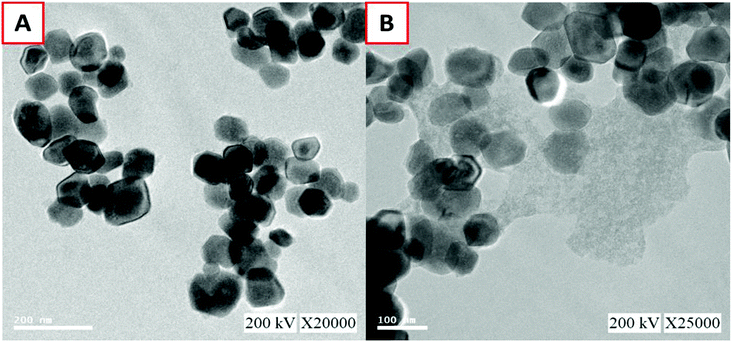
Morphological and structural information for the recovered Fe3O4, graphene oxide, and GO–Fe3O4 composite were obtained using FE-SEM. The size of recovered Fe3O4 was determined using the particle size distribution plot (Fig. S4†) and scaled to a mean size of 109 nm, as shown in Fig. 1A. Fig. 1B shows the thin GO sheets. Our previously reported procedure was used to prepare GO,27 which was then ultrasonicated with the recovered Fe3O4 nanoparticles to obtain the composite, as shown in Fig. 1C and D, with different magnifications. The fine thin GO sheets enveloped each of the recovered spheres, as also confirmed using TEM (Fig. 2A and B). Elemental detection of the recovered ferrous material was conducted to determine the presence of impurities, as detailed in the ESI (S2†).Fig. 3A shows the survey spectrum of the GO–Fe3O4 composite. Characteristic O 1s, C 1s, Fe 2p, and Fe 3p peaks were identified. The drastic increase in the O 1s and C 1s intensities was due to the presence of graphene oxide, which covered the surface of recovered Fe3O4. Fig. 3B shows the Fe 2p spectrum of GO–Fe3O4, in which the peaks at 710.2 and 724.9 eV are assigned to Fe 2p3/2 and Fe 2p1/2, respectively, which confirmed that the particles recovered from waste toner were Fe3O4 nanoparticles.28 The small peak at 720 eV, found between those of Fe 2p3/2 and Fe 2p1/2, indicated the presence of smaller amounts of Fe2O3.28 The inset of Fig. 3B shows that the Fe 2p3/2 peak was well fitted with two deconvoluted peaks at around 712 eV and 710 eV, which were attributed to Fe3+ (major) and Fe2+ (minor), respectively.29 Therefore, the presence of Fe3O4 was confirmed by XPS analysis.
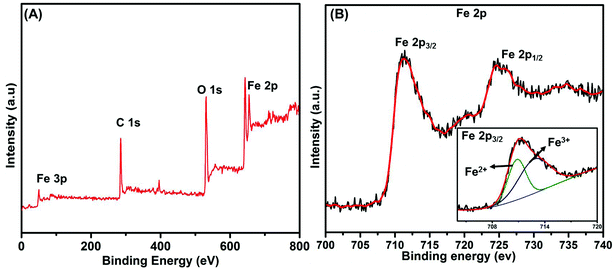 | ||
| Fig. 3 (A) Survey spectrum of Fe3O4/GO, and (B) high-resolution spectrum of Fe 2p (inset: deconvoluted peaks of Fe 2p3/2). | ||
The XRD pattern of recovered Fe3O4 nanoparticles is shown in Fig. S3,† which shows the characters of Fe3O4 nanoparticles with distinct crystallinity. Overall, the diffraction peaks correlated well with characteristic peaks of the Fe3O4 inverse spinel structure (PCPDFWIN v.2.02, PDF no. 89-0691). No obvious impurity peaks were found in the diffraction pattern.
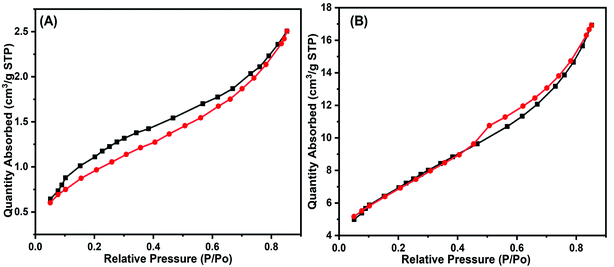
Fig. 4A and B show the BET surface analysis of Fe3O4 and GO–Fe3O4. Both materials had type 1 isotherms. The BET surface areas were found to be 4.3924 m2 g−1 for Fe3O4 nanoparticles and 25.2086 m2 g−1 for GO–Fe3O4.
3.2 Electrocatalytic properties of Fe3O4- and GO–Fe3O4-modified GCEs
The electrochemical kinetics of different electrodes were investigated using the ([Fe(CN)6]3−/4−) redox probe. Fig. 5A shows the CVs of unmodified GCE, GO/GCE, Fe3O4/GCE, and Fe3O4/GO/GCE containing 0.05 M of [Fe(CN)6]3−/4− at a scan rate of 0.05 V s−1. Compared with the other modified electrodes Fe3O4/GO/GCE showed an excellent redox peak, good electrochemical conductivity, and tolerable peak-to-peak potential separation (ΔEp). The calculated ΔEp values of bare GCE, GO/GCE, Fe3O4/GCE, and Fe3O4/GO/GCE were 145, 123, 84, and 52 mV, respectively. The cathodic to anodic peak current ratio (Ipc/Ipa) of Fe3O4/GO/GCE was 0.98, which is close to 1, confirming that the reaction is reversible. Furthermore, the Ipc/Ipa ratios of unmodified GCE, GO/GCE, and Fe3O4/GCE were 0.91, 0.93, and 0.95, respectively. The electroactive surface area (EASA) of the recovered material and its composites were measured using the Randles–Sevcik equation (eqn (1)).30,31 Meanwhile, by altering the scan rates, the kinetics in the [Fe(CN)6]3−/4− system were investigated (Fig. 5B).| Ip = 2.69 × 10⁵n3/2AD1/2Cv1/2 | (1) |
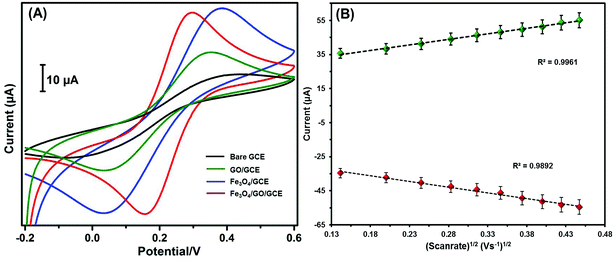 | ||
| Fig. 5 (A) CVs of bare GCE, GO/GCE, Fe3O4/GCE and Fe3O4/GO/GCE in 0.1 M KCl containing 5 mM [Fe(CN)6]3−/4−, and (B) Fe3O4/GO/GCE calibration plot of Ipc/Ipa vs. v1/2. | ||
The EASA values of bare GCE, GO/GCE, Fe3O4/GCE, and Fe3O4/GO/GCE were calculated as 0.082, 0.119, 0.166, and 0.193 cm2, respectively, from the slope of Ipa vs. v1/2. Furthermore, CV studies observed at different scan rates elucidated the pseudocapacity of Fe3O4/GO/GCE. The greater charge diffusion polarization of the recovered Fe3O4/GO/GCE was indicated by the increased peak current.
3.3 Voltammetric response of modified electrodes towards BPA
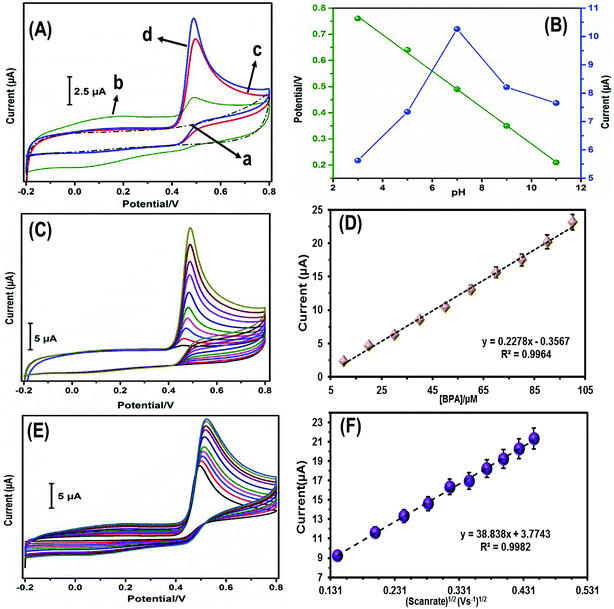
The electrochemical sensing behavior of different modified electrodes towards BPA oxidation was evaluated in 0.1 M phosphate buffer solution (PBS) at a scan rate of 0.05 V s−1. Fig. 6A shows the CVs of bare GCE, GO/GCE, Fe3O4/GCE, and Fe3O4/GO/GCE with BPA (50 μM) in 0.1 M PBS. No oxidation peak current was observed for the unmodified GCE. Furthermore, the oxidation peak current value observed for Fe3O4/GO/GCE was notable among the other modified electrodes. This confirmed that the Fe3O4/GO/GCE modified electrode had a higher peak current response and more capable active electron transmission movement than the other modified electrodes. A possible electrochemical oxidation mechanism of BPA is shown in eqn (2).
 | (2) |
3.4 Effect of pH on Fe3O4/GO/GCE
To determine the ideal pH for BPA detection by Fe3O4/GO/GCE, the electrochemical oxidation of BPA was conducted in different buffer solutions (pH 3–11) and the changes in oxidation peak current with changing pH were plotted. Fig. 6B-blue shows the graphical plot for pH vs. obtained current, evidently showing the most intense oxidation peak current at pH 7. The linearity of BPA detection was confirmed by the peak potential (Ep) plot, as shown in Fig. 6B-green. The acquired slope value for BPA (−53.2 mV) was near to the value mentioned in the Nernst equation,32 which confirmed that the same number of protons and electrons were involved in the reduction mechanism on Fe3O4/GO/GCE.3.5 Electrochemical performance of Fe3O4/GO/GCE towards BPA
Fig. 6C shows the CVs of Fe3O4/GO/GCE obtained with increasing BPA concentration (10–100 μM) at a scan rate of 0.05 V s−1 in 0.1 M PBS. The outstanding oxidation peak current intensified with increasing BPA concentration. The linear plot of oxidation peak current vs. BPA concentration is shown in Fig. 6D. The linear regression equation was calculated to be Ipa (μA) = 0.2278 − 0.3567c (μM), R2 = 0.9964.CVs were recorded for Fe3O4/GO/GCE in 0.1 M PBS containing BPA (50 μM) at different scan rates (20–200 mV s−1), as shown in Fig. 6E. Increasing the scan rate resulted in a linear increase in the anodic and cathodic peak currents. The calibration plot of the square root of scan rate vs. oxidation peak current is shown in Fig. 6F. The linear regression equation was calculated as Ipa (μA) = 38.838 + 3.7743 and the correlation coefficient was 0.9982, indicating that the reaction was a surface-confined process.
3.6 Amperometric detection of BPA
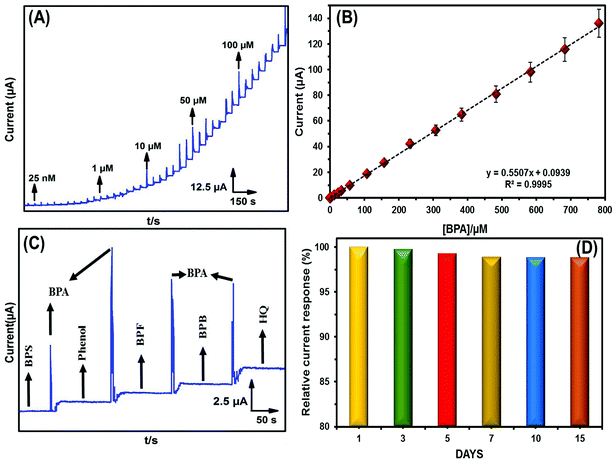
To define the analytical efficacy of GO–Fe3O4, amperometric-it was executed for BPA detection. As shown in Fig. 7A, as the BPA concentration was increased from 0.025 μM to 100 μM, the oxidation peak current increased linearly without any larger vacillations (Fig. 7B). Therefore, GO–Fe3O4 was suitable for the trace level detection of BPA. This yielded a wider linear range of 25 nM to 782.75 μM, with a very low detection limit of 6.9 nM. The sensitivity towards BPA was calculated as 2.62238 μA μM−1 cm−2. Therefore, GO–Fe3O4 has superior parameters, which are necessary for an effective sensor. Finally, the linear range and LOD were compared with previously reported BPA sensors (Table 1), with the GO–Fe3O4 modified electrode showing excellent sensing properties toward BPA detection. As a control study, GO was fabricated onto a GCE instead of GO–Fe3O4, and the amperometric study was performed. The results obtained for GO were compared with those of GO–Fe3O4, as shown in Fig. S6A.† Fig. S6B† shows the linear plot of the pure GO modified electrode, with the linear range and limit of detection were calculated as 1–559 μM and 821.2 nM, respectively.| Electrode | LOD (nM) | Linear range (μM) | Method | Reference |
|---|---|---|---|---|
| a GN, graphite nanoparticles.b CS, chitosan.c MNPs, magnetic nanoparticles.d rGO, reduced graphene oxide.e GCE, glassy carbon electrode.f MWCNT, multi-walled carbon nanotubes.g PCV, poly crystal violet.h PLL, poly-L-lysine. | ||||
| aGN film electrode | 35 | 0.1–100 | DPV | 33 |
| bCS/cMNPs-drGO/eGCE | 16.7 | 0.06–11 | DPV | 26 |
| bCS-Fe3O4/dGCE | 8 | 0.05–30 | DPV | 23 |
| fMWCNTs/gPCV/eGCE | 10 | 0.05–100 | LSV | 34 |
| drGO-Ag/hPLL | 540 | 1–80 | DPV | 35 |
| Cu2O-drGO | 53 | 0.1–80 | AMP | 36 |
| Fe3O4/GO/GCE | 6.9 | 0.025–782.75 | AMP | This work |
3.7 BPA selectivity
The BPA selectivity was measured using an amperometric technique in 0.1 M PBS. To determine the selectivity of the GO–Fe3O4 adapted electrode, interfering substances (200 μM) were added in the presence of BPA (50 μM), as shown in Fig. 7C. As a result, the interfering components showed a negligible current response and indicated satisfactory selectivity for BPA sensing.3.8 Repeatability, reproducibility, and durability
The reusability of the prepared electrode was examined over ten uses in 0.1 M PBS containing BPA (50 μM) at 50 mV s−1, with the corresponding current responses plotted. After using ten times, the electrode showed 98.2% of its initial current response, indicating that Fe3O4/GO/GCE has excellent reusability. In addition to investigating the repeatability, different Fe3O4/GO/GCE samples were freshly prepared and their CV responses recorded and response currents plotted, as shown in the ESI (S5†). The RSD was calculated as 3.17%, which indicated that Fe3O4/GO/GCE had excellent repeatability in BPA sensing. Furthermore, the sensor stability was monitored daily (Fig. 7D). After continuous use for 15 days, the sensor maintained 97.95% of its initial response. From these results, Fe3O4/GO/GCE showed superior efficacy toward BPA sensing.3.9 Real sample investigation
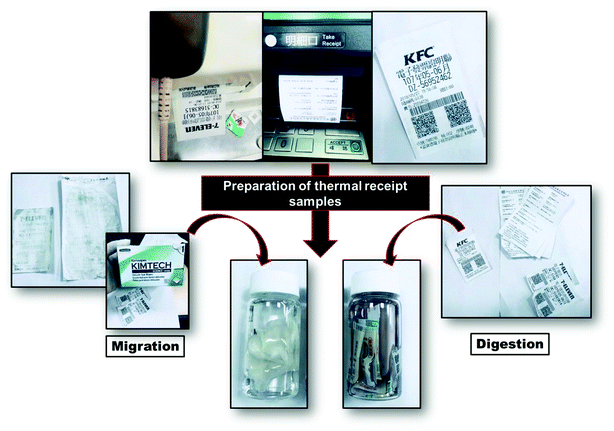
The practicality of the equipped sensor was tested on thermal receipt samples collected from the various convenience stores, restaurants, and ATMs in Taiwan. The sample preparation procedures are explained under their classifications in Scheme 2. The BPA concentration levels found in the thermal receipts are shown in Table 2. A standardized HPLC-UV method was first used to detect the BPA levels in thermal receipts, then the developed sensor, Fe3O4/GO/GCE, was used to detect BPA in the same samples. Finally, the results obtained by the developed electrode were compared with those of the standardized method (HPLC-UV). The found and recovered contents of the real samples are shown in Table 3. The “Added” category in Table 3 denotes the BPA levels in the thermal receipts confirmed by HPLC.| Thermal receipts | HPLC-UV | |
|---|---|---|
| Migration (ng mL−1) | Digestion (ng mL−1) | |
| a Concentration levels in thermal receipts. | ||
| Convenience store-1 | 4.52 | 6.26 |
| Convenience store-2 | 5.96 | 7.5 |
| Convenience store-3 | 5.02 | 6.49 |
| Restaurant-1 | 12.09 | 14.56 |
| Restaurant-2 | 9.25 | 11.62 |
| Restaurant-3 | 10.36 | 12.41 |
| ATM receipts | ND | ND |
| Thermal receipts | Added (μM) | Found (μM) | Relative error (%) | aRSD (%) | Average recovery (%) |
|---|---|---|---|---|---|
| a Related standard deviation of three independent experiments. | |||||
| Convenience store-1 | 0.0198 | 0.0191 | 3.53 | 3.97 | 96.44 |
| Convenience store-2 | 0.022 | 0.0215 | 2.72 | 3.42 | 97.72 |
| Convenience store-3 | 0.028 | 0.0269 | 3.92 | 4.11 | 96.07 |
| Restaurant-1 | 0.063 | 0.0619 | 1.07 | 3.19 | 98.25 |
| Restaurant-2 | 0.05 | 0.0484 | 4.02 | 2.63 | 96.8 |
| Restaurant-3 | 0.054 | 0.0529 | 2.03 | 3.51 | 97.96 |
3.10 Migration technique
For the migration technique, the sample was prepared as follows. Initially, each thermal receipts was gently rubbed with a separate kimwipe lightly dampened with methanol. These kimwipes were placed in corresponding vials containing methanol (20 mL). After 2 h, the solution was collected, filtered through a nylon filter, and transferred into a sample vial. Finally, the solution was taken for HPLC analysis. For the comparison study, the same samples were subjected to the amperometric technique.3.11 Digestion technique
Samples for digestion analysis were prepared by cutting the thermal receipts into small pieces and placing these pieces in separate vials containing methanol (20 mL). The samples were left undisturbed for 2 h, then filtered through the nylon filter, and transferred into sample vials. The final solutions were subjected to HPLC and amperometric analyses.4. Conclusions
In brief, Fe3O4 nanoparticles were prepared from waste toner by magnetic separation and thermal treatment. The recovered Fe3O4 nanoparticles were sonicated with graphene oxide nanosheets to obtain a GO–Fe3O4 composite. The structural, morphological, and electrochemical properties of the prepared nanocomposite were confirmed using FE-SEM, XPS, EDX, and voltammetric analysis. The recovered material was then fabricated onto a glassy carbon electrode and evaluated for BPA sensing, exhibiting outstanding electrocatalytic properties. As a BPA sensor, GO–Fe3O4 exhibited a very low detection limit of 6.9 nM with a wider linear range of 25 nM to 782.75 μM. This beneficial and reliable methodology for Fe3O4 recovery could be effective and economic for wide-scale ferrous production, and used in sensor development for the detection of hazardous BPA in thermal receipts.Conflicts of interest
The authors declare no conflicts of interest.Acknowledgements
The authors gratefully acknowledge financial support from the Ministry of Science and Technology, Taiwan (MOST 107-2221-E-182-021 and MOST 106-2113-M-027-003). B.S. Lou also acknowledges financial support from the Chung Gung Memorial Hospital (BMRP 280).References
- J. Cui and L. Zhang, J. Hazard. Mater., 2008, 158, 228–256 CrossRef CAS PubMed.
- R. Widmer, H. Oswald-Krapf, D. Sinha-Khetriwal, M. Schnellmann and H. Böni, Environ. Impact Assess. Rev., 2005, 25, 436–458 CrossRef.
- B. H. Robinson, Sci. Total Environ., 2009, 408, 183–191 CrossRef CAS PubMed.
- E. Sundin and H. M. Lee, in Design for innovative value towards a sustainable society, Springer, 2012, pp. 552–557 Search PubMed.
- H.-Y. Kang, Y.-S. Jun, Y.-C. Kim and H.-J. Jo, Procedia CIRP, 2016, 40, 280–284 CrossRef.
- V. Gaikwad, U. Kumar, F. Pahlevani, A. Piadasa and V. Sahajwalla, ACS Sustainable Chem. Eng., 2017, 5, 11543–11550 CrossRef CAS.
- D. Wang, Z. Cai, G. Jiang, A. Leung, M. H. Wong and W. K. Wong, Chemosphere, 2005, 60, 810–816 CrossRef CAS PubMed.
- T. Yamamoto and A. Yasuhara, Chemosphere, 1999, 38, 2569–2576 CrossRef CAS PubMed.
- K. Moriyama, T. Tagami, T. Akamizu, T. Usui, M. Saijo, N. Kanamoto, Y. Hataya, A. Shimatsu, H. Kuzuya and K. Nakao, J. Clin. Endocrinol. Metab., 2002, 87, 5185–5190 CrossRef CAS PubMed.
- R. T. Zoeller, R. Bansal and C. Parris, Endocrinology, 2005, 146, 607–612 CrossRef CAS PubMed.
- W. Zhou, J. Liu, L. Liao, S. Han and J. Liu, Mol. Cell. Endocrinol., 2008, 283, 12–18 CrossRef CAS PubMed.
- R. P. Sharma, M. Schuhmacher and V. Kumar, Sci. Total Environ., 2018, 624, 55–68 CrossRef CAS PubMed.
- F. S. Vom Saal, P. S. Cooke, D. L. Buchanan, P. Palanza, K. A. Thayer, S. C. Nagel, S. Parmigiani and W. V. Welshons, Toxicol. Ind. Health, 1998, 14, 239–260 CrossRef CAS PubMed.
- K. L. Howdeshell, A. K. Hotchkiss, K. A. Thayer, J. G. Vandenbergh and F. S. Vom Saal, Nature, 1999, 401, 763 CrossRef CAS PubMed.
- M. Aydoğan, A. Korkmaz, N. Barlas and D. Kolankaya, Toxicology, 2008, 249, 35–39 CrossRef PubMed.
- H. Kabuto, M. Amakawa and T. Shishibori, J. Life Sci., 2004, 74, 2931–2940 CrossRef CAS PubMed.
- M. Kundakovic, K. Gudsnuk, B. Franks, J. Madrid, R. L. Miller, F. P. Perera and F. A. Champagne, Proc. Natl. Acad. Sci. U. S. A., 2013, 110, 9956–9961 CrossRef CAS PubMed.
- J. T. Wolstenholme, M. Edwards, S. R. Shetty, J. D. Gatewood, J. A. Taylor, E. F. Rissman and J. J. Connelly, Endocrinology, 2012, 153, 3828–3838 CrossRef CAS PubMed.
- C. Liao, F. Liu and K. Kannan, Environ. Sci. Technol., 2012, 46, 6515–6522 CrossRef CAS PubMed.
- S. Biedermann, P. Tschudin and K. Grob, Anal. Bioanal. Chem., 2010, 398, 571–576 CrossRef CAS PubMed.
- C. Liao and K. Kannan, Environ. Sci. Technol., 2011, 45, 9372–9379 CrossRef CAS PubMed.
- E. Union, Official Journal of the European Union, 2009, 5, 2009 Search PubMed.
- C. Yu, L. Gou, X. Zhou, N. Bao and H. Gu, Electrochim. Acta, 2011, 56, 9056–9063 CrossRef CAS.
- M. A. Subhan, P. C. Saha, M. Alam, A. M. Asiri, M. Al-Mamun and M. M. Rahman, J. Environ. Chem. Eng., 2018, 6, 1396–1403 CrossRef CAS.
- H. Fan, Y. Li, D. Wu, H. Ma, K. Mao, D. Fan, B. Du, H. Li and Q. Wei, Anal. Chim. Acta, 2012, 711, 24–28 CrossRef CAS PubMed.
- Y. Zhang, Y. Cheng, Y. Zhou, B. Li, W. Gu, X. Shi and Y. Xian, Talanta, 2013, 107, 211–218 CrossRef CAS PubMed.
- S. Kogularasu, M. Govindasamy, S.-M. Chen, M. Akilarasan and V. Mani, Sens. Actuators, B, 2017, 253, 773–783 CrossRef CAS.
- S. Saha, M. Jana, P. Samanta, N. C. Murmu, N. H. Kim, T. Kuila and J. H. Lee, RSC Adv., 2014, 4, 44777–44785 RSC.
- F. Han, L. Ma, Q. Sun, C. Lei and A. Lu, Nano Res., 2014, 7, 1706–1717 CrossRef CAS.
- K. Ngamchuea, S. Eloul, K. Tschulik and R. G. Compton, J. Solid State Electrochem., 2014, 18, 3251–3257 CrossRef CAS.
- X. Wang, A. Sumboja, M. Lin, J. Yan and P. S. Lee, Nanoscale, 2012, 4, 7266–7272 RSC.
- M. M. Walczak, D. A. Dryer, D. D. Jacobson, M. G. Foss and N. T. Flynn, J. Chem. Educ., 1997, 74, 1195 CrossRef CAS.
- X. Dong, X. Qi, N. Liu, Y. Yang and Y. Piao, Sensors, 2017, 17, 836 CrossRef PubMed.
- W. Wang, J. Tang, S. Zheng, X. Ma, J. Zhu, F. Li and J. Wang, Food Anal. Methods, 2017, 10, 3815–3824 CrossRef.
- Y. Li, H. Wang, B. Yan and H. Zhang, J. Electroanal. Chem., 2017, 805, 39–46 CrossRef CAS.
- R. Shi, J. Liang, Z. Zhao, A. Liu and Y. Tian, Talanta, 2017, 169, 37–43 CrossRef CAS PubMed.
Footnotes |
| † Electronic supplementary information (ESI) available. See DOI: 10.1039/c8ra08017h |
| ‡ These authors contributed equally. |
| This journal is © The Royal Society of Chemistry 2018 |

