 Open Access Article
Uptake and release of photosensitizers in a hydrogel for applications in photodynamic therapy: the impact of structural parameters on intrapolymer transport dynamics†
Sarah Glass,
Tom Rüdiger,
Jan Griebel,
Bernd Abel and
Agnes Schulze
 *
*
Leibniz Institute of Surface Engineering (IOM), Germany. E-mail: agnes.schulze@iom-leipzig.de
First published on 12th December 2018
Abstract
In this study a hydrogel is presented that can be used as a carrier and release system for photosensitizers. Because of the high structural variety of photosensitizers, four different substances were analysed. Two porphyrins, 5,10,15,20-tetrakis(1-methyl-4-pyridinio)porphyrin tetra(p-toluene-sulfonate) and sodium meso-tetraphenylporphine-4,4′,4′′,4′′′-tetrasulfonat, eosin y and methylene blue were selected. Uptake and release of these photosensitizers were studied. All photosensitizers were taken up by the hydrogel not depending significantly on the structure of the photosensitizer, and it was possible to load the hydrogels in the μmol g−1 range. Nevertheless, size and pKa value were shown to influence the release behaviour. Finally, the singlet oxygen generation of the photosensitizer after release was demonstrated. The photosensitizer was still highly active and produced a sufficient amount of singlet oxygen.
1. Introduction
Photodynamic therapy (PDT) is a promising medical therapy, e.g. for cancer treatment.1 In PDT so called photosensitizers are used. Photosensitizers were investigated by Oscar Raab at the beginning of the last century.2 He observed that these compounds can treat cells when irradiated with light. In the 1930's the mechanism of the phenomenon was observed. Kautsky et al.47 found out that singlet oxygen or other reactive oxygen species (ROS) are formed due to the reaction of the excited photosensitizer with oxygen from the air or cell metabolism.In the 1950's hematoporphyrin (a powerful photosensitizer) was found to be tumour localizing and accumulates in cancerous tissue.3 This unique combination offered the possibility to treat cancer by using a photosensitizer and light. Starting with this, the field of PDT became more and more important and in 1999 the first photosensitizer was approved.1 Since then, lots of further second and third generation photosensitizers have been developed that treat not only cancer but microorganisms (e.g., bacteria, fungi, viruses), too.4 Additionally, inorganic photosensitizers like TiO2 and ZnO have been investigated in the last years.5,6
A well-known type of second generation photosensitizer is porphyrins,7 like 5,10,15,20-tetrakis(1-methyl-4-pyridinio)porphyrin tetra(p-toluene-sulfonate) (TMPyP) and sodium meso-tetraphenylporphine-4,4′,4′′,4′′′-tetrasulfonat (TPPS4). Porphyrins are known to be highly efficient. They generate a high amount of reactive species (especially singlet oxygen)8–10 and have high absorption coefficients. Therefore, they are widely used in cancer therapy,11 dentistry12 and as treatment for bacteria.13 Furthermore xanthene dyes are important photosensitizers.14 Eosin y, a typical xanthene photosensitizer, is reported to be highly effective in treating Gram-positive and Gram-negative bacteria.15,16 The last family of substances mentioned here are phenothiazine dyes. The most prominent representative is methylene blue.17 It is a widely used drug (not only in photomedicine), e.g. in dentistry or antimicrobial applications.18 Methylene blue is known to generate a high amount of singlet oxygen and ROS.17 Furthermore, it is known that methylene blue is effective against bacteria while it is not damaging white blood cells.19
Today, PDT is a widely used therapy not only against cancer. Additionally, photosensitizers are used in dentistry12 and in wound treatment.20 As well as cancer cells, microorganisms like bacteria or fungi can also be attacked by photosensitizers.1
Therefore, nowadays challenges (e.g. wound healing) can be faced by using PDT. It was already demonstrated that photosensitizers can improve wound healing in acute wounds as well as in chronic ones.21 One challenge in using PDT for wound management is the lack of a comfortable carrier system that releases compounds and that is transparent for activating light. One possibility is the use of hydrogels that are already well-known in wound therapy.22,23
Generally, there are further carrier systems. Especially, nanoparticle-based systems have been discussed in the past.5,24 Nevertheless, hydrogels can be used as bandage material and drug delivery system simultaneously.25,26
Hydrogels are three-dimensional polymeric networks synthesised of highly hydrophilic monomers.27 There is a great variety of monomers used in hydrogel synthesis, such as polyamides,28 poly (ethylene oxide),29 polyacryl acid derivates,30–32 gelatin33 and many more. Features vary with monomer structure and chain length. The number of applications is as high as the number of monomers. Typical fields of application are cell immobilization,34 tissue engineering,35 wound care22 and drug delivery.36
Hydrogels can protect wounds and keep them moist, which is beneficial in wound management.37 At the same time they can be used as a carrier system for drugs like photosensitizers. In this case the hydrogel has to be transparent to ensure the excitation of the photosensitizer by light. Therefore, the bandage would not have to be changed. This prevents the patient from additional pain.
In a recent study a transparent, noncytotoxic, low-molecular weight and inexpensive hydrogel was introduced and optimized.6,38 The present study investigates this hydrogel as a transparent carrier system for molecular photosensitizers. For this purpose, a high variety of different photosensitizers was evaluated regarding adsorption and release dynamics. The photosensitizers were selected regarding their different structures, sizes and charges. Additionally, the photosensitizer activity (generation of singlet oxygen) was investigated to demonstrate the suitability of the hydrogel system in PDT.
2. Experimental
2.1. Materials
Poly(ethylene glycol)diacrylate (PEGDA), eosin y, 5,10,15,20-tetrakis(1-methyl-4-pyridinio)porphyrin tetra(p-toluene-sulfonate) (TMPyP), sodium meso-tetraphenylporphine-4,4′,4′′,4′′′-tetrasulfonat (TPPS4), methylene blue, 9,10-anthracenediyl-bis(methylene)dimalonic acid (ABDA) and phosphate buffered saline (PBS) were purchased from Sigma Aldrich (St. Louise, USA).The photoinitiator 1-[4-(2-hydroxyethoxy)-phenyl]-2-hydroxy-2-methyl-1-propane-1-one (α-HAP) was purchased from IGM Resins B.V. (Waalwijk, the Netherlands). A Merck ultrapure water system was used to purify water. All chemicals were used without further purification.
2.2. Preparation of the hydrogels
The hydrogels were prepared like described before.38 A formulation of 30 wt% PEGDA, PBS and the commercial photoinitiator α-HAP was prepared. 1 ml of the formulation was injected in a polystyrene mould with a diameter of 3.5 cm. This corresponds to a height of 1 mm. The moulds were irradiated with a medium-pressure mercury lamp. The light dose was 2500 mJ cm−2. The polymerized hydrogels were washed twice for 1 h in PBS buffer and three times for 1 h in Milli-Q water. Afterwards, they were dried for 24 h at 40 °C in a nitrogen atmosphere.2.3. UV/VIS spectra and determination of the extinction coefficients
UV/VIS spectra were recorded with an UV-2101PC UV-VIS spectrometer (Shimadzu, Kyoto, Japan) using Milli-Q water as solvent. Extinction coefficients were calculated at the maximum absorption wavelength using Beer–Lambert-law.39
 | (1) |
| Concentration c [mol l−1] | |
|---|---|
| Methylene blue | 1.1 × 10⁻⁵ |
| Eosin y | 1.0 × 10⁻⁵ |
| TMPyP | 2.7 × 10⁻⁶ |
| TPPS4 | 2.4 × 10⁻⁶ |
2.4. Uptake studies
To determine the relative amount of the photosensitizers the hydrogels were immersed in solutions of various concentrations for 24, 48 and 120 h. The loaded gels were dried for 24 h at 40 °C in a nitrogen atmosphere. The transmittance (T) of the dried gels was determined with an UV-2101PC UV-VIS spectrometer.The dry loaded gels were completely dissolved in 10 ml 2 N NaOH per gel for 120 h. The concentration of dye in this solution was determined photometrically using an infinite M200 reader from Tecan (Maennedorf, Switzerland). As reference, a defined concentration (1.0 × 10⁻³ mol l−1 for methylene blue and eosin y, and 1.0 × 10⁻⁴ mol l−1 for TMPyP and TPPS4, respectively) of each dye in 2 N NaOH was used.
From these concentrations the absolute amount of substance (n) was calculated. The theoretical amounts were calculated using:
| n = cV | (2) |
The relative uptake of the hydrogels was calculated for the lowest concentration of each photosensitizer. Extinction coefficients were determined using the calculated absolute amounts of photosensitizer and the transmittance of the hydrogels. Eqn (1) was used. The amount of the photosensitizer was calculated from the transmittance spectra at different times using the extinction coefficient. The relative amount of photosensitizer in the gels was calculated at all observed times and compared with the theoretical amount. The extinction coefficients of the photosensitizers in hydrogels differ slightly from the extinction coefficients in water and therefore, they had to be determined, additionally.
2.5. Rheology
Rheology was performed before and after loading of the hydrogel. The hydrogels were immersed in 10 ml 1 × 10⁻⁴ M solution of the respective photosensitizer for 48 h. Rheological measurements of the dried hydrogels were performed on a MCR300 rheometer from Anton Paar (Graz, Austria). The rheometer was equipped with a planar 25 mm diameter head. The frequency was varied from 0.16 to 16 Hz. The probe head was pressed on the sample with a pressure of 10 N. The amplitude was 1%.The mesh sizes of the hydrogels were calculated from the rheological data using:40,41
 | (3) |
2.6. Atomic force microscopy (AFM)
AFM investigations were carried out on a Nanowizard IV (JPK Instruments, Berlin, Germany) scanning probe microscope using silicon cantilevers (PPP-NCHR, nanosensors™) with tip radii of about 7 nm. The phase and height images were obtained by operating the instrument in intermittent contact mode in ambient condition.In preparation of AFM thin sections (∼150 nm) of the hydrogel were cut with a cryo-ultramicrotome (PT-CRX LN Ultra with CR-X cryo unit, RMC, USA) at cryo temperature of −60 °C using diamond knives.
2.7. Release studies
The hydrogel was dried after loading with the photosensitizer. Afterwards, it was immersed in 10 ml PBS buffer to release the dye from the hydrogels. The PBS buffer was changed after 1, 2, 3, 4, 5, 6, 8, 24, 48 and 72 h. The concentrations, and therefore, the amounts of substance of the samples were determined photometrically with an infinite M200 reader from Tecan.2.8. Singlet oxygen generation
The generation of singlet oxygen was determined using the fluorescent dye ABDA. This dye reacts selectively with singlet oxygen to a nonfluorescent product. Before usage pure O2 was bubbled through the ABDA solution to ensure comparable oxygen saturation with every measurement. 6 ml of a 5 × 10⁻⁴ M ABDA solution were applied to a wet hydrogel immersed in 1 × 10⁻⁴ M methylene blue solution. This was irradiated with a 940 mW LED (Thorlabs, Newton, USA) emitting at 660 nm. The LED was placed 10 cm above the sample (corresponds to 1.1 mW cm−2). Samples were taken every 15 min within the first hour and then every 30 min. The volume of the sample (100 μl) was replaced with water. The fluorescence of ABDA at 422 nm was observed photometrically with an infinite M200 reader from Tecan (Maennedorf, Switzerland). As reference, a pure hydrogel in ADBA solution was investigated.2.9. Photosensitizer size (Stokes-radius)
To determine the Stokes radius of the photosensitizers, DOSY (Diffusion Ordered Spectroscopy) NMR spectra using watergate sequence for solvent suppression were recorded. Herein, a Bruker NMR Ultra Shield 600 MHz was used. 4,4-Dimethyl-4-silapentane-1-sulfonic acid (DSS) was used as internal NMR standard. Stokes radii were calculated from the received diffusion coefficients D using the Stokes–Einstein-equation:
 | (4) |
2.10. Determination of pKa;1
The pKa values were determined using acid–base titration. The photosensitizers were dissolved in Milli-Q water. The solution was divided equally. Afterwards, one part was titrated using 0.1 M NaOH solution. The other part was titrated using 0.1 M HCl. The pH values were recorded using a HI 3220 pH/ORP meter (HANNA instruments, Woonsocket, USA). Eosin y, TMPyP and TPPS4 are polyprotic acids. Here, the lowest pKa value is displayed.3. Results and discussion
3.1. Material properties
First, the material was analysed regarding its mechanical properties. Thus, rheology was used to determine moduli and loss factor. The storage and dynamic moduli were 1.11 × 10⁵ ± 2.11 × 10⁴ Pa. This is in good agreement with the moduli of human tissue.43 Therefore, the hydrogel was well suited for the application as bandage. The loss factor was 1.70 × 10⁻² ± 1.48 × 10⁻³. A low loss factor is typical for an elastic material.The average mesh size ξ was calculated using eqn (3). It was 32.3 Å. Thus, most photosensitizers (and molecules in general) are much smaller than the meshes of the hydrogel. Therefore, this publication focused on the impact of the properties of the photosensitizers on the transport dynamics.
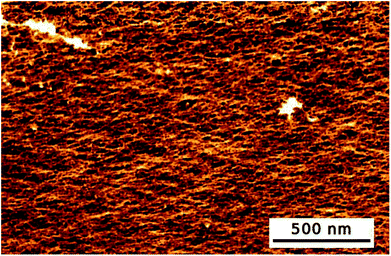
Additionally, AFM images of the hydrogel were recorded (see Fig. 1). The hydrogel had a smooth and homogeneous surface. Cavities of about 30 to 50 Å were visible. Therefore, the AFM images were in good correlation with the calculated mesh size.
3.2. Selection and characterization of the photosensitizers
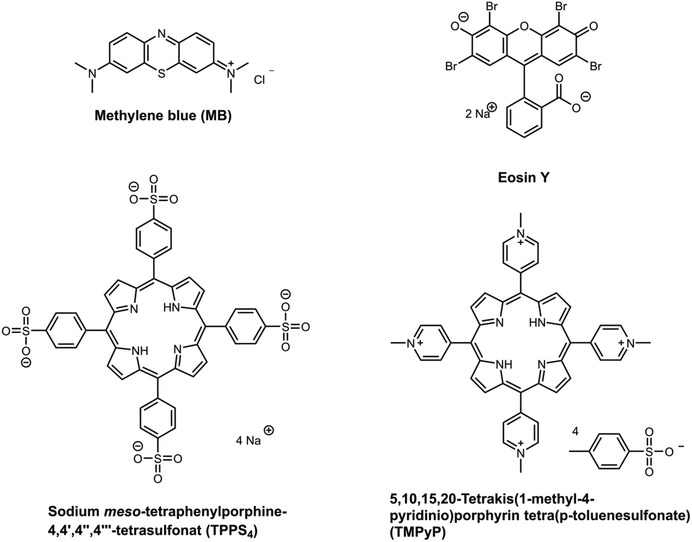
As mentioned in the introduction (section 1), there is a large variety of photosensitizers. Therefore, for this study a selection was chosen which represents a few main structural motifs of photosensitizers. In Fig. 2 the chosen photosensitizers are displayed. The substances were chosen because all are well known to be excellent photosensitizers.1,10,11,13,17,44 Furthermore, they were selected because of their differences in charge, size and absorption wavelength. Two porphyrins (TMPyP and TPPS4) a phenothiazine (methylene blue) and a xanthene (eosin y) have been selected. Each two of them are positively charged and two negative. However, the first pKa value of all four photosensitizers was determined to be between pH 4 and 5 (full titration curves were displayed in ESI Fig. 5–8†). Therefore, all are weak acids. The variety of properties should enable to investigate and understand possible influences on the uptake and release behaviour of the hydrogels. An overview of the properties of the chosen photosensitizers is listed in Table 2.| Structure family | Charge | Λmax [nm] | ε [104 l (mol cm)−1] | RH [Å] | pKa;1 | |
|---|---|---|---|---|---|---|
| Methylene blue | Phenothiazine | Positive | 665.0 | 6.3 | 6.5 | 4.0 |
| Eosin y | Xanthene | Negative | 514.5 | 7.0 | 7.1 | 4.5 |
| TMPyP | Porphyrin | Positive | 421.0 | 28.2 | 7.7 | 4.8 |
| TPPS4 | Porphyrin | Negative | 413.5 | 29.0 | 8.9 | 4.2 |
Besides charge and structure, the size could possibly affect the uptake and release behaviour. Therefore, the Stokes radii were determined using eqn (4). Accordingly, the diffusion coefficients were measured using DOSY-NMR. Phosphate buffered D2O was used. While the solvent influences the Stokes radii, the values may differ slightly from the radii in water. Nevertheless, the trend is most probably the same in water as in heavy water. The full DOSY spectra are displayed in ESI Fig. 1–4.† TPPS4 is the photosensitizer with the largest Stokes radius of 8.9 Å. There were two photosensitizers with medium Stokes radii, namely TMPyP and eosin Y, which were calculated to be 7.7 Å and 7.1 Å in size, respectively. Methylene blue has the smallest radius of 6.5 Å.
Extinction coefficients in water were calculated at the maximal absorption wavelength using eqn (1). The porphyrin photosensitizers had four to six times higher extinction coefficients than the other substances (2.9 and 2.8 × 10⁵ l mol−1 cm−1, respectively for TMPyP and TPPS4 compared to 7.0 and 6.3 8 × 10⁴ l mol−1 cm−1, respectively for eosin y and methylene blue). The extinction coefficient is the main property that influences how much a photosensitizer can be immersed and yields a still transparent hydrogel.
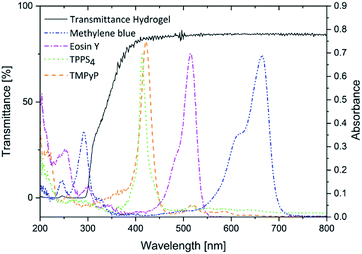
High transmittance has to be possessed by the hydrogel to make sure the light can penetrate the hydrogel. Thereby, the photosensitizer can be excited after release to the infected tissue and produce singlet oxygen or other reactive oxygen species. The transmittance of the hydrogel is about 75% down to a wavelength of 350 nm (Fig. 3). Therefore, it is an ideal carrier for the photosensitizers investigated here because their absorption maxima were between 413 nm and 665 nm.
However, expect methylene blue none of the photosensitizers is approved today. Nevertheless, all of them are used in clinical tests or in vivo/in vitro studies.7 Furthermore, they are adequate model substances for several other photosensitizers that are approved today.
3.3. Uptake study
Uptake of the photosensitizers in the hydrogel is crucial for the envisaged medical application. Furthermore, the dynamics and maximum loading characteristics of the different photosensitizers shall be understood. Thus, the dried hydrogels were immersed in solutions of the photosensitizer with different concentrations. The immersion times were 24 h, 48 h and 120 h, to analyse a time dependency in the uptake behaviour. The concentrations of the immersion solutions were selected regarding the extinction coefficient of the photosensitizers. The higher the extinction coefficients, the lower were the observed concentrations. For methylene blue the immersion concentration was varied between 10−2 M and 10−4 M. Because of the slightly higher excitation, the concentration range for eosin y was 10−2 M and 5 × 10⁻⁵ M. The extinction coefficients of both porphyrins are nearly one order of magnitude higher. For this reason, the analysed concentrations were chosen to be between 10−3 M and 10−5 M for TMPyP, and 10−3 M and 5 × 10⁻⁶ M for TPPS4, respectively. Photos of the gels after immersion are displayed in Fig. 4.Clearly, all photosensitizer were taken up. Furthermore, the hydrogels were darker coloured when immersed in a solution with a higher concentration. This indicates that more photosensitizer was incorporated in the hydrogels when a larger concentration is offered. Further, there seemed to be no saturation within the observed concentration range.
The transmittance of the dried gels after immersion was determined to support the previous findings. The transmittance spectra of the hydrogel loaded for 48 h are displayed in Fig. 5. (In ESI Fig. 9† the transmittance spectra of all hydrogels are presented.) Here, the fact was confirmed that higher immersion concentrations lead to darker coloured hydrogels. Gels immersed in highly concentrated solutions were not even translucent any more. This cut-off concentration was different for every photosensitizer depending on the extinction coefficient. Hydrogels loaded with TPPS4 (the photosensitizer with the highest extinction coefficient) were translucent up to a concentration of 5 × 10⁻⁶ M and TMPyP loaded gels up to a concentration of 1 × 10⁻⁵ M. As expected the hydrogels loaded with eosin y and methylene blue were transparent up to higher concentrations (5 × 10⁻⁵ M and 1 × 10⁻⁴ M, respectively).
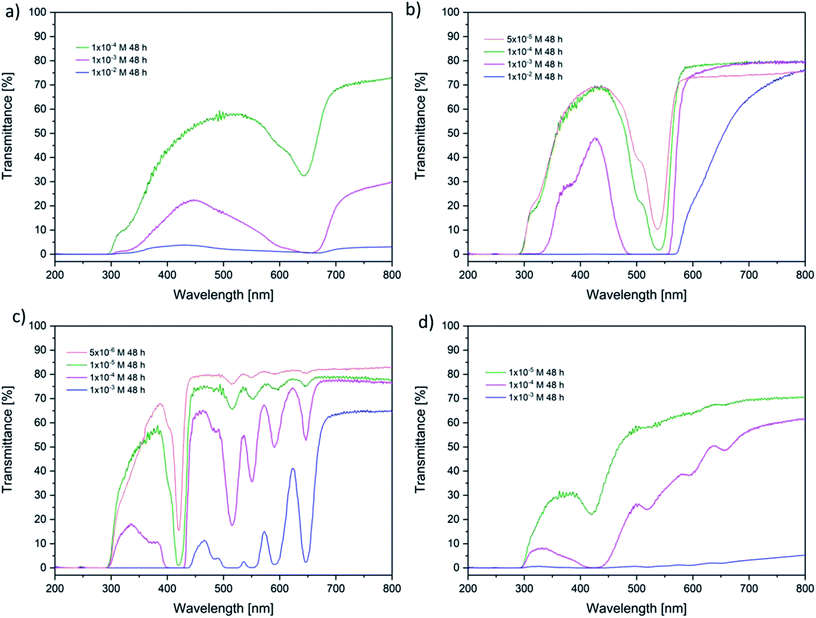 | ||
| Fig. 5 Transmittance of the hydrogels loaded for 48 h (a) methylene blue (b) eosin y, (c) TPPS4 and (d) TMPyP. | ||
Further, the absolute amounts of the photosensitizers in the hydrogels were determined. Gels with an immersion time of 48 h were chosen. The gels were diluted in concentrated sodium hydroxide solution. Following, the amount of substance in these solutions was observed using eqn (2). The results are displayed in Fig. 6. Obviously, there is no significant difference within the investigated photosensitizers. This confirmed the results of the former measurements. Additionally, the linear slope indicates that there is no saturation within the observed range of concentrations. This could be quite important for a future application because also high amounts of photosensitizers can be carried within the hydrogels. Finally, the amount of substance in the hydrogels was about 2 times higher than the expected amount. This result can be explained with surface adsorption interactions at the hydrogel.
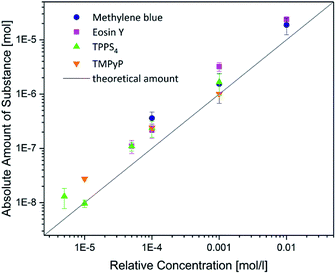 | ||
| Fig. 6 Absolute uptake of the amount of the photosensitizers in the hydrogels compared to the relative concentration in the immersion solutions. | ||
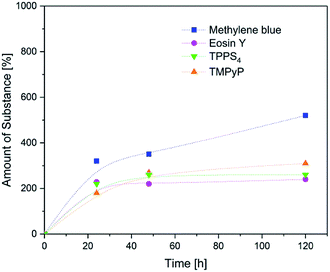
To enable the kinetic analysis and comparison of the uptake of different photosensitizers, the relative uptake was determined at different times (for the lowest concentration of each photosensitizer). The results are displayed in Fig. 6. No significant differences were found for the uptake of eosin y, TPPS and TMPyP. These compounds reached a plateau after 48 h with about 250% amount of substance. However, methylene blue was taken up with 350% after 48 h and the uptake amount still increased to 550% after 120 h (Fig. 7).
The positively charged methylene blue was taken up to a moderate higher extent compared with the other photosensitizers. This can be explained with the surface charge of PEGDA hydrogels which is almost non-charged (∼−1.2 mV).45 Since the other positively charged photosensitizer TMPyP showed similar uptake characteristics as the two negatively charged compounds, we assume that the charge of the photosensitizers influenced the uptake behaviour of the hydrogels only slightly. Since methylene blue is the smallest and TMPyP is one of the largest investigated photosensitizers (6.5 Å vs. 7.7 Å), this could be one explanation for the uptake differences of both positively charged compounds. However, within the here investigated range one single property like charge, size or structure seems not to dictate the uptake behaviour.
Additionally, the mechanical properties of the hydrogels were observed before and after loading with the photosensitizers. Neither the moduli nor the loss factor changed (see Table S1†). Therefore, the photosensitizer did not influence the mechanical properties of the hydrogel.
3.4. Release study
The photosensitizer release from the hydrogel carrier matrix is crucial for a potential medical treatment, too. Therefore, the loaded gels were placed in PBS buffer in dried state. The PBS buffer was changed frequently, first of all to prevent the formation of equilibrium. The second reason for changing the buffer was to simulate the continuous circulation in the human body.All release studies were performed using gels immersed in 1 × 10⁻⁴ M photosensitizer solution. The amount of released photosensitizer was compared with the absolute amount of substance in the hydrogel (as shown in Fig. 6). The results are displayed in Fig. 8. Except of TPPS4 all photosensitizers were released to the buffer. In the case of the positively charged methylene blue and TMPyP most of the release took place within the first 8 h and a maximum plateau was reached after 48 h. The slopes and plateau evolution showed a parallel trend. However, the total amount of released methylene blue (25%) was about half of the amount of TMPyP (46%). In the case of the negatively charged eosin y the overall release was the highest (54%). Furthermore, the released amount didn't reach a plateau within the investigated time range (72 h). As mentioned before the negatively charged TPPS4 was hardly released at all from the hydrogel.
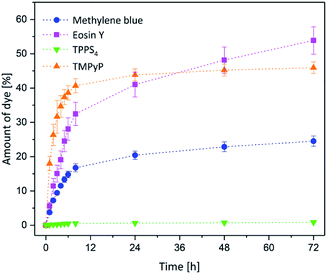 | ||
| Fig. 8 Release of methylene blue (blue dot), eosin y (pink square), TMPyP (orange bottom-up triangle) and TPPS4 (green triangle). | ||
Obviously, the photosensitizers with the highest pKa value showed the best release behaviour in terms of released amount. Additionally, TPPS4 which was the largest investigated compound was not released at all. We therefore assume that also the release behaviour is influenced by the interplay of several structural parameters. The size and pKa value showed the main impact, while the charge was not affecting the release behaviour noteworthy.
3.5. Singlet oxygen generation
Finally, singlet oxygen generation of methylene blue after release was investigated (representative for all photosensitizer compounds). For this purpose, the fluorescent substance ABDA46 was monitored. ABDA is sensitive to singlet oxygen and loses its fluorescence (422 nm) due to oxidation by singlet oxygen.The amount of ABDA was about 10 times higher than the amount of photosensitizer in this test (3 × 10⁻⁶ M compared to 3.6 × 10⁻⁷ M). The results of the degradation of ABDA are displayed in Fig. 9. ABDA was completely degraded after 90 min. That means methylene blue is still active and produces a high amount of singlet oxygen. The degradation was slower within the first 30 min (about 25% degradation) because the photosensitizer was released slowly to the surrounding liquid. Afterwards, the singlet oxygen production was much faster and 95% ABDA was degraded within 60 min. In conclusion, methylene blue is still highly effective after the release from the hydrogel. This is a very important aspect regarding the future medical application.
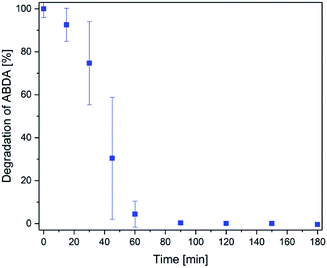 | ||
| Fig. 9 Degradation of ABDA by singlet oxygen produced by the methylene blue released from a hydrogel with time. | ||
4. Conclusions
This study demonstrated that transparent hydrogels could be ideal carriers for photosensitizers in medical application such as photodynamic therapy. The PEGDA hydrogel used here can be used for different photosensitizers with varying structural properties. All substances were taken up comparably. Neither size, charge nor the chemical structure had a major effect on the uptake behaviour. Additionally, it was possible to implement even high amounts (10−2 M) of photosensitizers. Depending on the photosensitizer concentration the transmittance changed. To keep the hydrogels translucent low amounts of photosensitizers can be used. The transmittance of the photosensitizer in the hydrogel is mainly depending on the extinction coefficient of the photosensitizer.Furthermore, the release behaviour of the photosensitizers from the hydrogels was studied. The release behaviour was influenced by size and pKa mainly. Because of the interplay of these properties no distinct trend was observed for the different investigated compounds. Therefore, it will be necessary to consider the release behaviour for every additional photosensitizer independently. Understanding the influencing structural properties, an individualized medical treatment regarding release time (=treatment time) and/or photosensitizer concentration (=singlet oxygen generation) is possible. Therefore, further approved photosensitizers shall be observed in the future.
Finally, the singlet oxygen generation of the photosensitizer (one representative case) was demonstrated after release from the hydrogel by degradation of ABDA. The fluorescent test molecule was degraded within 60 min. This confirmed the high activity of the photosensitizer after release. Consequently, hydrogels and in particular the hydrogel employed in this study are well suited to support a broad variation of photosensitizers applied in photodynamic therapy.
Conflicts of interest
There are no conflicts to declare.Acknowledgements
S. Glass is grateful for support within the IOM Research Group “Schalten mit Licht”. B. Abel thanks the Miller Insitute (UC Berkeley) for a Somorjai-Miller-Guest-Professorship Award. The authors are thankful to the Fraunhofer Institute for Microstructure of Materials and Systems (IMWS) and Matthias Menzel for recording the AFM images. Additionally, the authors thank Andrea Prager for preparing the cryocut of the hydrogel.References
- D. E. J. G. J. Dolmans, D. Fukumura and R. K. Jain, Nat. Rev. Cancer, 2003, 3, 380–387 CrossRef CAS PubMed.
- O. Raab, Z. Biol., 1900, 39, 524–546 CAS.
- F. H. J. Figge, G. S. Weiland and L. O. J. Manganiello, Proc. Soc. Exp. Biol. Med., 1948, 68, 640–641 CrossRef CAS PubMed.
- A. Juzeniene, Q. Peng and J. Moan, Photochem. Photobiol. Sci., 2007, 6, 1234–1245 RSC.
- J. Bogdan, J. Pławińska-Czarnak and J. Zarzyńska, Nanoscale Res. Lett., 2017, 12, 225 CrossRef PubMed.
- S. Glass, B. Trinklein, B. Abel and A. Schulze, Front. Chem., 2018, 6, 340 CrossRef PubMed.
- A. B. F. Ormond and H. S., Materials, 2013, 6, 817–840 CrossRef CAS PubMed.
- K. Ergaieg, M. Chevanne, J. Cillard and R. Seux, Sol. Energy, 2008, 82, 1107–1117 CrossRef CAS.
- M. P. Cormick, E. D. Quiroga, S. G. Bertolotti, M. G. Alvarez and E. N. Durantini, Photochem. Photobiol. Sci., 2011, 10, 1556–1561 RSC.
- A. Preuss, L. Zeugner, S. Hackbarth, M. A. Faustino, M. G. Neves, J. A. Cavaleiro and B. Roeder, J. Appl. Microbiol., 2013, 114, 36–43 CrossRef CAS PubMed.
- K. Berg, P. K. Selbo, A. Weyergang, A. Dietze, L. Prasmickaite, A. Bonsted, B. Ø. Engesaeter, E. Angell-Petersen, T. Warloe, N. Frandsen and A. HØGset, J. Microsc., 2005, 218, 133–147 CrossRef CAS PubMed.
- K. Konopka and T. Goslinski, J. Dent. Res., 2007, 86, 694–707 CrossRef CAS PubMed.
- T. Maisch, F. Spannberger, J. Regensburger, A. Felgenträger and W. Bäumler, J. Ind. Microbiol. Biotechnol., 2012, 39, 1013–1021 CrossRef CAS PubMed.
- L. Xu, N. Sheybani, W. A. Yeudall and H. Yang, Biomater. Sci., 2015, 3, 250–255 RSC.
- G. A. Johnson, N. Muthukrishnan and J.-P. Pellois, Bioconjugate Chem., 2013, 24, 114–123 CrossRef CAS.
- G. A. Johnson, E. A. Ellis, H. Kim, N. Muthukrishnan, T. Snavely and J.-P. Pellois, PLoS One, 2014, 9, e91220 CrossRef.
- J. P. Tardivo, A. Del Giglio, C. S. de Oliveira, D. S. Gabrielli, H. C. Junqueira, D. B. Tada, D. Severino, R. de Fátima Turchiello and M. S. Baptista, Photodiagn. Photodyn. Ther., 2005, 2, 175–191 CrossRef CAS.
- S. Menezes, M. A. M. Capella and L. R. Caldas, J. Photochem. Photobiol., B, 1990, 5, 505–517 CrossRef CAS.
- M. Tanaka, M. Kinoshita, Y. Yoshihara, N. Shinomiya, S. Seki, K. Nemoto, T. Hirayama, T. Dai, L. Huang, M. R. Hamblin and Y. Morimoto, Photochem. Photobiol., 2012, 88, 227–232 CrossRef CAS PubMed.
- V. Nesi-Reis, D. S. S. L. Lera-Nonose, J. Oyama, M. P. P. Silva-Lalucci, I. G. Demarchi, S. M. A. Aristides, J. J. V. Teixeira, T. G. V. Silveira and M. V. C. Lonardoni, Photodiagn. Photodyn. Ther., 2018, 21, 294–305 CrossRef PubMed.
- A. Bennewitz, M. Prinz and U. Wollina, Kosmetische Medizin, 2013, 34, 208–215 Search PubMed.
- N. Lohmann, L. Schirmer, P. Atallah, E. Wandel, R. A. Ferrer, C. Werner, J. C. Simon, S. Franz and U. Freudenberg, Sci. Transl. Med., 2017, 9, eaai9044 CrossRef.
- Q. Chai, Y. Jiao and X. Yu, Gels, 2017, 3, 6 CrossRef.
- A. T. Debele, S. Peng and H.-C. Tsai, Int. J. Mol. Sci., 2015, 16, 22094–22136 CrossRef PubMed.
- A. Bullock, P. Pickavance, D. Haddow, S. Rimmer and S. MacNeil, Regener. Med., 2010, 5, 55–64 CrossRef CAS PubMed.
- Haryanto, S. Kim, J. H. Kim, J. O. Kim, S. Ku, H. Cho, D. H. Han and P. Huh, Macromol. Res., 2014, 22, 131–138 CrossRef CAS.
- E. M. Ahmed, J. Adv. Res., 2015, 6, 105–121 CrossRef CAS PubMed.
- X. S. Wu, A. S. Hoffman and P. Yager, J. Polym. Sci., Part A: Polym. Chem., 1992, 30, 2121–2129 CrossRef CAS.
- E. W. Merrill, K. A. Dennison and C. Sung, Biomaterials, 1993, 14, 1117–1126 CrossRef CAS.
- L. Yean, C. Bunel and J.-P. Vairon, Makromol. Chem., 1990, 191, 1119–1129 CrossRef CAS.
- N. C. Padmavathi and P. R. Chatterji, Macromolecules, 1996, 29, 1976–1979 CrossRef CAS.
- H. Jiang, W. Su, P. T. Mather and T. J. Bunning, Polymer, 1999, 40, 4593–4602 CrossRef CAS.
- E. I. Wisotzki, M. Hennes, C. Schuldt, F. Engert, W. Knolle, U. Decker, J. A. Käs, M. Zink and S. G. Mayr, J. Mater. Chem. B, 2014, 2, 4297–4309 RSC.
- A. C. Jen, M. C. Wake and A. G. Mikos, Biotechnol. Bioeng., 1996, 50, 357–364 CrossRef CAS.
- K. Y. Lee and D. J. Mooney, Chem. Rev., 2001, 101, 1869–1879 CrossRef CAS PubMed.
- T. R. Hoare and D. S. Kohane, Polymer, 2008, 49, 1993–2007 CrossRef CAS.
- J. Dissemond, M. Augustin, S. A. Eming, T. Goerge, T. Horn, S. Karrer, H. Schumann and M. Stücker, Journal der Deutschen Dermatologischen Gesellschaft, 2014, 12, 541–554 Search PubMed.
- T. Pelras, S. Glass, T. Scherzer, C. Elsner, A. Schulze and B. Abel, Polymers, 2017, 9, 639 CrossRef.
- A. Beer, Ann. Phys. Chem., 1852, 86, 78–88 CrossRef.
- A. Hajighasem and K. Kabiri, J. Polym. Res., 2013, 20, 218 CrossRef.
- Y. Tsuji, X. Li and M. Shibayama, Gels, 2018, 4, 50 CrossRef.
- R. C. Hardy and R. L. Cottington, J. Chem. Phys., 1949, 17, 509–512 CrossRef CAS.
- X. Liang and S. A. Boppart, IEEE Trans. Biomed. Eng., 2010, 57, 953–959 Search PubMed.
- K. Tamai, T. Mizushima, X. Wu, A. Inoue, M. Ota, Y. Yokoyama, N. Miyoshi, N. Haraguchi, H. Takahashi, J. Nishimura, T. Hata, C. Matsuda, Y. Doki, M. Mori and H. Yamamoto, Mol. Cancer Ther., 2018, 1613–1622 CrossRef CAS PubMed.
- T. Fei, X. Xiaoding, D. Ting, Y. Miao, Z. Xianzheng and W. Jiawei, Biomed. Mater., 2012, 7, 055009 CrossRef PubMed.
- A. Gomes, E. Fernandes and J. L. F. C. Lima, J. Biochem. Biophys. Methods, 2005, 65, 45–80 CrossRef CAS PubMed.
- H. Kautsky and H. de Bruijn, Naturwissenschaften, 1931, 19, 1043–1043 CrossRef CAS.
Footnote |
| † Electronic supplementary information (ESI) available. See DOI: 10.1039/c8ra08093c |
| This journal is © The Royal Society of Chemistry 2018 |

