 Open Access Article
A facile synthesis of molecularly imprinted polymers and their properties as electrochemical sensors for ethyl carbamate analysis†
Ming Guo *a,
Yinglu Hua,
Lixia Wangb,
Peter E. Brodelius*c and
Liping Suna
aDepartment of Chemistry, Zhejiang Agricultural & Forestry University, Hangzhou 311300, China. E-mail: guoming@zafu.edu.cn; Fax: +86-571 63732772; Tel: +86-571-61075662
bSchool of Agriculture and Food Science, Zhejiang Agricultural & Forestry University, Hangzhou 311300, China
cDepartment of Chemistry and Biomedical Sciences, Linnaeus University, 391 82 Kalmar, Sweden. E-mail: peter.brodelius@lnu.se
First published on 30th November 2018
Abstract
New molecularly imprinted polymers (MIPs), which exhibit specific recognition of ethyl carbamate (EC) have been synthesized and studied. In this process, EC was the template molecule and β-cyclodextrin derivatives were employed as functional monomers in the molecular imprinting technique (MIT). An EC molecularly imprinted sensor (EC-MIS) was prepared by using MIT surface modification. The EC-MIS was characterized by cyclic voltammetry, electrochemical impedance spectroscopy and differential pulse voltammetry. EC detection performance, binding parameters and dynamics mechanism were investigated. The result showed that the synthetic route designed was appropriate and that new MIP and EC-MIS were successfully prepared. The EC-MIS exhibited a good molecular recognition of EC. A linear relationship between current and EC concentration was observed using cyclic voltammetry and the detection limit was 5.86 μg L−1. The binding constant (K = 4.75 × 10⁶ L mol−1) between EC and the EC-MIS, as well as, the number of binding sites (n = 1.48) has been determined. The EC-MIS recognition mechanism for the EC is a two-step process. The sensor was applied for the determination of EC in Chinese yellow wines, and the results were in good agreement with the gas chromatography-mass spectrometry (GC-MS) method.
1. Introduction
Ethyl carbamate (EC) is a class 2A carcinogen, which is widely found in fermented foods,1,2 especially in grape wine and in Chinese rice wine.3,4 In recent years, significant attention has been paid to EC because of its widespread existence and harmfulness.5–7 Analysis of EC has played a key role in studying its interaction mechanism in vivo, eliminating residual EC and investigating any other problems related to EC. Nowadays, methods to analyze EC are mainly based on gas chromatography-mass spectrometry (GC-MS) and related methods.8–13 The limitations of these methods are high cost, complex sample pre-treatment and complex operation.8,14 At present, it is difficult to separate and analyze EC due to low concentrations in samples and due to its low molecular weight. Therefore, it is today very relevant to study the enrichment, separation and detection of EC.Molecular imprinting technology is a relatively new technology to mimic the specific molecular interaction between macromolecules and ligand molecules in nature. The cross linking of functional monomers in the presence of a target molecule (template molecule) produce stable polymers and after removing the target molecule, a molecularly imprinted polymer (MIP) with specific binding sites for the template molecule is generated. The cavities of the MIP, generated by the template molecules, will specifically recognize the template molecules in a sample. Molecular imprinting techniques (MIT), used as highly efficient separation methods, have been developed during recent years. MIPs may have high affinity and selectivity to their templates,15,16 and can significantly improve the selectivity and sensitivity of analytical methods with a good stability to resist harsh environments.17,18 Therefore, MIT have been widely used in chromatographic separation, solid phase extraction, mimicking enzyme catalysis, membrane separation and many other applications. It has become a Frontier of chemistry, biology, material science and environmental science.19–23
Because of the stability and low cost of MIPs, such polymers have attracted great attention for application as recognition elements of sensors. Combination of the specific recognition of MIT with high sensitivity of the electrochemical sensor is important developments in the field of molecular recognition research.24–28 Thus, it is worthwhile to utilize the exceptional properties of MIPs recognizing EC to prepare molecularly imprinted sensor to analyze and detect EC. Wu et al.29 prepared a molecularly imprinted microsphere that can specifically adsorb EC and applied it to the determination of EC content in rice wine and brandy. The product had stable structure and sensitive specific adsorption performance to EC, and the regression model showed good fitting effect. Kanyong et al.30 developed a graphene-based/molecularly imprinted carbon composite electrode (rGO/SPCE), Zhao et al.31 improved it to a disposable electrochemical biomimetic sensor for fast and selective detection of EC. The sensor specifically bound to EC quickly without sample pretreatment. A linear range was from 100 to 1300 nM, and a detection limit of 37 nM was achieved. The detection time is less than 5 min.
In this study, based on good mechanical strength and stability of β-cyclodextrin, a new imprinted polymer has designed which has good reproducibility and efficiency to specifically determine the concentration of EC in biological samples but also to remove EC from such samples. Molecularly imprinted sensors were prepared by using EC as the template molecule and a β-cyclodextrin derivative as functional monomer. Meaningful results have been obtained with the comprehensive survey of new EC-MIS recognition performance.
2. Experimental section
2.1. Reagents and materials
β-Cyclodextrin (99.8%), epichlorohydrin (AR) and 2-iodoxybenzoic acid (98%) were from Aladdin reagent; dimethyl sulfoxide (DMSO, AR) and absolute ethyl alcohol (AR) were supplied by (Tianjin Yongda Chemical Reagent Co., Ltd.); 4-toluenesulfonyl chloride (TsCl, CP) and sodium hydroxide (AR) were obtained from Sinopharm Chemical Reagent Ltd. and acetone (AR) from Anji Zhong'an Chemical Reagent Co., Ltd.; hydrochloric acid was purchased from Hangzhou Dafang Chemical Reagent Factory and ethyl carbamate (EC, ≥99%) from Sigma-Aldrich, USA; N,N-dimethylformamide was obtained from Rugao Jinling Reagent Factory and carrageenan (AR) from Tokyo Kasei Kogyo Co., Ltd.; double-distilled water was used in all experiments.2.2. Methods
Preparation of EC imprinted polymer: β-cyclodextrin aldehyde (5.0 g) and EC (0.07 g) were dissolved in an appropriate amount of dry DMSO. After 24 h reaction, epichlorohydrin (1.17 g) was added slowly and reacted for 24 h at 60 °C, then cooled to room temperature. The cooled liquid was poured into a large amount of acetone, washed with hot and cold water several times alternately to elute unreacted β-cyclodextrin aldehyde. After drying in vacuum, the product was milled to a powder with particle size less than 0.132 mm then washed with 15% HCl until EC was undetectable in the washing solution. The MIP was obtained after drying in vacuum. Non-imprinted polymer (NIP) was obtained in the same way but omitting the EC.
The Fourier transform infrared spectroscopy (IR Prestige-21 Fourier transform infrared spectrometer, Shimadzu, Japan) was used to record IR spectra of β-cyclodextrin, β-cyclodextrin aldehyde and MIP. The KBr squash technique (FW-4A tablet machine, Tianjin Optical Instrument Factory) was utilized to prepare samples and the wave number scanning range was from 500 cm−1 to 4000 cm−1.
13C-NMR spectra of β-cyclodextrin, β-cyclodextrin aldehyde and MIP were obtained by Avance II/400 MHz nuclear magnetic resonance spectrometer (Bruker, Switzerland).
Apparent morphology of β-cyclodextrin, β-cyclodextrin aldehyde and MIP were observed on a SS-550 scanning electron microscope (Shimadzu Corporation, Japan). Samples were treated with SS-550-IC sputtering device before analysis.
X-ray diffractograms (XRD) of β-cyclodextrin, β-cyclodextrin aldehyde and MIP were determined with XRD 6000 powder diffraction apparatus (Shimadzu Corporation, Japan). The crystallinity was calculated by the corresponding spectrum processing software. Scanning mode was qualitative step scan, voltage/current: 35 kV/30 mA, scan speed: 10° min−1, step size: 0.02°, copper target, scan range: 4–50° (2θ).
Biodegradation tests were performed on β-cyclodextrin, β-cyclodextrin aldehyde and MIP using Aspergillus niger. The samples were the only carbon source of the incubation media. The composition of the media was: sample fine powder 0.15%, MgSO4·7H2O 0.05%, NH4Cl 0.1%, CaCl2·2H2O 0.0005%, KH2PO4 0.554%, Na2HPO4·12H2O 1.194%, and agar 2%. NaOH (0.01 mol L−1) was used to adjust the culture medium to pH = 6.8–7.0. Under sterile condition, the fungal material was prepared as a suspension containing 4.6 × 10⁶ A. niger cells per milliliter. Sample powder was sprinkled quantitatively and homogeneously on the incubation media. Subsequently, an asepsis gun was used to inoculate the A. niger suspension in the middle of the incubation media. The treated incubation media was cultivated at 28 °C. The growing of the fungus and the degradation rate of the sample were observed once a week.
![[thin space (1/6-em)]](https://www.rsc.org/images/entities/char_2009.gif) :
:![[thin space (1/6-em)]](https://www.rsc.org/images/entities/char_2009.gif) 1) to prepare the EC-MIS. Similar conditions were used here to prepare the NIP modified electrode.
1) to prepare the EC-MIS. Similar conditions were used here to prepare the NIP modified electrode.Cyclic voltammetry was used for electrochemical characterization of the EC-MIS (NIP modified electrode) (CHI660C electrochemical workstation, Shanghai Chenhua Instrument Co., Ltd., China). The working, reference, and counter electrodes were an EC-MIS/NIP modified glassy carbon electrode (GCE, Φ = 3 mm), a saturated calomel electrode (SCE), and a platinum wire, respectively. The voltammogram of cyclic voltammetry was obtained with the potential range of 0.6 to −0.2 V and in 5 mmol L−1 K3Fe(CN)6![[thin space (1/6-em)]](https://www.rsc.org/images/entities/char_2009.gif) :
:![[thin space (1/6-em)]](https://www.rsc.org/images/entities/char_2009.gif) K4Fe(CN)6 (v/v = 1
K4Fe(CN)6 (v/v = 1![[thin space (1/6-em)]](https://www.rsc.org/images/entities/char_2009.gif) :
:![[thin space (1/6-em)]](https://www.rsc.org/images/entities/char_2009.gif) 1) + 0.1 mol L−1 KCl solution. Using the same set-up, the AC impedance method and capacitance–time curve (CT) were used to characterize electrochemical properties. A frequency range from 0.01 Hz to 1000 kHz and AC perturbation amplitude of 5 mV were used.
1) + 0.1 mol L−1 KCl solution. Using the same set-up, the AC impedance method and capacitance–time curve (CT) were used to characterize electrochemical properties. A frequency range from 0.01 Hz to 1000 kHz and AC perturbation amplitude of 5 mV were used.
Formulated different concentrations of EC were mixed with 0.1 mol L−1 PBS buffer solution (containing 5 mmol L−1 K3Fe(CN)6![[thin space (1/6-em)]](https://www.rsc.org/images/entities/char_2009.gif) :
:![[thin space (1/6-em)]](https://www.rsc.org/images/entities/char_2009.gif) K4Fe(CN)6 (v/v = 1
K4Fe(CN)6 (v/v = 1![[thin space (1/6-em)]](https://www.rsc.org/images/entities/char_2009.gif) :
:![[thin space (1/6-em)]](https://www.rsc.org/images/entities/char_2009.gif) 1)). Differential pulse voltammetry (DPV) spectra of the solution systems were determined by recording voltammograms in the range of −0.2–0.6 V.
1)). Differential pulse voltammetry (DPV) spectra of the solution systems were determined by recording voltammograms in the range of −0.2–0.6 V.
Two batches of yellow wine samples of different ages (15 and 20 years), which were representatives of the typical yellow wines from the wine-producing region of Shaoxing (China), were prepared in triplicates. Extraction and concentration procedures were adapted from Lachenmeier et al.33,34 The yellow wine sample (5.0 mL) was directly applied to an alkaline Celite solid phase extraction column (4.0 g/12 mL, Varian Associates, USA). After equilibration for 15 min under vacuum conditions, the column was washed with 5% ethyl acetate at a flow rate of 1 mL min−1. The eluate (20 mL) was collected in a test tube and concentrated to 1 mL by using N2 purging at 30 °C, and dried by anhydrous sodium sulfate. The dried eluate was diluted with methanol to a final volume of 2.0 mL.
EC samples were diluted with PBS buffer (0.1 mol L−1, pH 7.0, containing 5 mmol L−1 K3Fe(CN)6![[thin space (1/6-em)]](https://www.rsc.org/images/entities/char_2009.gif) :
:![[thin space (1/6-em)]](https://www.rsc.org/images/entities/char_2009.gif) K4Fe(CN)6 (v/v = 1
K4Fe(CN)6 (v/v = 1![[thin space (1/6-em)]](https://www.rsc.org/images/entities/char_2009.gif) :
:![[thin space (1/6-em)]](https://www.rsc.org/images/entities/char_2009.gif) 1)) to prepare the spiked sample solutions. DPV spectra of the samples were determined by recording voltammograms in the range of −0.2–0.6 V. PBS buffer was used as a blank control. A standard curve was constructed and used to determine the EC concentration of the unknown samples. For GC-MS analysis (Agilent 7890A-5975C, USA), the EC samples were filtered through a 0.45 μm membrane, and each spiked sample was subjected to three parallel determinations. The procedure and the analytical instrument condition were as reported in the literature.35–37 A standard curve was prepared.
1)) to prepare the spiked sample solutions. DPV spectra of the samples were determined by recording voltammograms in the range of −0.2–0.6 V. PBS buffer was used as a blank control. A standard curve was constructed and used to determine the EC concentration of the unknown samples. For GC-MS analysis (Agilent 7890A-5975C, USA), the EC samples were filtered through a 0.45 μm membrane, and each spiked sample was subjected to three parallel determinations. The procedure and the analytical instrument condition were as reported in the literature.35–37 A standard curve was prepared.
3. Results and discussion
3.1. Synthesis and characterization of MIP
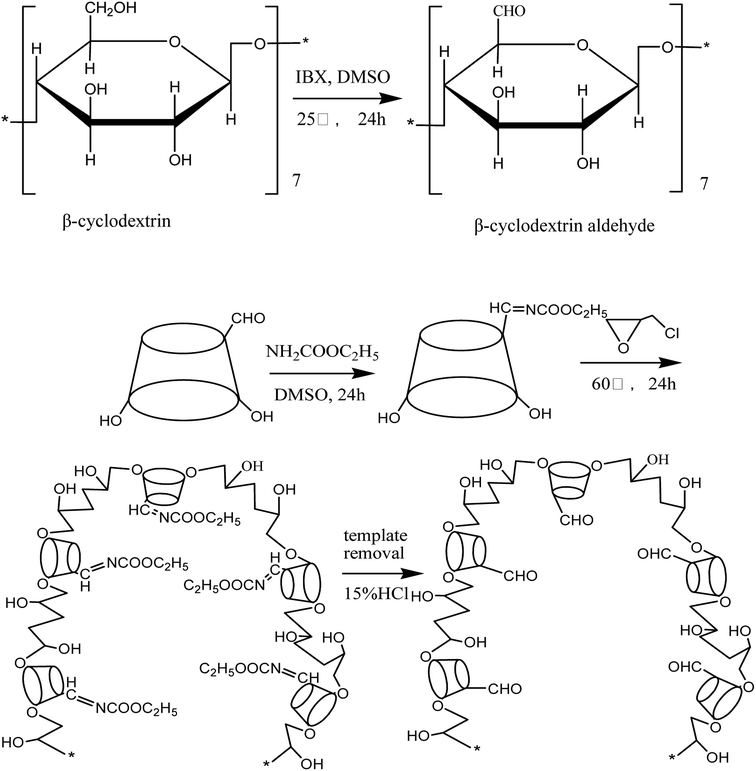
The synthesis of the EC molecularly imprinted polymer is schematically shown in Fig. 1. First, β-cyclodextrin (β-CD) was reacted with iodoxybenzoic acid to produce the functional monomer β-cyclodextrin aldehyde (β-CDA), which was used with EC as template and epichlorohydrin as crosslinking agent to produce the imprinted cyclodextrin polymer. The template molecules were eluted under acid condition. The end product was EC molecularly imprinted polymer.The structure of the EC molecularly imprinted polymer was characterized by IR and NMR. The IR and 13C-NMR spectral data are given below.
IR spectra of β-CD, β-CDA and molecularly imprinted polymer (IR ν/cm−1 (KBr)): β-CD: 3500–3200 (–OH, s, ν), 2950–2850 (C–H2, C–H3, s, νas, νs), 1646 (C![[double bond, length as m-dash]](https://www.rsc.org/images/entities/char_e001.gif) O, m, ν), 1417 (C–H, δ), 1158, 1027 (C–OH, s, δ); β-CDA: 3500–3200 (–OH, s, ν), 2950–2850 (C–H2, C–H3, s, νas, νs), 1732 (C
O, m, ν), 1417 (C–H, δ), 1158, 1027 (C–OH, s, δ); β-CDA: 3500–3200 (–OH, s, ν), 2950–2850 (C–H2, C–H3, s, νas, νs), 1732 (C![[double bond, length as m-dash]](https://www.rsc.org/images/entities/char_e001.gif) O–H, s, ν),1643 (C
O–H, s, ν),1643 (C![[double bond, length as m-dash]](https://www.rsc.org/images/entities/char_e001.gif) O, m, ν), 1423 (C–H, δ), 1153, 1028 (C–OH, s, δ); MIP: 3500–3200 (–OH, s, ν), 2950–2850 (C–H2, C–H3, s, νas, νs), 1647 (C
O, m, ν), 1423 (C–H, δ), 1153, 1028 (C–OH, s, δ); MIP: 3500–3200 (–OH, s, ν), 2950–2850 (C–H2, C–H3, s, νas, νs), 1647 (C![[double bond, length as m-dash]](https://www.rsc.org/images/entities/char_e001.gif) O, m, ν), 1457 (C–H, w, δ), 1031 (C–OH, m, δ).
O, m, ν), 1457 (C–H, w, δ), 1031 (C–OH, m, δ).
13C-NMR spectra of β-CD, β-CDA and molecularly imprinted polymer (13C-NMR δ/ppm): β-CD: 105.11 (C1, s), 75.01 (C2, s), 72.46 (C3, s), 88.86 (C4, s), 81.53 (C5, s), 65.23 (C6, s); β-CDA: 102.61 (C1, s), 76.81 (C2, s), 72.87 (C3, s), 83.67 (C4, s), 81.93 (C5, s), 174.93 (C6–CHO, d), 65.05 (C6–CHOH, s); MIP: 105.8 (C1, d), 75.01 (C2, s), 71.25 (C3, s), 88.91 (C4, s), 82.56 (C5, s), 65.05 (C6–CHOH, s), 174.93 (C6–CHO, d).
The molecular structure of β-CD, β-CDA and MIP were also confirmed by the XRD, SEM and biodegradability. All the spectrum are shown in Fig. S1 to S6 of the ESIs.† Results of the molecular characterization are consistent with the synthesis reaction equation.
3.2. Electrochemical behavior of EC-MIS
Using K3[Fe(CN)6] as a probe and KCl as the supporting electrolyte the cyclic voltammetry behavior of the modified electrode was tested. Fig. 2A shows main potential difference between redox peaks of bare GCE, EC-MIS and NIS. The reasons for these differences may because it is difficult for [Fe(CN)6]4−/3− permeated the membrane of non-imprinted polymer (NIP) to participate in the redox reaction and that the Faraday current is very small.38 However, after elution of the template molecule, imprinted cavities were present in the MIP membrane, which allowed the [Fe(CN)6]4−/3− probe to reach the electrode surface as shown by the observed redox reaction. Because the contact area between [Fe(CN)6]4−/3− and bare GCE is the largest, peak current is maximum. Reversible [Fe(CN)6]4−/3− redox peaks can be observed in the cyclic voltammetry curve.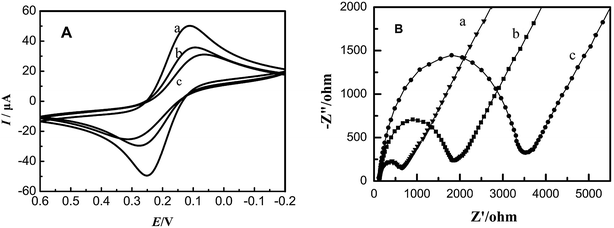 | ||
| Fig. 2 Cyclic voltammograms (A) and electrochemical impedance spectra (B) of different electrodes. (a) Bare GCE; (b) EC-MIS; (c) NIP. | ||
Fig. 2B shows the results of AC impedance characterization under the same experimental condition. The impedance of the bare glassy carbon electrode (Fig. 2B curve a) is small due to the fact that [Fe(CN)6]4−/3− can easily reach the electrode surface and react. For the membrane of the non-imprinted polymer, the impedance at high frequencies appears as a regular impedance peak, which represents the impedance of the membrane bulk (Fig. 2B curve c). It illustrates that a dense non-conductive polymer is formed on the electrode surface leading to difficulties for [Fe(CN)6]4−/3− to reach the electrode surface. However, after elution of EC from the membrane, its impedance decreases significantly (Fig. 2B curve b). It shows that the imprinted cavities in the polymer membrane provide [Fe(CN)6]4−/3− with space to diffuse to the electrode surface.
EC-MIS was scanned by CV at 50–300 mV s−1 scan rate (Fig. 3A). It was found that the peak current increases with increasing scan rate. However, if the scan rate is very fast, the baseline is unstable. The relationship between the peak current Ip and the scan rate ν1/2 is shown in eqn (1) and (2) These equations show a linear relationship between Ip and ν1/2. It indicates that the electrode process shows the characteristics of diffusion current and that the cavity transmission of the probe molecule is controlled by diffusion in the molecularly imprinted membrane.
| Ipa (μA) = −18.1851 − 1.85135ν1/2 (V s−1) | (1) |
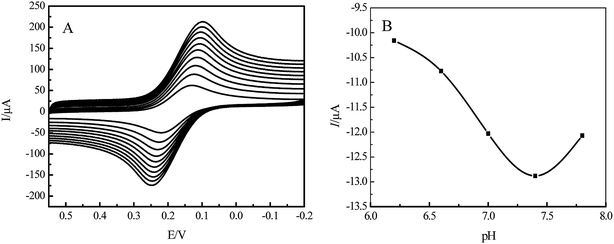 | ||
| Fig. 3 Cyclic voltammograms of EC-MIS at different rates (A) and peak current of the EC-MIS as function of pH (B). | ||
R = 0.9827, SD = 1.4846, N = 6, P < 0.0005.
| Ipc (μA) = −21.5081 + 1.6277ν1/2 (V s−1) | (2) |
R = 0.9790, SD = 1.4418, N = 6, P < 0.0007.
Using K3[Fe(CN)6] as a probe and PBS buffer, pH between 6.2 and 7.8, as the supporting electrolyte, the EC-MIS was characterized by differential pulse voltammetry (DPV) (Fig. 3B). The results show that with increasing pH value the peak current of EC-MIS increases reaching a peak at pH = 7.4 and then decreases. At this pH the peak current is not stable. However, the peak current is stable at pH = 7.0. Considering all factors, PBS buffer, pH = 7.0, was selected as supporting electrolyte in further studies.
3.3. Detection and response of EC-MIS to EC
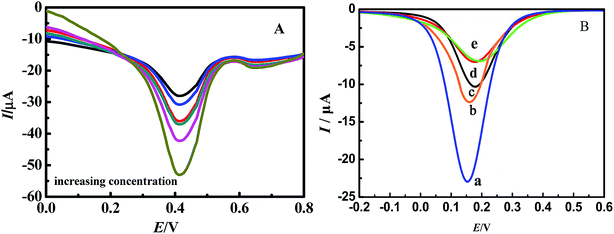
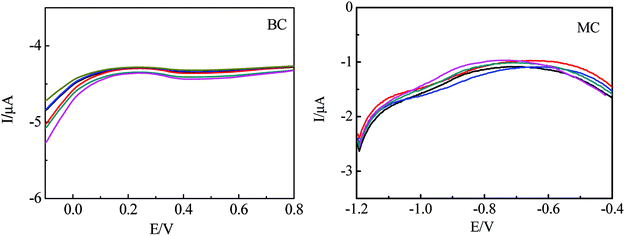
Fig. 4A shows the DPV of EC-MIS for different concentration of EC(A) in K3Fe(CN)6/K4Fe(CN)6 + 0.1 mol L−1 PBS buffer solution, pH 7.0. The peak current increases obviously with the increase of EC concentration, which shows the imprinting sensor has the ability to recognize the template EC. Fig. 4B shows the DPV curves of the bare GCE and different membrane modified electrodes recorded in K3Fe(CN)6/K4Fe(CN)6 + 0.1 mol L−1 PBS buffer solution, pH 7.0. The oxidation peak current of the bare electrode is 22.44 μA (Fig. 4B curve a). The electrochemical reaction occurs on the surface of the imprinted electrode without template molecules (Fig. 4B curve b). The peak current is 12.03 μA, which is higher than the peak current in the presence of the template molecule (Fig. 4B curve c). These results indicate that the template molecules pores are left in the imprinted membrane after eluting EC allowing the electrochemical reaction to occur on the surface of the glassy carbon electrode. Furthermore, it is shown that after addition of EC, the peak current of the MIP electrode is reduced significantly while the peak current of the NIP modified electrode does not change to any great extent (Fig. 4B curves d and e). These results indicate that the NIP membrane does not have cavities and recognition sites of EC molecules while the MIP polymer membrane has cavities and recognition sites of the EC.Fig. 5 shows the DPV curves of EC modified electrode at different concentration of methyl carbamate (MC) and tert-butyl carbamate (BC) in K3Fe(CN)6/K4Fe(CN)6 + 0.1 mol L−1 PBS buffer solution, pH 7.0. It can be seen that the maximum response current of both are very small without obvious fluctuation. Although the structures of BC and MC and are similar to EC, their molecular configurations don't match the configuration of the EC binding site, MIP molecularly imprinted electrode has weak combination ability with BC and MC. So changes in response to the current are not obvious, which proves that the MIP electrode has selectivity for EC.
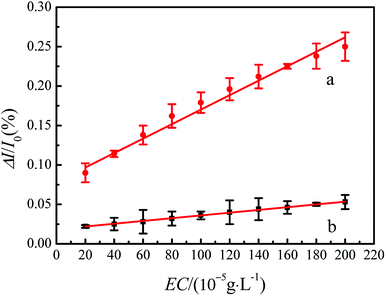
The relative current change (ΔI/I0) can reduce the impact of experimental errors. Therefore, responsiveness of the sensor can be measured by the relative current change.39
| η = (ΔI/I0)MIP/(ΔI/I0)NIP | (3) |
From Fig. 6, we can conclude that there is a linear relationship between the concentration of EC and the peak current of the EC-MIS sensor.
| Ip (μA) = −11.00587 + 0.01055c (×10−5 g L−1) | (4) |
R = 0.99484, SD = 0.13097, N = 10, P < 0.0001.
The detection limit was set to be triple of the standard deviation of the blank and the detection limit of the prepared EC-MIS sensor was 5.86 μg L−1 (S/N = 3).
3.4. Reproducibility and stability of the EC-MIS
In order to determine the reproducibility of the EC-MIS sensor, ten DPV measurements were carried out using one EC solution. No significant change of the response current was observed. A relative standard deviation of 3.1% was calculated. Going through a second test after 24 h, the response current had decayed to 97.2% of the initial values. It indicates that the MIP modified electrode has a good reproducibility. The used MIP modified electrode was washed once for 3 min with 10 mL 90% methanol acetic acid and then five times with double-distilled water, and finally stored in a refrigerator at 4 °C. The response currents reached 92.5%, 86.6%, 82.3% of the initial value after storage for one, two and three weeks respectively. It indicates that the sensor has good stability in a certainly term, and the stability decreased to less than 90% over a week, which may result in inaccurate detect results of EC in the range of less than 90%. Therefore the results suggest that the sensor be used within a week.3.5. Building thermodynamic model and calculating the binding parameter of the EC-MIS
The binding parameter is a very important factor for the study of the interaction between biological macromolecules and active small molecules. Based on the change of the peak current as function of the concentration of the active substance, a model of the interaction between the EC-MIS and EC was constructed. Furthermore the binding constant K and the number of binding sites n were calculated.40,41MIP and EC were assumed to generate the complex MIP–nEC,
| MIP + nEC ⇌ MIP − nEC | (5) |
The binding constant K can be expressed as:
 | (6) |
| cMIP = [MIP] + [MIP − nEC] | (7) |
The total concentration of EC ([EC]0) is:
| [EC]0 = [EC] + n[MIP − nEC] | (8) |
Under the experimental conditions, the peak current in the reaction system is proportional to the concentration of EC and it can be expressed as:
| I = δ[EC] | (9) |
| ΔI = I[EC]0 − I[EC] | (10) |
After combined formula (8), (9) and (10):
| ΔI = δ([EC]0 − [EC]) = δn[MIP − nEC] | (11) |
Obviously, ΔI is proportional to [MIP − nEC]. [MIP − nEC] reaches its maximum value when ΔI exhibits its peak value, expressed as ΔImax. At ΔImax, [MIP − nEC]max should be equal to cMIP.
| ΔImax = δn[MIP − nEC]max = δncMIP | (12) |
Combination of eqn (11) and (12) gives:
| ΔImax − ΔI = δn(cMIP − [MIP − nEC]) = δn[MIP] | (13) |
Substitution of eqn (10) and (13) into (6) gives:
lg[ΔI/(ΔImax − ΔI)] = lg![[thin space (1/6-em)]](https://www.rsc.org/images/entities/char_2009.gif) K + n K + n![[thin space (1/6-em)]](https://www.rsc.org/images/entities/char_2009.gif) lg[EC] lg[EC]
| (14) |
The binding constant and the number of binding sites of biological macromolecules interacting with active small molecules can be calculated using eqn (14). The lg![[thin space (1/6-em)]](https://www.rsc.org/images/entities/char_2009.gif) K is obtained from the slope of the curve of lg[ΔI/ΔImax − ΔI] vs. lg[EC]. The plot of lg[ΔI/ΔImax − ΔI] vs. lg[EC] gives: lg[ΔI/ΔImax − ΔI] = −6.67678–1.4831 lg[EC] (R = 0.99572, SD = 0.03426, N = 9, P < 0.0001) (data not shown). The binding constant K = 4.75 × 10⁶ L mol−1 and the number of binding sites n = 1.48 are obtained from the linear relationship with slope n and intercept lg
K is obtained from the slope of the curve of lg[ΔI/ΔImax − ΔI] vs. lg[EC]. The plot of lg[ΔI/ΔImax − ΔI] vs. lg[EC] gives: lg[ΔI/ΔImax − ΔI] = −6.67678–1.4831 lg[EC] (R = 0.99572, SD = 0.03426, N = 9, P < 0.0001) (data not shown). The binding constant K = 4.75 × 10⁶ L mol−1 and the number of binding sites n = 1.48 are obtained from the linear relationship with slope n and intercept lg![[thin space (1/6-em)]](https://www.rsc.org/images/entities/char_2009.gif) K.
K.
3.6. Kinetic analysis of the EC identification process
Capacitance–time curves of the EC-MIS at different concentrations of EC are shown in Fig. 7.By nonlinear fitting of the experimental data, eqn (15) was obtained.42
 | (15) |
 | (16) |
 | (17) |
 | (18) |
α, β, γ represent the percentage of chemical adsorption time in the beginning, the first and the second step, respectively; k1, k2 represent the binding rate constants in the first and the second step, respectively. The sum of α, β, γ should be equal to 1.0. The following equations are obtained from eqn (16) and (17):
| α = e−k1t | (19) |
 | (20) |
Thus:
 | (21) |
In the process of recognition of EC by EC-MIS, the change of capacitance ΔCi can be calculated by the following formula:
| ΔCi = ΔCββ + ΔCγγ | (22) |
ΔCβ and ΔCγ represent the change of capacitance after the first and the second adsorption process, respectively. Combining eqn (20) and (21) with (22):
 | (23) |
Eqn (23) can be rewritten in the form of the relative amplitude of capacitance change:
 | (24) |
The experimental data obtained from Fig. 7 was plugged into eqn (15) and (24), and the kinetic parameters were calculated as shown in Table 1.
| c (EC) (mg L−1) | Equation (15) | Equation (24) | |||||||
|---|---|---|---|---|---|---|---|---|---|
| α0 | α1 | α2 | t1 | t2 | R | k1 (10−2 s−1) | k2 (10−2 s−1) | R | |
| 0.2 | −23.2991 | 2.5561 | 20.9452 | 39.4754 | 1059.0842 | 0.9998 | 2.533 | 0.09442 | 0.9989 |
| 1.0 | −27.7142 | 2.7435 | 25.1952 | 27.7335 | 976.3323 | 0.9999 | 3.606 | 0.10240 | 0.9998 |
| 2.0 | −32.5260 | 2.7667 | 29.9965 | 25.6084 | 1003.7252 | 0.9993 | 3.905 | 0.09963 | 0.9991 |
Fig. 7 and Table 1 show that the value of t1 is at least one order of magnitude smaller than t2 and that the value of k1 is at least one order of magnitude larger than k2 at different concentrations of EC, which indicates that the recognition of EC by the EC-MIS is divided into two different kinetic steps. The first step is the combination of imprinted cavities of the blotting membrane with template molecules EC, which is a fast binding step. The second step is the rearrangement of the template molecules on the electrode surface and physical adsorption after chemical binding of EC, which is a slow adsorption step.
3.7. Analytical application
In order to validate the developed method, the prepared sensor was used for the determination of EC in commercially available yellow wines. The measurements were compared with data obtained by the GC-MS method. The results are summarized in Table 2. It can be seen that the EC concentrations determined by using the developed sensor corresponds to 92–96% of the concentrations determined using the GC-MS method. The results obtained using the developed method were in good agreement with results obtained using the standard GC-MS method. We may conclude that the possible utilization of the present method has been established.| Yellow wine age (year) | EC content (μg L−1) | |
|---|---|---|
| Sensor method | GC-MS method | |
| 15 | 247 ± 0.14 | 268 ± 0.11 |
| 20 | 406 ± 0.22 | 425 ± 0.17 |
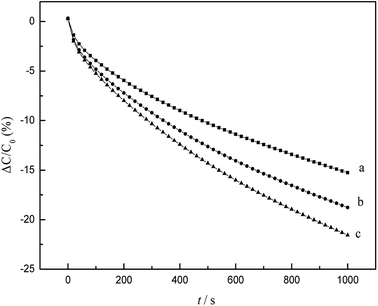 | ||
| Fig. 7 Capacitance responses of modified electrode at different concentrations of EC (a) 0.2 mg L−1 EC; (b) 1 mg L−1 EC; (c) 2 mg L−1 EC. | ||
There is a distinct difference in the EC determination between the EC-MIS method and GC-MS method. A possible reason for this may be that the complex composition of the wine samples influences the EC-MIS or GC-MS analyses differently. Other sample analytical applications by using the developed sensor method will be the topic of our further exploration.
4. Conclusions
Ethyl carbamate is a harmful substance widely found in fermented foods and it has adverse effects on our health. Because the content is normally extremely low and the characteristic of the molecular complex structure is not obvious in many fermented foods, detection and removal of ethyl carbamate is still a difficult task. In this study, we prepared a new molecularly imprinted polymer with specific recognition of ethyl carbamate by designing a synthetic route, using ethyl carbamate as template, β-cyclodextrin derivative as functional monomer and epichlorohydrin as cross linker. The modified electrode prepared based on ethyl carbamate molecularly imprinted polymer exhibits a good selectivity of EC. Thermodynamic parameters and kinetic parameters may be obtained through thermodynamic and kinetic analyses. Some referential results have been obtained by using EC-MIS method to detect EC and the method has a good application prospect for analyzing EC, eliminating EC etc.Conflict of Interest
The authors declare that they have no competing interests.Acknowledgements
This work was financially supported by the Zhejiang Provincial Natural Science Foundation of China (No. LY18B070003), the Open Fund of Zhejiang Provincial Collaborative Innovation Center for Bamboo Resources and High-efficiency Utilization (2017ZZY2-09), and the Project of Zhejiang Provincial Key Laboratory of Chemical Utilization of Forestry Biomass, the Cooperative Project of Zhejiang Province-Chinese Academy of Forestry (2015SY11).Notes and references
- J. Zhang, F. Fang and J. Chen, et al., The arginine deiminase pathway of koji bacteria is involved in ethyl carbamate precursor production in soy sauce, FEMS Microbiol. Lett., 2014, 358, 91–97 CrossRef CAS PubMed.
- P. G. Forkert and R. P. Lee, Metabolism of ethyl carbamate by pulmonary cytochrome P450 and carboxylesterase isozymes: involvement of CYP2E1 and hydrolase A1, Toxicol. Appl. Pharmacol., 2012, 146, 245–254 CrossRef PubMed.
- P. Wu, C. Cai and X. Shen, et al., Formation of ethyl carbamate and changes during fermentation and storage of yellow rice wine, Food Chem., 2014, 152, 108–112 CrossRef CAS PubMed.
- D. Chen, Y. Ren and Q. Zhong, et al., Ethyl carbamate in alcoholic beverages from China: levels, dietary intake, and risk assessment, Food Control, 2017, 72, 283–288 CrossRef CAS.
- J. Liu, G. A. Zhao and Y. Xu, Directly removal of ethyl carbamate in Chinese rice wine, J. Food Sci. Biotechnol., 2012, 21, 171–176 Search PubMed.
- L. S. Lim and K. G. Lee, Development and validation of analytical methods for ethyl carbamate in various fermented foods, Food Chem., 2011, 126, 1373–1379 CrossRef.
- D. W. Lachenmeier, F. Kanteres and T. Kuballa, et al., Ethyl Carbamate in Alcoholic Beverages from Mexico (Tequila, Mezcal, Bacanora, Sotol) and Guatemala (Cuxa): Market Survey and Risk Assessment, Int. J. Environ. Res. Public Health, 2009, 6, 349 CrossRef CAS PubMed.
- A. Bortoletto and A. Alcarde, Assessment of Ethyl Carbamate Contamination in Cachaça (Brazilian Sugar Cane Spirit), Beverages, 2016, 2, 28 CrossRef.
- J. C. B. Júnior, R. C. S. Mendonca, J. M. A. T. K. Pereira, J. A. M. Pereira and N. F. F. Soares, Ethyl carbamate determination by gas chromatography-mass spectrometry at different stages of production of a traditional Brazilian spirit, Food Chem., 2011, 129, 1383–1387 CrossRef.
- Z. Huang, X. D. Pan, P. G. Wub, Q. Chen, J. L. Han and X. H. Shen, Validation (in-house and collaboratory) of the quantification method for ethyl carbamate in alcoholic beverages and soy sauce by GC-MS, Food Chem., 2013, 141, 4161–4165 CrossRef CAS PubMed.
- R. R. Madrera and B. S. Valles, Determination of ethyl carbamate in cider spirits by HPLC-FLD, Food Control, 2009, 20, 139–143 CrossRef CAS.
- G. H. Li, Q. D. Zhong, D. B. Wang, X. Y. Zhang, H. B. Gao and S. G. Shen, Determination and formation of ethyl carbamate in Chinese spirits, Food Control, 2015, 56, 169–176 CrossRef CAS.
- E. Deák, A. Gyepes, E. Stefanovits-Banyai and M. Dernovics, Determination of ethyl carbamate in palinka spirits by liquid chromatography-electrospray tandem mass spectrometry after derivatization, Food Res. Int., 2010, 43, 2452–2455 CrossRef.
- X. H. Liang and G. L. Zhao, Review of sample preparation in determination of ethyl carbamate levels of alcoholic beverages, China Brew., 2009, 209, 1–4 Search PubMed.
- S. J. Xiao, S. W. Yu, S. J. Gao and H. X. Guo, Research progress of molecular imprinting technology, Adv. Mater. Res., 2013, 750–752, 1678–1681 Search PubMed.
- F. Yemis, P. Alkan, B. Yenigül and M. Yenigül, Molecularly imprinted polymers and their synthesis by different methods, Polym. Polym. Compos., 2013, 21, 145–150 CAS.
- M. Xue, A. Wang and Y. Wang, et al., Application of molecularly imprinted solid phase extraction for determination of estrogens in river water, milk and urine samples, Chin. J. Anal. Chem., 2011, 39, 793–798 CAS.
- M. Guo, X. G. Zhang, Y. L. Zheng and D. H. Huang, Synthesis of switchable intelligent molecularly imprinted polymers with selective adsorption of ethyl carbamate and their application in electrochemical sensor analysis, RSC Adv., 2018, 8, 25636–25644 RSC.
- E. N. Ndunda and B. Mizaikoff, Molecularly imprinted polymers for the analysis and removal of polychlorinated aromatic compounds in the environment: a review, Analyst, 2016, 141, 3141–3156 RSC.
- J. Alenus, A. Ethirajan, F. Horemans and A. Weustenraed, et al., Molecularly imprinted polymers as synthetic receptors for the QCM-D-based detection of l-nicotine in diluted saliva and urine samples, Anal. Bioanal. Chem., 2013, 405, 6479–6487 CrossRef CAS PubMed.
- S. Ncube, G. Lekoto and E. Cukrowska, et al., Development and optimisation of a novel three-way extraction technique based on a combination of Soxhlet extraction, membrane assisted solvent extraction and a molecularly imprinted polymer using sludge polycyclic aromatic hydrocarbons as model compounds, J. Sep. Sci., 2017, 41, 918 CrossRef PubMed.
- X. Liu, P. Lv and G. Yao, et al., Selective degradation of ciprofloxacin with modified NaCl/TiO2 photocatalyst by surface molecular imprinted technology, Colloids Surf., A, 2014, 441, 420–426 CrossRef CAS.
- L. Chaput, Z. Marton, P. Pineau, L. Domon, V. Tran and M. Graber, Enhancing the enantioselectivity of CALB by substrate imprinting: a combined experimental and molecular dynamics simulation model study, J. Mol. Catal. B: Enzym., 2012, 84, 55–61 CrossRef CAS.
- H. F. Li, C. G. Xie, S. Q. Li and K. Xu, Electropolymerized molecular imprinting on gold nanoparticle-carbon nanotube modified electrode for electrochemical detection of triazophos, Colloids Surf., B, 2012, 89, 175–181 CrossRef CAS PubMed.
- A. L. Jenkins, M. W. Ellzy and L. C. Buettner, Molecularly imprinted polymer sensors for detection in the gas, liquid, and vapor phase, J. Mol. Recognit., 2012, 25, 330–335 CrossRef CAS PubMed.
- T. T. Wen, C. Xue and Y. Li, et al., Reduced graphene oxide-platinum nanoparticles composites based imprinting sensor for sensitively electrochemical analysis of 17β-estradiol, J. Electroanal. Chem., 2012, 682, 121–127 CrossRef CAS.
- V. Suryanarayanan, C. T. Wu and K. C. Ho, Molecularly imprinted electrochemical sensors, Electroanalysis, 2010, 22, 1795–1811 CrossRef CAS.
- B. B. Prasad, R. Madhuri, M. P. Tiwari and P. S. Sharma, Imprinting molecular recognition sites on multiwalled carbon nanotubes surface for electrochemical detection of insulin in real samples, Electrochim. Acta, 2010, 55, 9146–9156 CrossRef CAS.
- Z. Z. Wu, E. B. Xu, J. P. Li, J. Long, A. Q. Jiao and Z. Y. Jin, Highly sensitive determination of ethyl carbamate in alcoholic beverages by surface-enhanced Raman spectroscopy combined with a molecular imprinting polymer, RSC Adv., 2016, 6, 109442–109452 RSC.
- P. Kanyong, S. Rawlinson and J. Davis, A voltammetricsensor based on chemically reduced graphene oxide-modified screen-printed carbon electrode for the simultaneous analysis of uric acid, ascorbic acid and dopamine, Chemosensors, 2016, 4, 25–36 CrossRef.
- X. Zhao, J. Zuo and S. Qiu, et al., Reduced graphene oxidemodified screen-printed carbon (rGO-SPCE)-based disposable electrochemical sensor for sensitive and selective determination of ethyl carbamate, Food Anal. Methods, 2017, 10, 3329–3337 CrossRef.
- K. Calfuman, M. J. Aguirre and D. Villagra, et al., Nafion/tetraruthenated porphyrin glassy carbon-modified electrode: characterization and voltammetric studies of sulfite oxidation in water- ethanol solutions, J. Solid State Electrochem., 2010, 14, 1065–1072 CrossRef CAS.
- D. W. Lachenmeier, T. Kuballa and M. C. P. Lima, et al., Ethyl carbamate analysis in German fruit spirits and Brazilian sugarcane spirits (cachaca): improved sample cleanup with automated parallel evaporation, Dtsch. Lebensm.-Rundsch., 2009, 105, 507–512 CAS.
- D. W. Lachenmeier, U. Nerlich and T. Kuballa, Automated determination of ethyl carbamate in stone-fruit spirits using headspace solid-phase microextraction and gas chromatography-tandem mass spectrometry, J. Chromatogr. A, 2006, 1108, 116–120 CrossRef CAS PubMed.
- I. C. C. Nóbrega, G. E. Pereira and M. Silva, et al., Improved sample preparation for GC-MS-SIM analysis of ethyl carbamate in wine, Food Chem., 2015, 177, 23–28 CrossRef PubMed.
- J. M. Leça, V. Pereira, A. C. Pereira and J. C. Marques, Rapid and sensitive methodology for determination of ethyl carbamate in fortified wines using microextraction by packed sorbent and gas chromatography with mass spectrometric detection, Anal. Chim. Acta, 2014, 811, 29–35 CrossRef PubMed.
- P. Wu, L. Zhang and X. Shen, et al., Determination of ethyl carbamate in Chinese yellow rice wine by diatomaceous earth extraction and GC/MS method, J. AOAC Int., 2015, 98, 834–838 CrossRef CAS PubMed.
- J. Zhang, L. Xu, Y. Q. Wang and R. H. Lv, Electrochemical sensor for bisphenol A based on molecular imprinting technique and electropolymerization membrane, Chin. J. Anal. Chem., 2009, 37, 1041–1044 CAS.
- W. Xu, X. Li, W. Y. Zhang and X. G. Ying, Preparation and performance of sensing films of molecularly imprinted electrochemical sensor for L-tryptophan, Chem. J. Chinese U., 2012, 33, 2199–2204 CAS.
- N. Q. Li and J. Min, Polarographic study on the non-electroactive complex of scandium-carminic acid, Chin. J. Anal. Chem., 1989, 17, 346–348 CAS.
- S. Y. Dong, C. X. Xue and T. L. Huang, Electrochemical studies of the interaction of clarithromycin with bovine serum albumin, Anal. Sci., 2008, 24, 1087–1091 CrossRef CAS PubMed.
- F. Yin, Y. L. Zhu, Q. J. Xie, Y. Y. Zhang, L. H. Nie and S. Z. Yao, Study of surfactant adsorption onto electropolymerized- phenylenediamine film by using a capacitive sensing method, Analyst, 2002, 127, 262–266 RSC.
- L. Yang, W. Z. Wei, J. J. Xia, H. Tao and P. H. Yang, Capacitive biosensor for glutathione detection based on electropolymerized molecularly imprinted polymer and kinetic investigation of the recognition process, Electroanalysis, 2005, 17, 969–977 CrossRef CAS.
Footnote |
| † Electronic supplementary information (ESI) available. See DOI: 10.1039/c8ra08213h |
| This journal is © The Royal Society of Chemistry 2018 |

