 Open Access Article
Halogeno-substituted indazoles against copper corrosion in industrial pickling process: a combined electrochemical, morphological and theoretical approach†
Yujie Qianga,
Shengtao Zhang *a,
Qin Xiang
 a,
Bochuan Tana,
Wenpo Li*a,
Shijin Chenb and
Lei Guo
 c
c
aSchool of Chemistry and Chemical Engineering, Chongqing University, Chongqing 400044, China. E-mail: stzhang_cqu@163.com; Tel: +86 23 65678934
bBomin Electronics Ltd., Meizhou 514021, China
cSchool of Materials and Chemical Engineering, Tongren University, Tongren 554300, China
First published on 19th November 2018
Abstract
The inhibitive properties of four indazole-based compounds (IA, 4-FIA, 4-CIA, and 4-BIA) on copper corrosion in 0.5 M H2SO4 solution were investigated using electrochemical measurements, surface characterization techniques and molecular modelling methods. Electrochemical tests indicate that the inhibition efficiencies increase with incremental concentration and all halogeno-substituted indazoles (HIAs) possess superior inhibitive ability to native IA. The specific rating of inhibition performance obeys the order: IA < 4-FIA < 4-BIA < 4-CIA. All inhibition efficiencies of HIAs obtained were over 96% in 1 mM, especially, 4-CIA reaches 99.6%. Moreover, the corresponding inhibition mechanism was elucidated via quantum chemical calculations allied to molecular dynamics simulation. In summary, the present study can help us to gain insight into the effect of halogeno-substitution on the inhibition efficiency of the IA molecule.
1 Introduction
Copper and its alloys are widely applied in military, microelectronic, and civilian fields by reason of its good availability, favorable thermal and electrical conductivity, mechanical workability, and relatively noble properties.1–4 In such applications, naturally, a clean surface of copper is required. Therefore, chemical cleaning treatments are used to remove undesired oxides and rust. Among numerous chemical cleaning reagents, the most frequently used is sulfuric acid. Unfortunately, the copper surface is prone to be corroded in the process of cleaning treatment, bringing about a new problem to be solved.An important method of preventing metallic materials from deterioration owing to corrosive attack is the usage of organic inhibitors.5–12 The reported corrosion inhibitors against copper corrosion in sulfuric acidic medium are usually organic compounds containing several heteroatoms (i.e., nitrogen, sulfur, oxygen), electronegative groups, and/or conjugated double bonds.13–17 For instance, Moretti and Guidi tested the inhibitive ability of tryptophan on copper corrosion in 0.5 M H2SO4 via gravimetric and electrochemical measurements.13 The inhibition behaviour of isatin on copper corrosion in sulfuric acid was investigated by Quartarone et al.18 The inhibition capacity of rhodanine-N-acetic acid on corrosion of copper in 0.5 M H2SO4 medium was studied by using electrochemical methods and morphology observation.19 Even so, the main method of exploring inhibitors is still blind filtration nowadays. The complicated and indistinct inhibition mechanism is the major obstacle in designing new organic compounds as corrosion inhibitors.
To alleviate the above problem, molecular dynamics (MD) simulation allied to quantum chemical calculation can be combined to get insight into the inhibition mechanism of organic inhibitor on metal surface at the molecular and atomic level. These computational methods are widely reported as a powerful tool in molecular design of corrosion inhibitor.20–25 The corrosion inhibition mechanism of three triazole derivatives for copper in acid system was investigated by quantum chemical and molecular dynamics approaches by our group.26 The results obtained reveals that the energies of σ-molecular orbitals have a remarkable influence on the adsorption performance of corrosion inhibitor. Wang et al. systematically evaluated the inhibitive properties of two quinoline derivatives namely, 8-nitroquinoline and 8-aminoquinoline, for AA5052 aluminum corrosion using electrochemical experiments in combination with density functional theory (DFT).27 The calculated results indicate that a strong hybridization happens between sp-orbital of Al atoms and p-orbital of the inhibitors. Kokalj et al. studied the binding roles of mercapto, benzene, and methyl groups of imidazoles on copper surface in the corrosion inhibition process by DFT calculation.28 The results well captured the inhibition efficiency trend obtained experimentally, and testify mercapto-substituted imidazoles bond stronger to the copper surface and exhibit weaker trend to form soluble complexes with Cu2+ than non-mercapto imidazoles.
As known that the effective inhibitor in neutral solution always do not function in acid solution owing to the different action mechanism. In this regard, it is meaningful to explore the inhibitors that could take effect in two different corrosive media. In our previous research, we investigated that halogeno-substitution on 1H-indazole (IA) compound can enhance adsorption intensity and inhibition performance of native IA on copper in a neutral chloride solution.29,30 Thus, in this work, we further gave attention to seek experimentally and computationally the inhibition performance of IA and three halogeno-substituted indazoles (HIAs), 4-fluoro-1H-indazole (4-FIA), 4-chloro-1H-indazole (4-CIA), and 4-bromo-1H-indazole (4-BIA), on the corrosion of copper in 0.5 M H2SO4, which has never been reported before. Potentiodynamic polarization measurement, electrochemical impedance spectroscopy (EIS), field emission scanning electron microscope (FE-SEM), and atomic force microscope (AFM) were adopted to assess the inhibition properties and observe the microstructure of the copper surface. After that, the corresponding inhibition mechanism was captured by theoretical calculation approaches including DFT calculation and molecular dynamics (MD) simulation for protonated state of inhibitors considering solvent effect. Actually, the calculated results shed more light into the molecular reactivity of IA-based inhibitors and the interaction mechanism between these compounds and copper surface in acid solution.
2 Experimental section
2.1 Preparation of materials and solutions
Testing specimens were cut from a pure copper sheet (99.9%). For electrochemical tests, the copper coupons (1.00 × 1.00 × 1.00 cm) were sealed in epoxy, leaving a 1 cm2 area exposed to the aggressive solution. Prior to each experiment, the copper specimens were abraded consecutively with a series of emery papers from 400 to 2000 grit, washed with ultrapure water and acetone, dried at room temperature. Fig. 1 shows the investigated compounds, IA, 4-FIA, 4-CIA, and 4-BIA, which were purchased from Tansool at 99% purity and used as received. The 0.5 M H2SO4 solution diluted from analytical grade 98% H2SO4 was treated as blank. Then aggressive solution was prepared by 0.5 M sulfuric acid solution without and with various concentrations of studied inhibitors.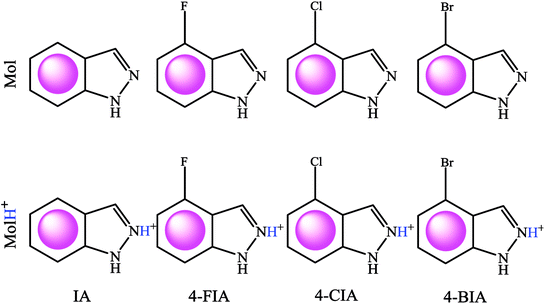 | ||
| Fig. 1 Lewis structures of IA, 4-FIA, 4-CIA, and 4-BIA molecules in neutral (Mol, top row), and protonated cationic (MolH+, bottom row) forms. | ||
2.2 Electrochemical test
CHI 760E electrochemical station with a three-electrode system was used to perform the electrochemical measurement. Copper specimen as the working electrode (WE), a big platinum plate as the counter electrode, and a saturated calomel electrode (SCE) as the reference electrode. At first, the WE was immersed in the test solution for 1200 s at the open circuit potential (EOCP) to obtain a steady state condition. Then EIS was conducted on the WE at the EOCP in the frequency ranging from 100 kHz to 0.01 Hz with a 10 mV disturbance signal. The EIS data were fitted by Zsimpwin. The inhibition efficiency (IE, %) was obtained from the polarization resistance Rp (Rp = Rf + Rct) as follows,
 | (1) |
 | (2) |
2.3 Morphology analysis
The morphology of copper samples before and after exposure to 0.5 M H2SO4 with and without 1 mM studied inhibitors at 298 K were observed by AFM (MFP-3D-BIO, Asylum Research, America) and FE-SEM (JEOL-JSM-7800F, JEOL Ltd, Japan).2.4 Computational details
Quantum chemical calculation was conducted using Gaussian 03W software. All of the inhibitor molecules in protonated cationic form shown in Fig. 1 were fully optimized using the B3LYP method for DFT level with a 6-311++G(d, p) basis set in aqueous phase. Then, some parameters, including the energy of the lowest unoccupied molecular orbital (ELUMO), the energy of the highest occupied molecular orbital (EHOMO), energy gap ΔE (ΔE = ELUMO − EHOMO), and dipole moment (μ) were obtained, respectively.The MD simulation of IA-based compounds on Cu (111) surface was studied by using the Forcite module from Accelrys Inc. The protonated inhibitor molecules and copper surface was assumed in a simulation box with a COMPASS force field at periodic boundary condition. Both 1 inhibitor and 300 H2O molecules were allowed to freely interact with the “frozen” Cu substrate. A NVT canonical ensemble with a time step of 1 fs and simulation time of 500 ps was implemented in this simulation. The interaction energy (Einteract) between inhibitor molecules and Cu substrate could be given by:31
| Einteract = Etot − (Esubs + Einh) | (3) |
| Ebinding = −Einteract | (4) |
3 Results and discussion
3.1 Potentiodynamic polarization curves
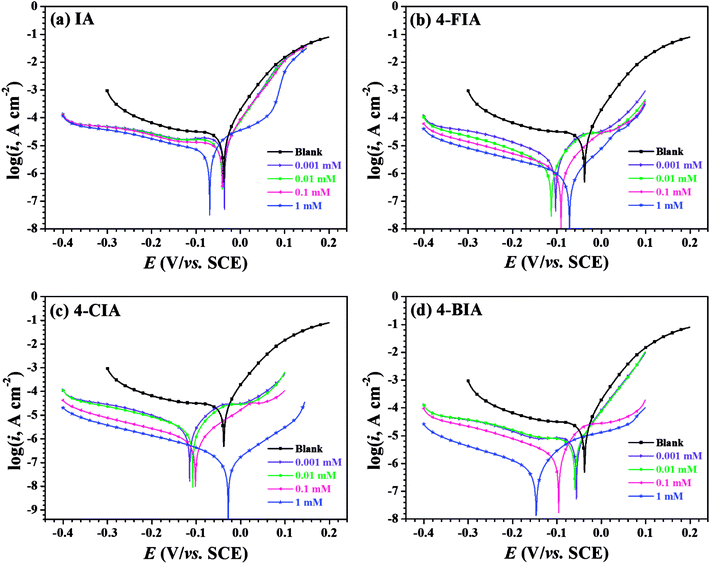
Fig. 2 shows the OCP–time curves for copper in 0.5 M H2SO4 solution containing various concentrations of the investigated inhibitors at 298 K. As seen that with the addition of these inhibitors, the Eocp values move to negative values. Fig. 3 illustrates Tafel curves of copper in 0.5 M H2SO4 with various concentrations of the investigated inhibitors. The relevant electrochemical parameters, including corrosion current density (icorr), corrosion potential (Ecorr), anodic Tafel slope (βa), cathodic Tafel slope (βc), and inhibition efficiency (IE) are obtained and shown in Table 1. These parameters and are shown in Table 1, respectively. As seen in Fig. 3 that all of the curves move to lower current densities in the presence of four inhibitors, compared to the uninhibited solution. This phenomenon is more pronounced at higher inhibitor concentrations, indicating that the addition of all studied compounds in whole concentration range impedes the corrosion rate of copper.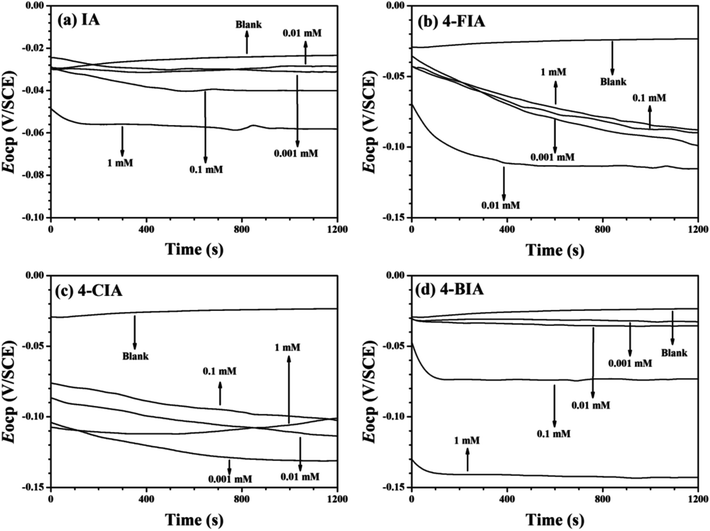 | ||
| Fig. 2 OCP–time curves for copper in 0.5 mol L−1 H2SO4 solution containing different concentrations of the investigated inhibitors at 298 K, (a) IA, (b) 4-FIA (c) 4-CIA, (d) 4-BIA. | ||
| C (mM) | Ecorr (mV/SCE) | icorr (μA cm−2) | SDa | βc (mV dec−1) | βa (mV dec−1) | η (%) |
|---|---|---|---|---|---|---|
| a SD, standard deviation of 3 independent measurements. | ||||||
| Blank | −38 | 28.87 | 3.61 | −483.1 | 42.0 | — |
![[thin space (1/6-em)]](https://www.rsc.org/images/entities/char_2009.gif) |
||||||
| IA | ||||||
| 0.001 | −36 | 22.68 | 3.12 | −644.2 | 43.0 | 21.4 |
| 0.01 | −41 | 15.82 | 2.03 | −827.6 | 42.8 | 45.2 |
| 0.1 | −40 | 12.53 | 1.14 | −671.1 | 40.7 | 56.6 |
| 1 | −69 | 9.70 | 1.29 | −264.1 | 190.2 | 66.4 |
![[thin space (1/6-em)]](https://www.rsc.org/images/entities/char_2009.gif) |
||||||
| 4-FIA | ||||||
| 0.001 | −103 | 4.81 | 0.56 | −181.0 | 71.1 | 83.3 |
| 0.01 | −113 | 2.83 | 0.33 | −167.3 | 65.9 | 90.2 |
| 0.1 | −91 | 1.88 | 0.27 | −213.4 | 67.3 | 93.5 |
| 1 | −72 | 0.90 | 0.13 | −159.7 | 66.9 | 96.9 |
![[thin space (1/6-em)]](https://www.rsc.org/images/entities/char_2009.gif) |
||||||
| 4-CIA | ||||||
| 0.001 | −115 | 3.37 | 0.44 | −167.0 | 69.1 | 88.3 |
| 0.01 | −108 | 2.72 | 0.25 | −151.4 | 62.0 | 90.6 |
| 0.1 | −102 | 1.06 | 0.16 | −169.8 | 76.8 | 96.3 |
| 1 | −28 | 0.12 | 0.02 | −123.9 | 81.6 | 99.6 |
![[thin space (1/6-em)]](https://www.rsc.org/images/entities/char_2009.gif) |
||||||
| 4-BIA | ||||||
| 0.001 | −56 | 8.63 | 0.74 | −313.3 | 49.4 | 70.1 |
| 0.01 | −59 | 7.64 | 0.88 | −312.6 | 49.0 | 73.5 |
| 0.1 | −96 | 2.55 | 0.32 | −187.3 | 51.1 | 91.2 |
| 1 | −147 | 0.83 | 0.09 | −183.0 | 74.8 | 97.1 |
Specifically, all cathodic branches of the polarization curves in the presence of inhibitors are parallel with that of blank, which indicates that the mechanism of cathodic reaction is not changed by these organic compounds and the corrosion processes are retarded by reducing the reaction rates.32 For another, the anodic branches of obtained polarization curves appear more complicated. At low inhibitor concentrations of IA and 4-BIA where the anodic curves vary slightly, the geometric blocking effect dominates on the inhibition performance, while in the high concentration range of IA and 4-BIA, the active blocking effect plays a main role by the formation of anchored adsorption films.33 Especially, 4-FIA and 4-CIA present active blocking mechanism in the whole concentration range.
As seen in Table 1, except negative movement of the Ecorr values for 1 mM 4-BIA, all of the displacements are less than 85 mV compared with the blank. It can be deduced that 4-BIA acts as a modest cathodic inhibitor, while other inhibitors were mixed-type inhibitors.34 The cathodic Tafel slope (βc) values have a little difference, whereas some βa values change a lot with the addition of the inhibitors, which indicate the complicated anodic electrode process mentioned above. Additionally, the icorr values shown in Table 1 decrease significantly with increasing inhibitor concentration, leading to the simultaneous increase of inhibition efficiency up to 66.4% (IA), 96.9% (4-FIA), 99.6% (4-CIA), and 97.1% (4-BIA), respectively. Thus, it is worth mentioning that the efficiencies of all HIAs are far more than IA inhibitor and 4-CIA are greatest. Considering the multiplicity of adsorption centres in studied HIAs than IA molecule itself, it is reasonable to deduce that halogeno-substitution strengthen the adherence of the inhibitor film.
3.2 EIS measurements
The relevant Nyquist diagram for copper in 0.5 M H2SO4 medium with and without various concentrations of studied IA-based inhibitors are shown in Fig. 4. For the blank solution, Fig. 4 shows a depressed capacitive semicircle in high frequency (HF) followed by a straight line in low frequency (LF) range. Generally, the semicircle is attributed to a charge-transfer process of the copper dissolution,35 while the LF straight line is Warburg impedance due to either the diffusion of dissolved oxygen from bulk solution to the copper surface or the transport of corrosive particles.36 The diameter of the capacitive arc increases slightly by introducing IA, in comparison with that obtained in the blank, representing an inferior inhibition performance of IA. Nevertheless, the addition of three HIAs remarkably increase the diameter of the curves, which is associated with high inhibitive ability. It can be inferred that more stable protective films of HIAs are formed on copper surface than that of IA. The capacitive loops increase continuously with the increasing inhibitor concentration, indicating that the inhibitor films are gradually compact. Besides, Warburg impedance disappears in high concentrations of three HIAs, which suggests that these compounds strongly retard the diffusion process.5 On the other hand, there is still diffusive impedance for IA and low concentration of HIAs owing to the relatively loose inhibitor layer in this case.37 The results reveal the formation of the inhibitor-adsorption films on surface of copper and their contribution to the increase of anti-corrosive quality.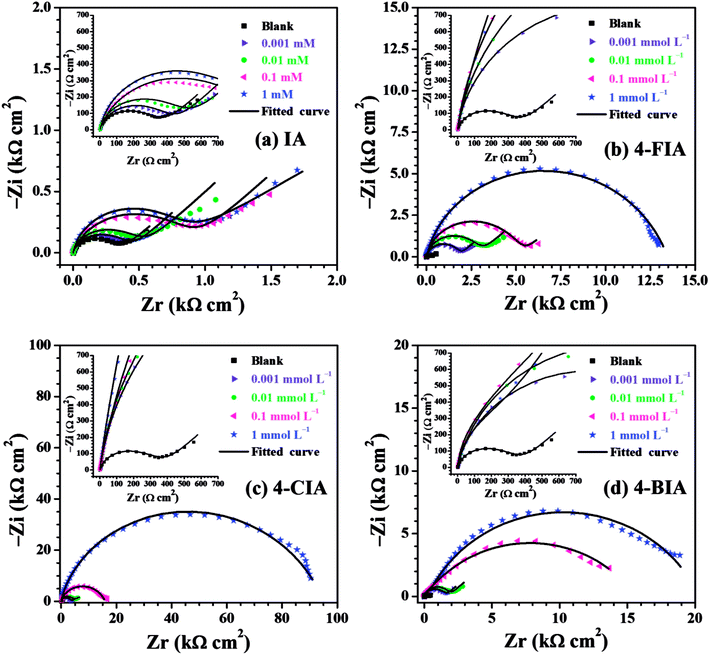 | ||
| Fig. 4 Nyquist plots for the copper electrode in 0.5 M H2SO4 solution without and with different concentrations of (a) IA, (b) 4-FIA (c) 4-CIA, (d) 4-BIA at 298 K. | ||
From Bode plots (Fig. 5), with the addition and increasing concentration of IA, the impedance modulus increases compared to that obtained in the blank solution, while this phenomenon is clearer for 4-FIA, 4-CIA, and 4-CIA. Besides, the maximum phase angle increases with increasing inhibitor concentration and HIAs harbour higher value of phase angle than IA. These results manifests higher inhibitive ability of HIAs than single IA for copper corrosion.
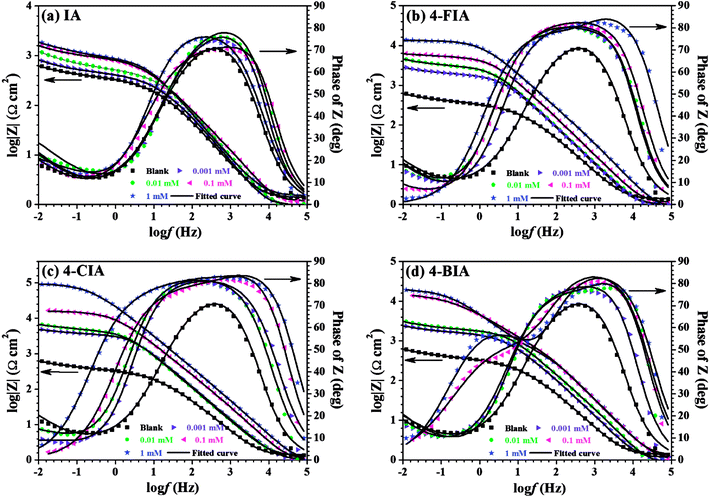 | ||
| Fig. 5 Bode graphs of the measured impedance shown in Fig. 3, (a) IA, (b) 4-FIA (c) 4-CIA, (d) 4-BIA. | ||
The equivalent circuits shown in Fig. 6 were used to fit the impedance data in present study. CPEf and CPEdl represent constant phase angle elements, which are related to double layer capacitance (Cdl), film capacitance (Cf), respectively. The use of CPE instead a pure capacitor introduces non-ideal dielectric behaviour for the inhomogeneous electrode surface.38,39 The obtained impedance parameters including charge transfer resistance (Rct), film resistance (Rf), Warburg impedance (W), Cdl, Cf, and so on are summarized in Table 2. The Cdl and Cf values are calculated as follows,40
| C = Y0(wmax)n−1 | (5) |
| C (mM) | Rf (Ω cm2) | Rct (kΩ cm2) | Rp (kΩ cm2) | Cf (μF cm−2) | n1 | Cdl (μF cm−2) | n2 | W (× 10−2 Ω cm2 s1/2) | η (%) | χ2 (× 10−2) |
|---|---|---|---|---|---|---|---|---|---|---|
| Blank | 7.8 | 0.40 | 0.41 ± 0.02 | 33.2 | 0.93 | 43.0 | 0.43 | 1.31 | — | 0.62 |
![[thin space (1/6-em)]](https://www.rsc.org/images/entities/char_2009.gif) |
||||||||||
| IA | ||||||||||
| 0.001 | 13.6 | 0.48 | 0.49 ± 0.02 | 19.4 | 1 | 31.4 | 0.57 | 0.87 | 16.3 | 0.54 |
| 0.01 | 29.3 | 0.51 | 0.54 ± 0.03 | 15.9 | 1 | 20.5 | 0.57 | 0.49 | 24.1 | 0.83 |
| 0.1 | 30.1 | 0.88 | 0.91 ± 0.02 | 10.5 | 1 | 17.7 | 0.67 | 0.47 | 54.9 | 1.16 |
| 1 | 43.2 | 0.92 | 0.96 ± 0.03 | 9.0 | 0.98 | 16.1 | 0.56 | 0.76 | 57.3 | 0.97 |
![[thin space (1/6-em)]](https://www.rsc.org/images/entities/char_2009.gif) |
||||||||||
| 4-FIA | ||||||||||
| 0.001 | 40.3 | 1.79 | 1.83 ± 0.05 | 14.2 | 1 | 13.5 | 0.72 | 0.32 | 77.6 | 0.66 |
| 0.01 | 39.5 | 2.89 | 2.93 ± 0.07 | 12.9 | 1 | 13.6 | 0.76 | 0.20 | 86.0 | 0.53 |
| 0.1 | 41.8 | 5.25 | 5.29 ± 0.06 | 8.2 | 1 | 8.7 | 0.71 | 0.31 | 92.2 | 0.49 |
| 1 | 247.1 | 13.2 | 13.5 ± 0.10 | 4.5 | 1 | 6.9 | 0.73 | — | 97.0 | 1.02 |
![[thin space (1/6-em)]](https://www.rsc.org/images/entities/char_2009.gif) |
||||||||||
| 4-CIA | ||||||||||
| 0.001 | 58.8 | 3.24 | 3.30 ± 0.04 | 18.0 | 0.92 | 19.2 | 0.74 | 0.15 | 87.6 | 1.14 |
| 0.01 | 102.4 | 4.72 | 4.82 ± 0.04 | 17.3 | 0.93 | 16.5 | 0.72 | 0.40 | 91.5 | 0.87 |
| 0.1 | 210.7 | 15.7 | 15.9 ± 0.09 | 4.9 | 1 | 7.8 | 0.70 | — | 97.4 | 0.90 |
| 1 | 270.3 | 95.2 | 95.5 ± 0.18 | 3.1 | 1 | 6.6 | 0.72 | — | 99.6 | 0.45 |
![[thin space (1/6-em)]](https://www.rsc.org/images/entities/char_2009.gif) |
||||||||||
| 4-BIA | ||||||||||
| 0.001 | 41.2 | 1.55 | 1.59 ± 0.03 | 11.2 | 1 | 15.9 | 0.66 | 0.37 | 74.2 | 0.77 |
| 0.01 | 85.1 | 1.78 | 1.87 ± 0.03 | 7.7 | 1 | 10.3 | 0.74 | 0.26 | 78.1 | 0.82 |
| 0.1 | 142.1 | 14.9 | 15.0 ± 0.07 | 6.0 | 0.97 | 9.2 | 0.71 | — | 97.3 | 1.10 |
| 1 | 174.0 | 19.7 | 19.9 ± 0.10 | 6.1 | 0.97 | 8.7 | 0.73 | — | 97.9 | 0.98 |
As seen in Table 2 that the addition of the four inhibitors increases both the Rct and Rf values and increasing concentration enhance this trend, indicating that the formation of IAs-adsorption films mitigate the process of charge transfer. Impressively, this phenomenon is remarkable for three HIAs than original IA, implying the more stable films of HIAs. Furthermore, the values of Cf and Cdl decrease with the addition of four IA-based organics, which is owing to the replacement of water molecules by investigated inhibitor molecules.41 Accordingly, the IE values of these IA-based compounds increase with increasing inhibitor concentration and reach 57.3% for IA, 97.0% for 4-FIA, 99.6% for 4-CIA, and 97.9% for 4-BIA at 1 mM, respectively. The order of inhibition ability agrees well with the results gained from the polarization curves and reveals that HIAs provide more effective protection against copper corrosion in 0.5 M H2SO4 medium than native IA. Moreover, the maximum IE value of 4-CIA are higher than that of the corrosion inhibitors in same condition reported before, such as 81% of indole-3-carboxylic acid,18 94.0% of rhodanine-N-acetic acid,19 98.3% of cyproconazole,36 and 93.7% of arginine.23
3.3 Surface observation
The SEM micrographs of copper surface before and after 32 h immersion in 0.5 M H2SO4 in the absence and presence of 1 mM IA-based inhibitors at 298 K are shown in Fig. 7. The freshly polished copper surface (Fig. 7a) is smooth, whereas the uninhibited copper surface (Fig. 7b) shows obvious deterioration due to the aggressive attack by corrosive particles. A slightly smoother surface is obtained in Fig. 7c in the presence of IA, whereas Fig. 7(d–f) with the addition of HIAs exhibit quite smooth surfaces as expected. Particularly, the surface protected by 4-CIA is the flattest surface and nearly same as the surface in Fig. 7a. These observations indicate that inhibitor films are formed on surface of copper, therefore inhibited surface has lower permeability for aggressive particles than uninhibited copper surface. Consequently, the copper surface was effectively protected by HIAs, especially 4-CIA, which supports the electrochemical results convincingly.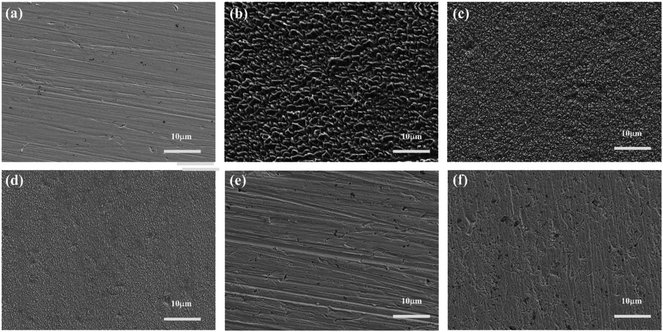 | ||
| Fig. 7 FE-SEM images of (a) freshly polished copper specimen and the specimens immersed in 0.5 M H2SO4 solution (b) without and with 1 mM (c) IA, (d) 4-FIA, (e) 4-CIA, (f) 4-BIA for 32 h at 298 K. | ||
Recent years, AFM has been widely applied in corrosion field to observe surface appearance at the nano- to microscale level.34,42–45 The 3D AFM images and corresponding height profiles of unprotected and protected copper surfaces with 1 mM IA and 4-CIA respectively in 0.5 M H2SO4 solution at 298 K for 8 h are shown in Fig. 8–10. For copper surfaces protected by 4-FIA and 4-BIA respectively, the corresponding AFM images are given in Fig. S1 and S2.† It is noticeable in Fig. 8a that corroded copper sample shows considerably rough structure with deep and large pits owing to the aggressive attack. This appearance can be further evidenced by the height profile in Fig. 8b, which exhibits large peaks and valleys about 200 nm height. Moreover, the average roughness (Ra) of the corroded copper surface shown in Fig. 8b is 45.5 nm. In the presence of IA (Fig. 9), the surface becomes slightly flat and relevant Ra decreases to 38.9 nm, while the graph of 4-CIA (Fig. 10) provides a more uniform surface and has a slight fluctuation within 30 nm. As Fig. S1 and S2† show, with the addition of 4-FIA and 4-BIA, the AFM graph are obtained exactly like that of 4-CIA. Besides, the corresponding values of Ra after introducing these HIAs are reduced to 14.5 nm for 4-FIA, 10.5 nm for 4-CIA, and 11.8 nm for 4-BIA. These results suggest that the inhibitive ability of the studied compounds obeys the rank of 4-CIA > 4-BIA > 4-FIA > IA, which is consistent with the order of electrochemical inhibition efficiencies above.
 | ||
| Fig. 8 (a) 3D AFM graph and (b) height profile of copper specimen after immersion in 0.5 M H2SO4 solution without inhibitors for 8 h at 298 K. | ||
 | ||
| Fig. 9 (a) 3D AFM graph and (b) height profile of copper specimen after immersion in 0.5 M H2SO4 solution in the presence of 1 mM IA for 8 h at 298 K. | ||
 | ||
| Fig. 10 (a) 3D AFM graph and (b) height profile of copper specimen after immersion in 0.5 M H2SO4 solution in the presence of 1 mM 4-CIA for 8 h at 298 K. | ||
FE-SEM and AFM observation combined with the electrochemical results demonstrate that denser protective barriers could be formed by HIAs than IA, so that copper is availably protected. Particularly, 4-CIA adsorption-film possessing the highest stability acts as the most powerful shield for corrosion of copper.
3.4 Quantum chemical study
The optimized structures, the lowest unoccupied molecular orbital (LUMO), and the highest occupied molecular orbital (HOMO) density distribution of studied IA-based organics for protonated species are presented in Fig. 11. Indeed, some of the calculated quantum chemical properties, including EHOMO, ELUMO, as well as ΔE are shown graphically in Fig. 12. Fig. 11 shows that electronic density distributions of the four IA-based compounds are concentrated evenly over the whole molecule, which could be related to the high electron densities of the –N–N![[double bond, length as m-dash]](https://www.rsc.org/images/entities/char_e001.gif) C– group, benzene ring, and halogen atoms. This kind of system infers that a flat-adsorption configuration may obtain to gain the largest protective area for copper. It is recognized that ELUMO represents the electron-receiving ability of the organic molecule, and a low value of ELUMO is an index of the strong electron-receiving tendency.46 EHOMO, on the other hand, signifies an electron-donating ability of a molecule, and a high value of EHOMO illustrates that the inhibitor tends to donate electrons to a suitable acceptor with an empty molecular orbital and low ELUMO.46 The lower ELUMO and higher EHOMO values of HIA molecules shown in Fig. 12, implying stronger electron acceptance and donation abilities of these molecules, thus owning processing higher inhibition efficiency than IA. Generally, a lower ΔE means greater adsorption on metal surface.47 The calculated ΔE values of studied inhibitors follow the order: 4-BIA < 4-CIA < 4-FIA < IA, which disagree with the electrochemical results to some extent. This phenomenon can be interpreted that the largest radius of Br influences its adsorption strength and thus reduces its inhibition performance.
C– group, benzene ring, and halogen atoms. This kind of system infers that a flat-adsorption configuration may obtain to gain the largest protective area for copper. It is recognized that ELUMO represents the electron-receiving ability of the organic molecule, and a low value of ELUMO is an index of the strong electron-receiving tendency.46 EHOMO, on the other hand, signifies an electron-donating ability of a molecule, and a high value of EHOMO illustrates that the inhibitor tends to donate electrons to a suitable acceptor with an empty molecular orbital and low ELUMO.46 The lower ELUMO and higher EHOMO values of HIA molecules shown in Fig. 12, implying stronger electron acceptance and donation abilities of these molecules, thus owning processing higher inhibition efficiency than IA. Generally, a lower ΔE means greater adsorption on metal surface.47 The calculated ΔE values of studied inhibitors follow the order: 4-BIA < 4-CIA < 4-FIA < IA, which disagree with the electrochemical results to some extent. This phenomenon can be interpreted that the largest radius of Br influences its adsorption strength and thus reduces its inhibition performance.
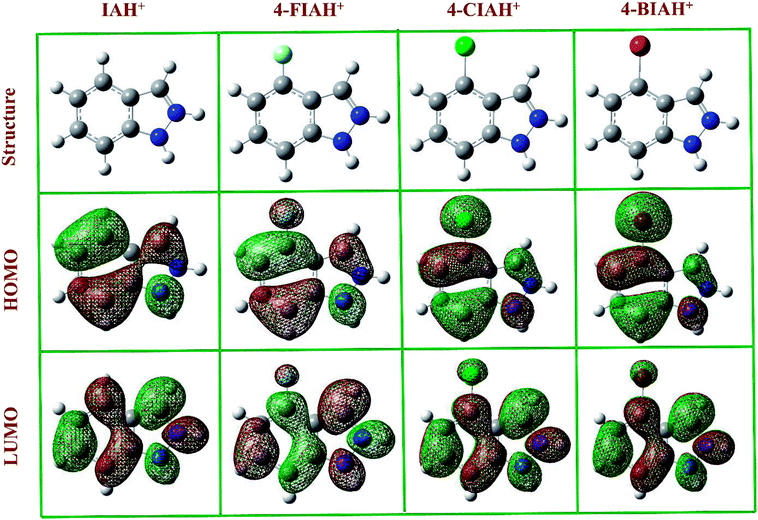 | ||
| Fig. 11 The optimized structures, frontier orbital density distributions of four protonated IA-based compounds in liquid phase. | ||
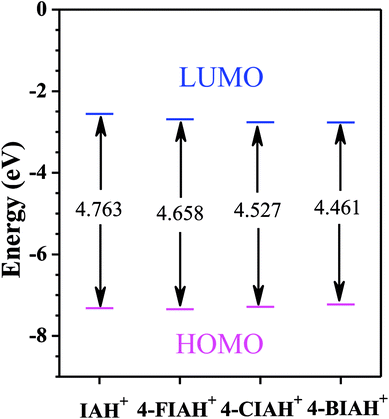 | ||
| Fig. 12 The diagram of calculated parameters EHOMO, ELUMO, and ΔE for protonated species of studied inhibitor molecules in liquid phase. | ||
There is lack of agreement on the correlation between μ and inhibitive ability.48 According to some authors, a low μ value will favour accumulation of the inhibitor on metal surface, resulting in an increase of inhibition effectiveness.41 However, others proposed that a high value of μ can enhance the adsorption strength on the surface of metal due to high electrical polarity, thus increasing the inhibition efficiency.44 The order of μ values IA (7.227 D) < 4-FIA (9.265 D) < 4-CIA (10.399 D) < 4-BIA (12.491 D) seemly agrees with the latter viewpoint, which is not well accordance with their inhibition efficiencies above. Therefore, the DFT approach failed to explain the corrosion inhibition rating well due to no consideration of the interaction between inhibitor molecules and copper substrate, whereas it still provided useful molecular properties contributing to understand the inhibition mechanism.
3.5 Molecular dynamics simulation
The MD simulation was designed to predict the most stable adsorption configuration and the binding strength of the four protonated IA-based compounds on copper substrate in order to further explain the corresponding mechanism of corrosion inhibition. The side and top views of the equilibrium adsorption configurations of the four investigated inhibitor molecules on Cu (111) surface are depicted in Fig. 13. It can be seen that all of the four inhibitors adsorb tightly onto the copper surface with a parallel orientation owing to the distribution of FMO densities on whole molecules. This implies that the coordination bond could form through HOMO of the inhibitors to unfilled sp3 non-equivalent hybrid orbital of Cu (electron-donation) and the transfer of electrons from the 3d-orbital of Cu to the vacant orbital of inhibitor molecules (antibonding).49,50 Importantly, the parallel adsorption configuration can control the aggressive attack availably by minimizing the contact area between Cu and corrosive particles.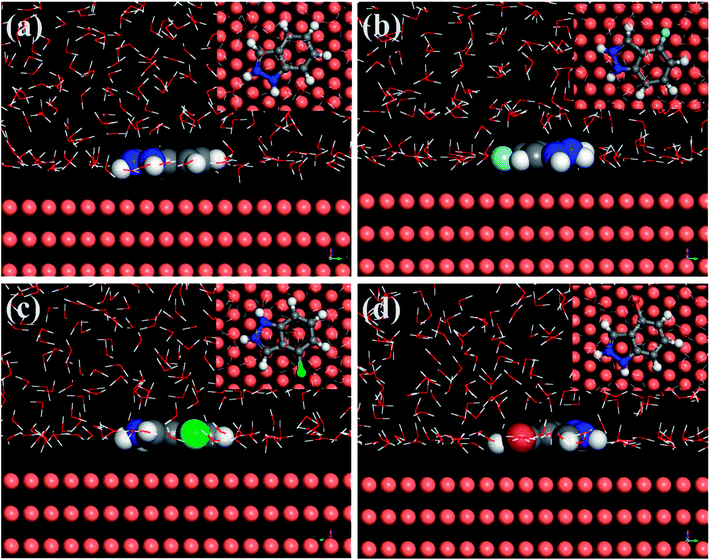 | ||
| Fig. 13 Equilibrium configurations for the adsorption of protonated inhibitor molecules on the Cu (111) surface (inset: on-top views), (a) IAH+, (b) 4-FIAH+, (c) 4-CIAH+, (d) 4-BIAH+. | ||
Generally, organic molecules adsorb on a metal surface blocking the cathodic and anodic sites. Hence, more negative the interaction energy or more positive the binding energy between the adsorbed molecule and the metal surface is, higher is the inhibition efficiency.23,51 The calculated Ebinding values are 230.21 kJ mol−1 for IAH+, 239.84 kJ mol−1 for 4-FIAH+, 255.29 kJ mol−1 for 4-CIAH+, and 253.32 kJ mol−1 for 4-BIAH+. It is apparent that there is well positive correlation between the experimental inhibition efficiencies of the studied IA-based inhibitors and the relevant binding energies. In particular, protonation of the organic molecules gives rise to slightly larger Ebinding values than those obtained for relevant neutral inhibitor molecules, but the two forms follow the same trend for the parameter.30 Thus, the favourable verification and explanation for the effectiveness of investigated inhibitors for copper corrosion in two different media, implying that such method can be applied as a computational protocol to convincingly forecast the inhibitive performance rating of organic inhibitors.
4 Conclusions
In the case of four IA-based compounds namely IA, 4-FIA, 4-BIA, and 4-BIA as effective inhibitors for copper corrosion in 0.5 M H2SO4 medium, systematic and comprehensive means were employed to investigate the inhibitive ability and the corresponding mechanism. The following points can be emphasized:(1) The polarization curve results reveal that 4-BIA acts as modest cathodic inhibitor, while other inhibitors could be considered as mixed-type inhibitors that suppress both cathodic and anodic reactions.
(2) Electrochemical tests indicate that, the inhibition efficiencies increase with incremental concentration and all HIAs possess superior inhibitive ability than native IA. The specific rating of inhibition performance follows the order: IA < 4-FIA < 4-BIA < 4-CIA. All IE values of HIAs obtained upon 96% in 1 mM, especially, 4-CIA reach 99.6%.
(3) The rating of inhibition efficiencies obtained electrochemically was further confirmed by FE-SEM and AFM observation.
(4) The quantum chemical calculation provides useful molecular properties, while it fails to allow good correlation of obtained descriptor with the experimental corrosion inhibition ranking due to no consideration of the interaction between inhibitor molecules and Cu substrate.
(5) The MD simulations shows that all of the investigated compounds adsorb tightly onto the Cu surface in a parallel state and that the Ebinding values agree well with the electrochemical results.
In summary, the halogeno-substitution can improve inhibitive performance of IA molecule and chloro-substituted molecule brings about the best ability, which is same as the phenomenon in neutral chloride solution. The superior inhibition efficiencies of the HIAs can be explained by the stronger interaction between HIA molecules and Cu surface and a larger coverage area for copper. Furthermore, this present study can help us to understand the effect of halogeno-substitution on the inhibition performance of IA molecule, and provide guidance to design novel related organics as effective corrosion inhibitors of copper.
Conflicts of interest
There are no conflicts to declare.Acknowledgements
This research was supported by National Natural Science Foundation of China (No. 21676035, 21878029, 21706195), Sail plan of Guangdong, China (No. 2015YT02D025).References
- S. M. Sherif el, R. M. Erasmus and J. D. Comins, J. Colloid Interface Sci., 2007, 311, 144–151 CrossRef PubMed.
- H. Bi, G. T. Burstein, B. B. Rodriguez and G. Kawaley, Corros. Sci., 2016, 102, 510–516 CrossRef CAS.
- W. Liu, Q. Xu, J. Han, X. Chen and Y. Min, Corros. Sci., 2016, 110, 105–113 CrossRef CAS.
- N. D. Nam, V. Q. Thang, N. T. Hoai and P. V. Hien, Corros. Sci., 2016, 112, 451–461 CrossRef.
- M. Bozorg, T. Shahrabi Farahani, J. Neshati, Z. Chaghazardi and G. Mohammadi Ziarani, Ind. Eng. Chem. Res., 2014, 53, 4295–4303 CrossRef CAS.
- C. Zhang, H. Duan and J. Zhao, Corros. Sci., 2016, 112, 160–169 CrossRef CAS.
- Y. Qiang, S. Zhang, B. Tan and S. Chen, Corros. Sci., 2018, 133, 6–16 CrossRef CAS.
- S. Mo, H. Q. Luo and N. B. Li, J. Colloid Interface Sci., 2017, 505, 929–939 CrossRef CAS PubMed.
- P. Kannan, T. S. Rao and N. Rajendran, J. Colloid Interface Sci., 2018, 512, 618–628 CrossRef CAS PubMed.
- Z. Zhang, F. Wang, Y. Liu, S. Wu, W. Li, W. Sun, D. Guo and J. Jiang, RSC Adv., 2018, 8, 20648–20654 RSC.
- Z. Cheng, S. Mo, J. JIa, J. Feng, H. Q. Luo and N. B. Li, RSC Adv., 2016, 6, 15210–15219 RSC.
- Y. Qiang, S. Zhang, S. Xu and L. Yin, RSC Adv., 2015, 5, 63866–63873 RSC.
- G. Moretti and F. Guidi, Corros. Sci., 2002, 44, 1995–2011 CrossRef CAS.
- E. Stupnisek-Lisac, A. Gazivoda and M. Madzarac, Electrochim. Acta, 2002, 47, 4189–4194 CrossRef CAS.
- M. A. Amin and K. F. Khaled, Corros. Sci., 2010, 52, 1194–1204 CrossRef CAS.
- Y. Qiang, S. Zhang, L. Guo, X. Zheng, B. Xiang and S. Chen, Corros. Sci., 2017, 119, 68–78 CrossRef CAS.
- Z. Z. Tasic, M. M. Antonijevic, M. B. Petrovic Mihajlovic and M. B. Radovanovic, J. Mol. Liq., 2016, 219, 463–473 CrossRef CAS.
- G. Quartarone, M. Battilana, L. Bonaldo and T. Tortato, Corros. Sci., 2008, 50, 3467–3474 CrossRef CAS.
- A. Döner, A. O. Yüce and G. Kardaş, Ind. Eng. Chem. Res., 2013, 52, 9709–9718 CrossRef.
- K. F. Khaled, Corros. Sci., 2010, 52, 3225–3234 CrossRef CAS.
- I. B. Obot, D. D. Macdonald and Z. M. Gasem, Corros. Sci., 2015, 99, 1–30 CrossRef CAS.
- Y. Wang and Y. Zuo, Corros. Sci., 2017, 118, 24–30 CrossRef CAS.
- G. L. F. Mendonça, S. N. Costa, V. N. Freire, P. N. S. Casciano, A. N. Correia and P. d. Lima-Neto, Corros. Sci., 2017, 115, 41–55 CrossRef.
- A. Ehsani, M. G. Mahjani, M. Hosseini, R. Safari, R. Moshrefi and H. Mohammad Shiri, J. Colloid Interface Sci., 2017, 490, 444–451 CrossRef CAS PubMed.
- Y. Qiang, S. Fu, S. Zhang, S. Chen and X. Zou, Corros. Sci., 2018, 140, 111–121 CrossRef CAS.
- L. Guo, S. Zhu, S. Zhang, Q. He and W. Li, Corros. Sci., 2014, 87, 366–375 CrossRef CAS.
- D. Wang, D. Yang, D. Zhang, K. Li, L. Gao and T. Lin, Appl. Surf. Sci., 2015, 357, 2176–2183 CrossRef CAS.
- N. Kovačević, I. Milošev and A. Kokalj, Corros. Sci., 2015, 98, 457–470 CrossRef.
- Y. Qiang, S. Zhang, S. Xu and W. Li, J. Colloid Interface Sci., 2016, 472, 52–59 CrossRef CAS PubMed.
- Y. Qiang, S. Zhang, S. Yan, X. Zou and S. Chen, Corros. Sci., 2017, 126, 295–304 CrossRef CAS.
- D. Zhang, Y. Tang, S. Qi, D. Dong, H. Cang and G. Lu, Corros. Sci., 2016, 102, 517–522 CrossRef CAS.
- K. Azzaoui, E. Mejdoubi, S. Jodeh, A. Lamhamdi, E. Rodriguez-Castellón, M. Algarra, A. Zarrouk, A. Errich, R. Salghi and H. Lgaz, Corros. Sci., 2017, 129, 70–81 CrossRef CAS.
- H. Tian, W. Li, B. Hou and D. Wang, Corros. Sci., 2017, 117, 43–58 CrossRef CAS.
- X. Luo, X. Pan, S. Yuan, S. Du, C. Zhang and Y. Liu, Corros. Sci., 2017, 125, 139–151 CrossRef CAS.
- Z. Wang, Y. Gong, C. Jing, H. Huang, H. Li, S. Zhang and F. Gao, Corros. Sci., 2016, 113, 64–77 CrossRef CAS.
- Z. Tao, W. He, S. Wang and G. Zhou, Ind. Eng. Chem. Res., 2013, 52, 17891–17899 CrossRef CAS.
- Y. Yu, D. Zhang, H. Zeng, B. Xie, L. Gao and T. Lin, Appl. Surf. Sci., 2015, 355, 1229–1237 CrossRef CAS.
- K. F. Khaled, Electrochim. Acta, 2009, 54, 4345–4352 CrossRef CAS.
- Y. Hao, L. A. Sani, T. Ge and Q. Fang, Corros. Sci., 2017, 123, 158–169 CrossRef CAS.
- G. Khan, W. J. Basirun, S. N. Kazi, P. Ahmed, L. Magaji, S. M. Ahmed, G. M. Khan and M. A. Rehman, J. Colloid Interface Sci., 2017, 502, 134–145 CrossRef CAS PubMed.
- Y. Qiang, L. Guo, S. Zhang, W. Li, S. Yu and J. Tan, Sci. Rep., 2016, 6, 33305 CrossRef CAS PubMed.
- S. Ogata, N. Kobayashi, T. Kitagawa, S. Shima, A. Fukunaga, C. Takatoh and T. Fukuma, Corros. Sci., 2016, 105, 177–182 CrossRef CAS.
- A. Pourghasemi Hanza, R. Naderi, E. Kowsari and M. Sayebani, Corros. Sci., 2016, 107, 96–106 CrossRef CAS.
- Q. Ma, S. Qi, X. He, Y. Tang and G. Lu, Corros. Sci., 2017, 129, 91–101 CrossRef CAS.
- L. Cai, X. Feng, X. Hua, X. He, Y. Long and G. Chen, RSC Adv., 2016, 6, 68351–68356 RSC.
- M. A. Bedair, M. M. B. El-Sabbah, A. S. Fouda and H. M. Elaryian, Corros. Sci., 2017, 128, 54–72 CrossRef CAS.
- H. M. Abd El-Lateef, M. A. Abo-Riya and A. H. Tantawy, Corros. Sci., 2016, 108, 94–110 CrossRef CAS.
- R. Kumar, O. S. Yadav and G. Singh, J. Mol. Liq., 2017, 237, 413–427 CrossRef CAS.
- L. Feng, H. Yang, X. Cui, D. Chen and G. Li, RSC Adv., 2018, 8, 6507–6518 RSC.
- A. Dutta, S. K. Saha, U. Adhikari, P. Banerjee and D. Sukul, Corros. Sci., 2017, 123, 256–266 CrossRef CAS.
- Y. Meng, W. Ning, B. Xu, W. Yang, K. Zhang, Y. Chen, L. Li, X. Liu, J. Zheng and Y. Zhang, RSC Adv., 2017, 7, 43014–43029 RSC.
Footnote |
| † Electronic supplementary information (ESI) available. See DOI: 10.1039/c8ra08238c |
| This journal is © The Royal Society of Chemistry 2018 |

