 Open Access Article
Bioresource derived porous carbon from cottonseed hull for removal of triclosan and electrochemical application†
Yingfang Jiangab,
Zhengwei Zhangab,
Yagang Zhang *abc,
Xin Zhouab,
Lulu Wangab,
Akram Yasinab and
Letao Zhangab
aXinjiang Technical Institute of Physics and Chemistry, Chinese Academy of Sciences, Urumqi 830011, China. E-mail: ygzhang@ms.xjb.ac.cn
bUniversity of Chinese Academy of Sciences, Beijing 100049, China
cDepartment of Chemical & Environmental Engineering, Xinjiang Institute of Engineering, Urumqi 830023, China
First published on 19th December 2018
Abstract
Biomass-derived porous carbon materials have drawn considerable attention due to their natural abundance and low cost. In this work, nitrogen enriched porous carbons (NRPCs) with large surface areas were designed and prepared from cottonseed hull via simultaneous carbonization and activation with a facile one-pot approach. The NRPCs were tunable in terms of pore structure, nitrogen content and morphology by adjusting the ratio of the carbon precursor (cottonseed hull), nitrogen source (urea), and activation agent (KOH). The as-synthesized NRPCs exhibited three-dimensional oriented and interlinked porous structure, high specific surface area (1160–2573 m2 g−1) and a high level of nitrogen-doping (6.02–10.7%). In a three electrode system, NRPCs prepared at 800 °C with the ratio (cottonseed hull![[thin space (1/6-em)]](https://www.rsc.org/images/entities/char_2009.gif) :
:![[thin space (1/6-em)]](https://www.rsc.org/images/entities/char_2009.gif) KOH
KOH![[thin space (1/6-em)]](https://www.rsc.org/images/entities/char_2009.gif) :
:![[thin space (1/6-em)]](https://www.rsc.org/images/entities/char_2009.gif) urea) of 1
urea) of 1![[thin space (1/6-em)]](https://www.rsc.org/images/entities/char_2009.gif) :
:![[thin space (1/6-em)]](https://www.rsc.org/images/entities/char_2009.gif) 1
1![[thin space (1/6-em)]](https://www.rsc.org/images/entities/char_2009.gif) :
:![[thin space (1/6-em)]](https://www.rsc.org/images/entities/char_2009.gif) 2 (NRPC-112) showed a high specific capacitance of 340 F g−1 at a current density of 0.5 A g−1 and good rate capability (∼80% retention at a current density of 10 A g−1) with 6 M KOH as electrolyte. In a two electrode cell, NRPC-112 demonstrated a high specific capacitance of 304 F g−1 at 0.5 A g−1 and an excellent rate capacity (∼71% retention at current density of 10 A g−1) as well as excellent cycling stability (∼91% retention at 5 A g−1) after 5000 cycles. Furthermore, the NRPCs exhibited an extraordinary adsorption capacity up to 205 mg g−1 for emerging pollutant triclosan. The work provided a sustainable approach to prepare functional carbon materials from biomass-based resource for environment remediation and electrochemical applications.
2 (NRPC-112) showed a high specific capacitance of 340 F g−1 at a current density of 0.5 A g−1 and good rate capability (∼80% retention at a current density of 10 A g−1) with 6 M KOH as electrolyte. In a two electrode cell, NRPC-112 demonstrated a high specific capacitance of 304 F g−1 at 0.5 A g−1 and an excellent rate capacity (∼71% retention at current density of 10 A g−1) as well as excellent cycling stability (∼91% retention at 5 A g−1) after 5000 cycles. Furthermore, the NRPCs exhibited an extraordinary adsorption capacity up to 205 mg g−1 for emerging pollutant triclosan. The work provided a sustainable approach to prepare functional carbon materials from biomass-based resource for environment remediation and electrochemical applications.
1 Introduction
Nitrogen-enriched porous carbon materials have attracted wide interest for their potential applications in electrochemistry,1 catalysis,2 sensors,3 adsorbents,4 CO2 capture5 and gas-storage.6 This is ascribed to their superior properties such as high specific surface area, high porosity, adjustable pore size, uniform pore structure, excellent surface chemical properties, good conductivity and thermal stability.7–9 It is believed that the doping of nitrogen atoms is one of the most effective ways for carbon materials to enhance the specific capacity,10,11 surface wettability12 and electronic conductivity, while maintaining a good circulation stability.13Efforts have been devoted to prepare nitrogen-doped porous carbons with high nitrogen content and large specific surface area. In general, various carbon precursors including fuels,14,15 polymers,16,17 ionic liquids18–20 and biomass-based materials have been successfully used to prepare nitrogen-doped porous carbon materials. Because of the limitation of fossil fuel and the increasing consciousness of environmental protection, biomass derived carbon materials are of particular attractive due to their wide application in many fields. Such as catalyst carrier,21 absorbent agents,22 and electrode active materials for energy storage and conversion,23 because of the unique properties of natural biomass24,25 (trees,26 leaves,27 fruit shells28) and biological derivatives29,30 (animal gelatine,31 starch,32 cellulose33) as precursors.
Various strategies have been developed for the synthesis of biomass-based materials, including post-treatment such as physical or chemical activation,34 catalytic activation and templating techniques using carbon nanotubes and TiO2. However, for the above mentioned methods, their real application still needs to be improved due to their complex, high cost, and lengthy energy consuming process. In some cases, it is inevitable to use metal compounds in the catalytic activation process, which could introduce impurities and cause side effects in the electrolyte solution.35 Furthermore, complicated steps are required to remove the impurities from the carbon materials through the template method.36 Thus, it is essential to design a facile process to prepare biomass-based carbon materials with high surface area, excellent performance, high nitrogen content, and low cost.
Cottonseed hulls are the outer shell of cottonseeds, which can be available in large quantities as by-product in cotton producing area. In general, cottonseed hulls are commonly used as feed culture medium for mushroom cultivation. When they are used as a kind of feed for animal husbandry, which can cause stones and other diseases because of their high content of toxic gossypol.37 But cottonseed hull is one of the most unique sustainable natural carbon sources in terms of its consistency of the chemical composition and availability. Combining the above factors, cottonseed hulls are a highly desirable precursor for preparing the nitrogen-enriched functional carbon materials. Nitrogen enriched porous carbon materials have explored in various promising applications, especially in energy storage and as adsorption material due to their chemical stability, high specific surface area, tunable porous structure, good conductivity and availability.23,38–41
In addition, it is practically important to develop functional materials for emerging highly toxic pollutants. Triclosan (TCS) has received widespread public concerns, due to its frequent detection in surface water and its direct risk as most dangerous carcinogen precursor for human health. It has been reported that TCS is toxic to aquatic organisms, and contributes to direct generation of extremely toxic dioxin.42–44 Hence, it is urgent to explore efficient and cost-effective treatment technologies by functional materials.
The purpose of this work was to construct nitrogen-enriched porous carbons (NRPCs) with cottonseed hull as a raw material through a facile approach, which were further applied in emerging pollutant triclosan adsorption and electrochemical detection. The as-obtained NRPCs exhibited large surface areas, unique porous structure, and an excellent adsorption capacity (205 mg g−1) for triclosan. Meanwhile, the NRPCs possess considerable electrochemical performance in supercapacitors.
2 Experimental
2.1 Materials
Cottonseed hull (the contents of C, N, H are shown in Table 1) was smashed by grinder into particles with 200 meshes sieve before use. Potassium hydroxide (KOH), urea, hydrochloric acid were all of analytical grade.| Material | Yield (%) | Elemental analysis | XPS | ||||
|---|---|---|---|---|---|---|---|
| C (%) | N (%) | H (%) | C (%) | N (%) | O (%) | ||
| CH-100 | N/A | 76.44 | 2.15 | 1.23 | 78.45 | 1.84 | 19.72 |
| NRPC-110 | 12.5 | 74.71 | 2.43 | 1.86 | 88.08 | 2.01 | 9.91 |
| NRPC-111 | 17.2 | 78.38 | 6.02 | 1.79 | 83.67 | 5.79 | 10.53 |
| NRPC-112 | 15.4 | 64.43 | 8.98 | 1.4 | 80.45 | 8.44 | 10.81 |
| NRPC-113 | 11.7 | 66.3 | 10.69 | 1.12 | 78.76 | 10.35 | 10.89 |
2.2 Synthesis of nitrogen-enriched porous carbons (NRPCs)
A mixture of cottonseed hull (4.0 g), KOH (4.0 g) and urea (8.0 g) (the mass ratio was 1![[thin space (1/6-em)]](https://www.rsc.org/images/entities/char_2009.gif) :
:![[thin space (1/6-em)]](https://www.rsc.org/images/entities/char_2009.gif) 1
1![[thin space (1/6-em)]](https://www.rsc.org/images/entities/char_2009.gif) :
:![[thin space (1/6-em)]](https://www.rsc.org/images/entities/char_2009.gif) 2) were mixed with 30 mL deionized water in a 100 mL flask and stirred at ambient temperature (15 °C) for 2 h. Then the mixture was transferred into an porcelain boat and heated to 800 °C for 2 h with a heating rate of 5 °C min−1 under a nitrogen atmosphere. After cooling down to ambient temperature, the obtained sample was immersed into the HCl solution (2.0 mol L−1) and stirred for 1 h, and then washed repeatedly with ultra-pure water until the pH value reached 7. Finally, the black sample was dried under vacuum at 60 °C for 12 h and denoted as NRPC-112.
2) were mixed with 30 mL deionized water in a 100 mL flask and stirred at ambient temperature (15 °C) for 2 h. Then the mixture was transferred into an porcelain boat and heated to 800 °C for 2 h with a heating rate of 5 °C min−1 under a nitrogen atmosphere. After cooling down to ambient temperature, the obtained sample was immersed into the HCl solution (2.0 mol L−1) and stirred for 1 h, and then washed repeatedly with ultra-pure water until the pH value reached 7. Finally, the black sample was dried under vacuum at 60 °C for 12 h and denoted as NRPC-112.
For comparison, NRPCs with different mass ratio (cottonseed hull![[thin space (1/6-em)]](https://www.rsc.org/images/entities/char_2009.gif) :
:![[thin space (1/6-em)]](https://www.rsc.org/images/entities/char_2009.gif) KOH
KOH![[thin space (1/6-em)]](https://www.rsc.org/images/entities/char_2009.gif) :
:![[thin space (1/6-em)]](https://www.rsc.org/images/entities/char_2009.gif) urea was 1
urea was 1![[thin space (1/6-em)]](https://www.rsc.org/images/entities/char_2009.gif) :
:![[thin space (1/6-em)]](https://www.rsc.org/images/entities/char_2009.gif) 0
0![[thin space (1/6-em)]](https://www.rsc.org/images/entities/char_2009.gif) :
:![[thin space (1/6-em)]](https://www.rsc.org/images/entities/char_2009.gif) 0, 1
0, 1![[thin space (1/6-em)]](https://www.rsc.org/images/entities/char_2009.gif) :
:![[thin space (1/6-em)]](https://www.rsc.org/images/entities/char_2009.gif) 1
1![[thin space (1/6-em)]](https://www.rsc.org/images/entities/char_2009.gif) :
:![[thin space (1/6-em)]](https://www.rsc.org/images/entities/char_2009.gif) 1, and 1
1, and 1![[thin space (1/6-em)]](https://www.rsc.org/images/entities/char_2009.gif) :
:![[thin space (1/6-em)]](https://www.rsc.org/images/entities/char_2009.gif) 1
1![[thin space (1/6-em)]](https://www.rsc.org/images/entities/char_2009.gif) :
:![[thin space (1/6-em)]](https://www.rsc.org/images/entities/char_2009.gif) 3 respectively) were prepared under the same condition and the resultant samples were labelled as CH-100, NRPC-110, NRPC-111, and NRPC-113, respectively.
3 respectively) were prepared under the same condition and the resultant samples were labelled as CH-100, NRPC-110, NRPC-111, and NRPC-113, respectively.
2.3 Materials characterization
X-ray diffraction (XRD) patterns of CH-100 and NRPCs were obtained on an XRD analyzer (D8-Advance, Bruker AXS, Germany) equipped with a diffracted-beam monochromator using Cu Kα radiation (50 kV, 40 mA). The Raman spectra were obtained using a Raman spectroscopy (Horiba Scientific, France) with a 532 nm blue laser beam. The microstructures of all samples were observed with field emission scanning electron microscopy (FE-SEM, ZEISS, Germany) and transmission electron microscopy (H-600, Hitachi, Japan). Surface area was tested by Brunauer–Emmer–Teller (BET) method with use of the nitrogen absorption/desorption measurement (V-Sorb 2800P, China). All samples were degassed in vacuum at 200 °C for 5 h prior to sorption experiments. X-ray photoelectron spectroscopy (XPS) was carried out on an XPS (ESCALAB 250Xi, Thermo, America), with a monochromatic Al Kα as an excitation source.2.4 Electrochemical measurements
Electrochemical tests were carried out on a CHI660E electrochemical workstation (Chenhua, Shanghai, China) at ambient temperature. The working electrodes were made according to the following process: 90 wt% active material, 5 wt% black carbon, and 5 wt% polytetrafluoroethylene (PTFE) were mixed with ethanol. Then, the mixture was coated on a titanium mesh (1 cm × 1 cm), followed by pressing at a pressure of 15 MPa for one minute and finally dried at 60 °C in vacuum oven for 2 h. The loading mass of the active material on each electrode was 5.0 mg.In a three-electrode system, a platinum slice was used as the counter electrode and Hg/HgO was used as the reference electrode in 6 M KOH. Cyclic voltammetry (CV) tests were carried out in the potential range of −1 V to 0 V at scan rates of 5–100 mV s−1. Galvanostatic charge/discharge (GCD) was performed in the same potential range. Electrochemical impedance spectroscopy (EIS) was tested over in the frequency range of 0.01 Hz to 0.1 MHz at the alternating current amplitude of 5.0 mV. The specific capacitances according to GCD curves were calculated according to eqn (1).
 | (1) |
In a two-electrode cell, the electrodes were prepared using the same method of three-electrode system. The electrochemical experiment was conducted in 6 M KOH aqueous solution. The specific capacitance based on GCD curves was calculated according to eqn (2).
 | (2) |
The energy density of the two-electrode system was calculated by eqn (3), power density was calculated according to eqn (4).
 | (3) |
 | (4) |
2.5 Triclosan recognition and adsorption
In order to test the absorption capacity of NRPCs in high concentration solution of triclosan, the adsorption studies for triclosan were carried out in acetonitrile instead of in water. First, 2000 mg L−1 of acetonitrile solution was prepared. Then, 5 mg NRPCs was added into 5.0 mL of 2000 mg L−1 TCS CH3CN solution. The mixtures were incubated in a shaker for 60 min to allow absorption equilibrium to be established. Each sample was passed through a Teflon filter to separate particles from supernatant. Residual concentrations of TCS in filtrate were quantified by measuring the UV absorbance at 280 nm. The adsorption capacity can be calculated according to the following eqn (5).
 | (5) |
The adsorption isotherm of NRPC-112 was described using a Langmuir model with a homogeneous adsorption, which is expressed by eqn (6).
 | (6) |
3 Results and discussion
3.1 Structural transformation
Theoretically, for a biomass precursor, a uniform, stable and constant chemical composition would be highly desirable. In reality, the chemical composition of precursors with low cost are quite complex and vary dramatically from batch to batch. For example, when cotton straw was used, it contains three different parts, namely cutex, stem and core. The chemical contents of them are quite different. The hardness of cotton straw also made it difficult to be smashed or dissolved. Thus it is important to choose cheap precursors with uniform, stable and constant chemical composition and appropriate physical and chemical properties. Taking all these reasons, it makes cotton seed hull a promising bio-resource precursor as well as its affordable cost and availability in large quantities.The yields of carbonized cottonseed hull at 800 °C and four NRPCs were listed in Table 1. It was showed that the yields of NRPCs decreased with the increasing amount of urea, which could be attributed to the etching and intercalation effect result from KOH and urea. On the other hand, a portion of the urea would be doped into the cotton seed shell matrix (shown in Table 1). The excess amount of urea would consume a portion of the KOH and the efficiency of activation for KOH would be reduced. Thus, it is critical to choose appropriate precursor ratio for preparing the carbon materials.45
3.2 Materials properties
The elemental compositions of NRPCs and CH-100 were obtained by combustion elemental analysis and XPS analysis. As seen from Table 1, it was observed that CH-100 exhibited a nitrogen content of 2.15%, and other NRPCs consisted of carbon (64.43–78.38%), nitrogen (2.43–10.69%), hydrogen (1.12–1.86%), which implied urea was favourable for generating N rich carbon materials. And the content of nitrogen on the surface of samples was in agreement with that of elemental analysis, which further indicated that the nitrogen was successfully doped into the carbon matrix. Besides, the oxygen element was also detected from the obtained NRPCs. It was proposed that N groups mainly provided pseudocapacitance and O groups were beneficial for improving surface wettability of the electrode.43 The morphology and structure of samples were observed by SEM and TEM. The morphology of NRPC-112 was depicted in Fig. 1(a–c, e and f). The SEM images in Fig. 1a showed that large amounts of porous structure were generated. It also can be seen from SEM images (Fig. 1b and c) that NRPC-112 containing continuous, interconnected, osteoporosis porous structure. The crosslinked porous structure could provide the channel of electrode ions diffusion and transmission.40 As shown in Fig. 1d, the CH-100 exhibited smooth surface and dense structure with very limited pores and channels. Compared with CH-100, the obtained NRPC-112 showed an osteoporosis and macro/meso porous structure, which could be attributed to the etching and intercalation effect result from KOH and urea. In addition, Fig. 1e presented the microscopic structure of NRPC-112. The sub-nanometer micro-structure of NRPC-112 was highlighted by HRTEM in the Fig. 1f. There was an amorphous structure with irregular domains, indicating some disordered defects and functional groups in the material. Furthermore, in order to investigate the elemental distribution of C, O, and N, energy-dispersive X-ray spectroscopy (EDS) mapping was performed and the results were shown in Fig. 1(g–i). All elements displayed a homogeneous distribution on the surface of the sample, indicating that N was successfully incorporated into NRPC-112 matrix.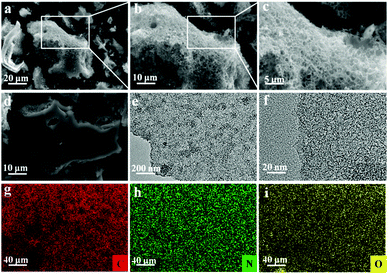 | ||
| Fig. 1 SEM images of NRPC-112 (a–c), CH-100 (d). TEM image (e) and HRTEM image (f) of NRPC-112, and the corresponding EDX mapping of (g) C, (h) N, (i) O. | ||
The N2 adsorption/desorption isotherms were carried out to characterize the pore structures of the prepared NRPCs. The isotherms and the pore size distribution were shown in Fig. 2. Table 2 summarized the detailed textural parameters of CH-100 and NRPCs. As shown in Fig. 2a, NRPCs showed the typical type I isotherm according to IUPAC classification, which implied the existence of mainly micropores.46 Fig. 2b showed that the pore diameters of all samples were mainly in the range of 0.4 to 5 nm, it can be seen that the materials possess micropores in the range of 0 to 2 nm which could be ascribed to the KOH chemical etching and activation. These results suggested that both KOH and urea can act as efficient activation reagents for improving the porosity and specific surface area of the carbon materials.
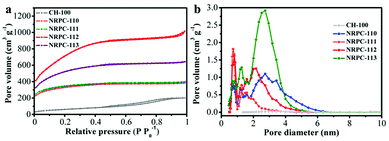 | ||
| Fig. 2 (a) N2 adsorption–desorption isotherms, (b) pore width distributions of CH-100 and NRPCs obtained by DFT method. | ||
| SBET (m2 g−1) | Pore volume (cm3 g−1) | Dp (nm) | |||||
|---|---|---|---|---|---|---|---|
| Material | Total | Micro | Meso | Total | Micro | Meso | |
| CH100 | 15 | 6 | 9 | 0.016 | 0.0018 | 0.0142 | 4.57 |
| NRPC-110 | 1160 | 1129 | 31 | 0.52 | 0.47 | 0.05 | 2.38 |
| NRPC-111 | 1277 | 1218 | 59 | 0.76 | 0.67 | 0.09 | 1.79 |
| NRPC-112 | 2573 | 2398 | 175 | 0.89 | 0.78 | 0.11 | 1.99 |
| NRPC-113 | 1789 | 1719 | 70 | 1.54 | 1.23 | 0.31 | 2.41 |
It was found in Table 2 that the cottonseed hulls (without urea and KOH) carbonized at 800 °C only had specific surface area of 15 m2 g−1 and larger average pore diameter, while the NRPCs had much larger specific surface area (1160–2573 m2 g−1) and smaller average pore diameter (1.79–2.41 nm). With the increase of the precursor ratio (cottonseed hull![[thin space (1/6-em)]](https://www.rsc.org/images/entities/char_2009.gif) :
:![[thin space (1/6-em)]](https://www.rsc.org/images/entities/char_2009.gif) KOH
KOH![[thin space (1/6-em)]](https://www.rsc.org/images/entities/char_2009.gif) :
:![[thin space (1/6-em)]](https://www.rsc.org/images/entities/char_2009.gif) urea) from 110, 111, 112 to 113, the specific surface area increased from 1160, 1277 to 2573 m2 g−1 and then decreased to 1789 m2 g−1, respectively, while the pore volumes increased from 0.016, 0.52, 0.76, 0.89 to 1.54 cm3 g−1, respectively. It was observed that the enhancement in specific surface area mainly ascribe to the existence of micropores, which was beneficial for high capacitance because the micropores could provide abundant active sites for ion storage. Moreover, some mesopores were also observed, which were helpful for diffusion and transmission of electrolyte ions. Noticeably, the specific surface areas of NRPC-112 (2573 m2 g−1) is significantly higher than other biomass-derived carbon materials reported previously, as listed in Table 3.
urea) from 110, 111, 112 to 113, the specific surface area increased from 1160, 1277 to 2573 m2 g−1 and then decreased to 1789 m2 g−1, respectively, while the pore volumes increased from 0.016, 0.52, 0.76, 0.89 to 1.54 cm3 g−1, respectively. It was observed that the enhancement in specific surface area mainly ascribe to the existence of micropores, which was beneficial for high capacitance because the micropores could provide abundant active sites for ion storage. Moreover, some mesopores were also observed, which were helpful for diffusion and transmission of electrolyte ions. Noticeably, the specific surface areas of NRPC-112 (2573 m2 g−1) is significantly higher than other biomass-derived carbon materials reported previously, as listed in Table 3.
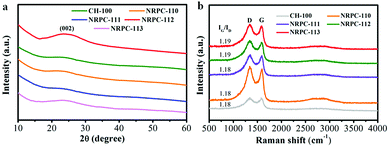
Then the crystal structure and the degree of graphitization of the CH-100 and NRPCs were recorded by XRD and Raman spectra (shown in Fig. 3). A broad and weak diffraction peak appeared at 2θ = 15–30°, implied that the NRPCs had amorphous structure with low graphitization degree. The Raman spectras of CH-100 and NRPCs (Fig. 3a) were in agreement with the XRD pattern. Two characteristic peaks appeared at 1585 cm−1 (G bands) and 1332 cm−1 (D bands).
The D bands are relevant to the degree of crystal defect of the material, while the G bands represent the micro crystalline structure. The ratio of G to D peaks (IG/ID) reflects the material defect degree and the degree of graphitization. As shown in Fig. 3b, the IG/ID values of all samples were in the range of 1.18–1.19, suggesting the N and O doped NRPCs possessed the typical amorphous structure with a relatively low degree of graphitization.
The surface chemical properties of all samples were characterized by XPS technique. As shown in Fig. 4a, three characteristic peaks were observed at 285, 400, and 533 eV, which were assigned to the C 1s, N 1s, and O 1s, respectively.55 The elemental composition was summarized in Table 1.
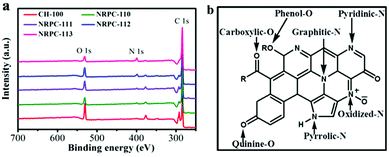 | ||
| Fig. 4 (a) XPS survey spectra of carbon samples. (b) Schematic illustration of different of N and O in carbon material lattice. | ||
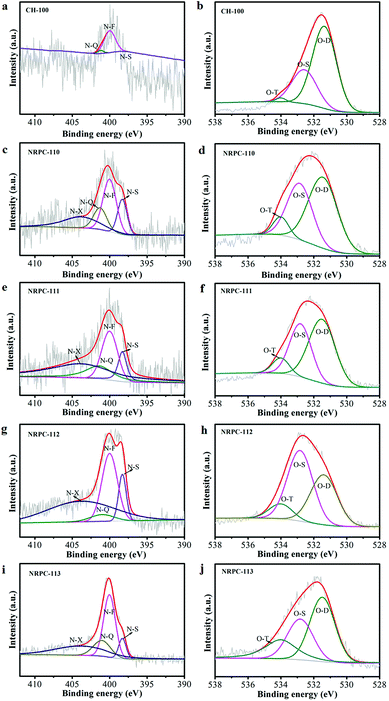
The high-resolution XPS scans of N 1s (Fig. 5a, c, e, g and i) revealed that there were four types of N signals. They were pyridinic-N (N-S), pyrrolic-N (N-F), graphitic-N (N-Q), and oxidized-N (N-X), which were correspond to the peaks at 398.2, 399.7, 400.7 and 402.8 eV, respectively.56–58
The high resolution scans of O 1s were shown in Fig. 5b, d, f, h, and j. Three types of O signals were observed namely, C![[double bond, length as m-dash]](https://www.rsc.org/images/entities/char_e001.gif) O oxygen or quinine-type groups (O-D), C–OH phenol groups/C–O–C ether groups (O-S) and O
O oxygen or quinine-type groups (O-D), C–OH phenol groups/C–O–C ether groups (O-S) and O![[double bond, length as m-dash]](https://www.rsc.org/images/entities/char_e001.gif) C–O (carboxylic group, chemisorbed oxygen)/or water (O-T), which were ascribed to the peaks at 531.3, 532.7 and 534.2 eV, respectively.55 It was believed that the pyridinic N could facilitate electron transfer to the carbon layers, while the graphene N could enhance the conductivity of materials. Therefore, they were both important for electrode application. Besides, the pyrrolic N and pyridinic N could join in redox reactions to promote the pseudocapacitance and increase the capacitive performance.59 Furthermore, different types of O within the carbon materials are shown in Fig. 4b. O-D is a type of O bonding to enhance the surface wettability, all materials had large amount of O-D, which implied that they had low resistance to ion transfer between the electrolyte. O-S was electrochemically active, which was beneficial for promoting pseudocapacitance of the electrode. O-T also facilitated good performances in the electrochemical tests.60
C–O (carboxylic group, chemisorbed oxygen)/or water (O-T), which were ascribed to the peaks at 531.3, 532.7 and 534.2 eV, respectively.55 It was believed that the pyridinic N could facilitate electron transfer to the carbon layers, while the graphene N could enhance the conductivity of materials. Therefore, they were both important for electrode application. Besides, the pyrrolic N and pyridinic N could join in redox reactions to promote the pseudocapacitance and increase the capacitive performance.59 Furthermore, different types of O within the carbon materials are shown in Fig. 4b. O-D is a type of O bonding to enhance the surface wettability, all materials had large amount of O-D, which implied that they had low resistance to ion transfer between the electrolyte. O-S was electrochemically active, which was beneficial for promoting pseudocapacitance of the electrode. O-T also facilitated good performances in the electrochemical tests.60
N and O in different chemical states within the carbon matrices were schematically showed in Fig. 4b. It was proposed that the doping of oxygen and nitrogen heteroatoms could effectively improve the surface wettability and increase pseudo-capacitance of carbon electrode materials.61 Therefore, the resulting NRPCs were expected to be suitable as electrode materials for supercapacitors.
3.3 Electrochemical properties
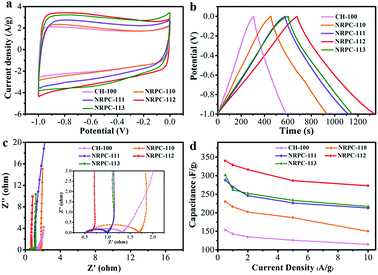
After the successful synthesis of the nitrogen-doped porous carbons with appropriate pore structures, high specific surface areas and nitrogen content, the electrochemical performance of the prepared NRPCs were assessed. The electrochemical properties of CH-100 and NRPCs were evaluated both in a three-electrode system and a two-electrode cell using 6 M KOH solution as electrolyte.The Fig. 6a showed the cyclic voltammogram curves (CVs) of CH-100 and NRPCs at a scan rate of 10 mV s−1 in three electrode cell with 6 M KOH as electrolyte. The CV curves were related to the capacitance of an electrode. The larger rectangular shape of the CV curves indicated higher ability to store electric charge. The NRPC-112 exhibited superior capacitances among all NRPCs electrodes. The superior electrochemical performance of NRPC-112 could be ascribed to the high specific surface area (2573 m2 g−1) for accommodation of larger amounts of electric double-layer capacitance (EDLC) and interconnected pore structure. As mentioned previously, the large amount of surface mesoporous structures led to a low resistance channels for ion transport, the micropores provided abundant surface area to accommodate electric double layers and generate pseudocapacitances.
Galvanostatic charge/discharge (GCD) profiles of CH-100 and NRPCs at a current density of 0.5 A g−1 were shown in Fig. 6b. GCD curves exhibited a quasi-isosceles triangular shape, which implying that all samples had good coulombic efficiency and decent double-layer capacitive performance. Furthermore, from the GCD results at current density of 0.5 A g−1, the NRPC-112 exhibited the largest gravimetric capacitance (Cg) values (340 F g−1). The Cg value was higher than that of control CH-100 (153.5 F g−1), and NRPC-110 (230 F g−1), NRPC-111 (288.5 F g−1) and NRPC-113 (301.3 F g−1). The results highlighted the superior capacitances of NRPC-112 electrode.
As shown in Fig. 6c, the electrochemical dynamics performance of NRPCs was measured by EIS. the measurements were performed with an alternating current voltage amplitude of 5 mV within frequency range of 0.01 Hz to 100 Hz. NRPC-112 electrode showed a near vertical straight line at the low-frequency region (Warburg diffusion component) and the slope of the straight line was greater than that of other samples, suggesting that electrical ions could easily spread the surface without diffusion resistance. Simultaneously, NRPC-112 displayed the smallest semicircle at the high frequency region among all samples, demonstrating the lowest charge transport resistance.
What is more, the stability at a high current density is a key factor for real application of supercapacitors. Discharge capacitances of the obtained five samples at different current densities were evaluated, and the results were summarized in Fig. 6d. It was observed that the capacitance of NRPC-112 was higher than that of all other samples at high current densities. The specific capacitance of all NRPCs decreased rapidly with the increasing current density from 0.5 A g−1 to 2 A g−1. The specific capacitances of the CH-100, NRPC-110, NRPC-111, NRPC-112, and NRPC-113 electrodes were obtained as 154, 230, 289, 340, 301.3 F g−1 at the current density of 0.5 A g−1, respectively. And the capacitance retention rate of five samples were 75%, 65%, 74%, 80% and 72% at the current density of 10 A g−1, respectively. NRPC-112 showed the largest rate capability (80% retention), which was much higher than other electrodes, suggesting superior stability at high current density.
NRPC-112 electrode was chosen to evaluate its supercapacitors properties due to its superior electro-chemical performance (the electrochemical property of NRPC-112 was also evaluated in a three-electrode system using 1 M H2SO4 solution as electrolyte as shown in Fig. S1†). Fig. 7a showed the CV curve of NRPC-112 at various scan rates. It was found that the CV curve of NRPC-112 showed rectangular shape as the scan rate increasing from 10 mV s−1 to 50 mV s−1. The CV curve still retained a rectangular shape even at the scan rate of 100 mV s−1, illustrating the rapid charging-discharging characteristic and a good ratio performance at high scan rate. Fig. 7b was the GCD curves at current density range from 0.5 A g−1 to 10 A g−1. It was found that the curves were near isosceles triangle shape, implying the high ratio performance, low equivalent series resistance and high discharge efficiency.
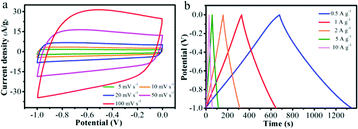 | ||
| Fig. 7 Electrochemical performance of NRPC-112 in a three-electrode system. (a) CV curves at various scan rates of 5–100 mV s−1, (b) GCD curves at 0.5–10 A g−1. | ||
NRPC-112 demonstrated the highest ratio performance and specific capacitance. This could be ascribed to the synergistic effect of oxygen and nitrogen doping and the largest specific surface area. Firstly, NRPC-112 had a porous structure and the highest specific surface area (both in micropore and mesoporous). Micropores could provide abundant active sites for ion storage, interfacial reactions, while the mesopores could promote fast ion transportation.39,41,62,63 Secondly, NRPC-112 had moderate oxygen and nitrogen content. It was proposed that oxygen containing functional groups such as C![[double bond, length as m-dash]](https://www.rsc.org/images/entities/char_e001.gif) O, C–O/C–OH, –COOH and nitrogen functional groups including pyridine nitrogen, pyrrole nitrogen and nitrogen oxides could be involved in the Faraday reaction, providing pseudocapacitance, while graphite nitrogen could also improve the electrical conductivity of the material.64–67 Furthermore, the presence of oxygen and nitrogen functional groups promoted the surface wettability between electrodes and electrolyte. This would also facilitate the aqueous electrolyte ions entering into the electrode pore structure, so as to improve the electrochemical performance.47,51
O, C–O/C–OH, –COOH and nitrogen functional groups including pyridine nitrogen, pyrrole nitrogen and nitrogen oxides could be involved in the Faraday reaction, providing pseudocapacitance, while graphite nitrogen could also improve the electrical conductivity of the material.64–67 Furthermore, the presence of oxygen and nitrogen functional groups promoted the surface wettability between electrodes and electrolyte. This would also facilitate the aqueous electrolyte ions entering into the electrode pore structure, so as to improve the electrochemical performance.47,51
In order to evaluate the supercapacitors performance for practical applications, two-electrode symmetric supercapacitor was set up in 6 M KOH.
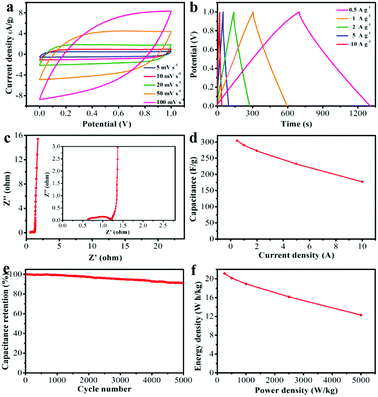
Fig. 8a showed CV curves of NRPC-112 based symmetric supercapacitors at different scan rates. It was observed that the CVs were relatively regular rectangle shape as the scan rate increasing from 5 mV s−1 to 100 mV s−1, which could be attributed to an electrochemical EDLCs contribution. GCD curves (Fig. 8b) showed symmetric triangle shapes at different current densities. The Nyquist plot of NRPC-112 based symmetric supercapacitor was shown in Fig. 8c. It was found that the equivalent series resistance of NRPC-112 based symmetric supercapacitor was about 0.75 Ω, indicating that the electrolyte ion could be transmitted and diffused rapidly. Fig. 8d showed the specific capacitance at various current densities. It showed that the specific capacitance of NRPC-112 was 304, 290, 272, 242, 217 F g−1 at the current density of 0.5, 1, 2, 5, 10 A g−1, respectively, implying the rate capability of ∼71% retention (the ratio of the specific capacitance at the current density of 10 A g−1 and 0.5 A g−1). Impressively, in a two-electrode cell using 6 M KOH as electrolyte, the specific capacitance of NRPC-112 (304 F g−1) was much higher than that of biomass-derived carbon materials reported in literature (listed in Table 4).
In practical application, the cycle stability and energy density of supercapacitors are important parameters. Fig. 8e presented the stability of NRPC-112 based symmetric supercapacitor in two electrode cell at the current density of 5 A g−1. It was observed that about 91% specific capacitance of NRPC-112 remained after 5000 cycles. The energy density plot of NRPC-112 was depicted in Fig. 8f. Results showed that the energy density was as high as 21.1 W h kg−1 with power density of 250 W kg−1, which was higher than that of recent reports of hybrid carbon-based supercapacitors (18 W h kg−1 when the power density was 250 W kg−1).75 More impressively, the energy density was up to 12.3 W h kg−1 when the power density reached 5000 W kg−1. These results showed that NRPC-112 based symmetric supercapacitors demonstrated excellent electrochemical performances.
3.4 Triclosan recognition and removal
Triclosan has drawn considerable attention as one of the most dangerous carcinogen precursor to human health. Triclosan has been frequently detected in surface water since it has been widely used in household chemicals in large quantities. It is harmful to aquatic organisms, and contributes to the direct formation of extremely toxic carcinogen dioxins. This raised concerns in US EPA and FDA in 2010, and state of Minnesota baned triclosan in May 2014. Measures were further taken for this issue and US FDA baned triclosan in consumer soaps in September 2016. Therefore it is paramount important to develop functional materials for the recognition and removal of emerging pollutants like triclosan.Along this line, the as prepared NRPCs were evaluated and tested as adsorbent materials for triclosan. This design was based on three reasons. Firstly, the prepared NRPCs featured large surface areas and unique porous structure, which was highly desirable as absorbent materials. Secondly, the different types of nitrogen atoms including pyridinic-N (N-S), pyrrolic-N (N-F), graphitic-N (N-Q), and oxidized-N (N-X) doped in NRPCs could potentially interact with triclosan via hydrogen bonding and acid–base interaction. Furthermore, the NRPCs also feature large conjugated aromatic structure which allows electron delocalization. This would facilitate the aromatic–aromatic interaction with triclosan benzene rings. Impressively, the NRPCs exhibited an extraordinary adsorption capacity up to 205 mg g−1 for triclosan. It was found to be the most effective absorbent ever reported in the literature (Table 5).
| Adsorbent | Adsorption capacity (mg g−1) | Ref. |
|---|---|---|
| Carbon nanotubes imprinted polymers | 0.80–1.82 | 76 |
| Magnetic carbon nanotubes imprinted material | 15.1–20.9 | 77 |
| Kaolinite | 6 | 78 |
| Montmorillonite | 9 | 79 |
| β-Cyclodextrin | 15.19 | 42 |
| Activated carbon from gas masks | 85 | 43 |
| Carbon material from rice straw | 174 | 44 |
| NRPC-112 | 205 | This work |
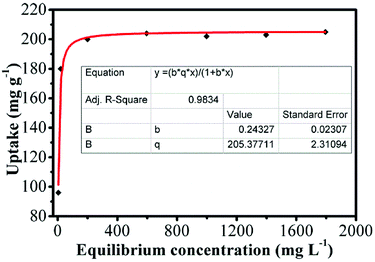
For purpose of dyes removal, we investigated the adsorption performance for TCS using the NRPC-112 as adsorbent. The adsorption isotherm of NRPC-112 was described using a Langmuir model with a homogeneous adsorption, which is expressed by eqn (6). The experimental data were fitted to the Langmuir model with the R2 value of NRPC-112 adsorbent over 0.98 (as shown in Fig. 9), it has a high adsorption capacity for triclosan at both low concentrations and high concentrations of triclosan. As shown in Table 5, the NRPC-112 exhibited adsorption capacity as high as 205 mg g−1 for triclosan. Adsorption capacity of other reported triclosan adsorbents such as carbon imprinted polymers, magnetic imprinted material, kaolinite, montmorillonite, β-cyclodextrin,42 zeolites, activated carbon, rice straw44 were summarized in Table 5.
It should be noticed that the values of adsorption capacity of other sorbents were obtained under very different conditions and some of them by using water as equilibrium solvent. For example, for magnetic carbon nanotubes imprinted material, the solvent used was water. For kaolinite the solutions were prepared in an aqueous solution with only 20% methanol. For montmorillonite and β cyclodextrin the solvent was water, and for carbon material from rice straw the solvent was water. On the other hand, the amounts used for each work were quite different. Although the test conditions are different, NRPC-112 showed great application value to the adsorption of triclosan.
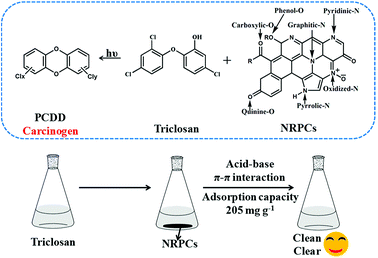
NRPC-112 demonstrated the good adsorption capacity. This could be ascribed to the large specific surface area and the synergistic effect of oxygen and nitrogen doping. NRPC-112 provided various amine groups which could form hydrogen bonds with O atom and interact with hydroxyl group through acid–base interaction. NRPC-112 provides aromatic rings which can form aromatic–aromatic interactions with phenyl rings of triclosan, as shown in Fig. 10. In summary, results implied that the prepared nitrogen-enriched porous carbons hold great application potential for the recognition and removal of triclosan.
4 Conclusions
Nitrogen-enriched porous carbons with high nitrogen content and large surface areas were designed and prepared from cottonseed hull via simultaneous carbonization and activation with a facile one-pot approach. The as-prepared NRPCs displayed high specific surface area (up to 2573 m2 g−1). The NRPCs exhibited excellent electrochemical performance with maximum specific capacitance of 340 F g−1 at current density of 0.5 A g−1 with 6 M KOH as electrolyte in three electrode cells. In the two electrode cell, the NRPC-112 also showed an outstanding specific capacitance of 304 F g−1 at 0.5 A g−1 and good rate capacity (about 71% retention at current density of 10 A g−1) as well as excellent cycling stability (about 91% retention at current density of 5 A g−1) after 5000 cycles. Furthermore, the NRPCs exhibited adsorption capacity as high as 205 mg g−1 for triclosan under tested conditions. The facile one pot process would also be favourable for large scale manufacturing for preparing N-doped porous carbon materials. Such functional porous carbon materials derived from low-cost, abundant sustainable bioresource could have substantial impact for applications including energy storage devices and functional adsorption materials.Conflicts of interest
There are no conflicts to declare.Acknowledgements
This work was financially supported by the National Natural Science Foundation of China (21472235, 21464015), Xinjiang Tianshan Talents Program (2018), Young Elite Scientist Sponsorship Program by CAST (2017QNRC001). “One Thousand Talents” Program (Y32H291501) of China, Western Light program of CAS (Y72S301501-502) and the STS program of Chinese Academy of Sciences (2017).References
- E. Frackowiak, Phys. Chem. Chem. Phys., 2007, 9(15), 1774–1785 RSC
.
- L. Qu, Y. Liu, J.-B. Baek and L. Dai, ACS Nano, 2010, 4(3), 1321–1326 CrossRef CAS PubMed
.
- Z. H. Sheng, X. Q. Zheng, J. Y. Xu, W. J. Bao, F. B. Wang and X. H. Xia, Biosens. Bioelectron., 2012, 34(1), 125–131 CrossRef CAS PubMed
.
- M. Hofman and R. Pietrzak, Sci. World J., 2012, 2012, 297654 Search PubMed
.
- G. Sethia and A. Sayari, Energy Fuels, 2014, 28(4), 2727–2731 CrossRef CAS
.
- C. N. Rao, K. Gopalakrishnan and U. Maitra, ACS Appl. Mater. Interfaces, 2015, 7(15), 7809–7832 CrossRef CAS PubMed
.
- D. Hulicova, M. Kodama and H. Hatori, Chem. Mater., 2006, 18(9), 2318–2326 CrossRef CAS
.
- W. Li, D. Chen, Z. Li, Y. Shi, Y. Wan, J. Huang, J. Yang, D. Zhao and Z. Jiang, Electrochem. Commun., 2007, 9(4), 569–573 CrossRef CAS
.
- N. P. Wickramaratne, J. Xu, M. Wang, L. Zhu, L. Dai and M. Jaroniec, Chem. Mater., 2014, 26(9), 2820–2828 CrossRef CAS
.
- Z. Jin, J. Yao, C. Kittrell and J. M. Tour, ACS Nano, 2011, 5(5), 4112–4117 CrossRef CAS PubMed
.
- H. G. Q. Guo, Journal Power Sources, 2009, 186(2), 551–556 CrossRef CAS
.
- Y.-H. Lee, Y.-F. Lee, K.-H. Chang and C.-C. Hu, Electrochem. Commun., 2011, 13(1), 50–53 CrossRef CAS
.
- D. Hulicova-Jurcakova, M. Kodama, S. Shiraishi, H. Hatori, Z. H. Zhu and G. Q. Lu, Adv. Funct. Mater., 2009, 19(11), 1800–1809 CrossRef CAS
.
- Y. H. Abdelmoaty, T. D. Tessema, F. A. Choudhury, O. M. El-Kadri and H. M. El-Kaderi, ACS Appl. Mater. Interfaces, 2018, 10(18), 16049–16058 CrossRef CAS PubMed
.
- J. L. Goldfarb, G. Dou, M. Salari and M. W. Grinstaff, ACS Sustainable Chem. Eng., 2017, 5(4), 3046–3054 CrossRef CAS
.
- S. Kitagawa, R. Kitaura and S. Noro, Angew. Chem., Int. Ed. Engl., 2004, 43(18), 2334–2375 CrossRef CAS PubMed
.
- Y. Xu, S. Jin, H. Xu, A. Nagai and D. Jiang, Chem. Soc. Rev., 2013, 42(20), 8012–8031 RSC
.
- J. Yuan and M. Antonietti, Polymer, 2011, 52(7), 1469–1482 CrossRef CAS
.
- J. Yuan, D. Mecerreyes and M. Antonietti, Prog. Polym. Sci., 2013, 38(7), 1009–1036 CrossRef CAS
.
- L. Zhao, Y. S. Hu, H. Li, Z. Wang and L. Chen, Adv. Mater., 2011, 23(11), 1385–1388 CrossRef CAS PubMed
.
- L. Chen, R. Du, J. Zhu, Y. Mao, C. Xue, N. Zhang, Y. Hou, J. Zhang and T. Yi, Small, 2015, 11(12), 1423–1429 CrossRef CAS PubMed
.
- Y. Yang, Z. Tong, T. Ngai and C. Wang, ACS Appl. Mater. Interfaces, 2014, 6(9), 6351–6360 CrossRef CAS PubMed
.
- L. F. Chen, X. D. Zhang, H.-W. Liang, M. Kong, Q.-F. Guan, P. Chen, Z.-Y. Wu and S.-H. Yu, ACS Nano, 2012, 6(8), 7092–7102 CrossRef CAS PubMed
.
- M. Inagaki, M. Toyoda, Y. Soneda and T. Morishita, Carbon, 2018, 132, 104–140 CrossRef CAS
.
- Z. Hao, X. Xu, H. Wang, J. Liu and H. Yan, Ionics, 2018, 24(4), 951–965 CrossRef CAS
.
- C. Dai, J. Wan, J. Yang, S. Qu, T. Jin, F. Ma and J. Shao, Appl. Surf. Sci., 2018, 444, 105–117 CrossRef CAS
.
- T. Mahmood, R. Ali, A. Naeem, M. Hamayun and M. Aslam, Process Saf. Environ. Prot., 2017, 109, 548–563 CrossRef CAS
.
- W. Wang, J. Qi, Y. Sui, Y. He, Q. Meng, F. Wei and Y. Jin, J. Nanosci. Nanotechnol., 2018, 18(8), 5600–5608 CrossRef CAS PubMed
.
- D. S. Ahmed, G. A. El-Hiti, E. Yousif, A. A. Ali and A. S. Hameed, J. Polym. Res., 2018, 25(3), 75–95 CrossRef
.
- M. R. Benzigar, S. N. Talapaneni, S. Joseph, K. Ramadass, G. Singh, J. Scaranto, U. Ravon, K. Al-Bahily and A. Vinu, Chem. Soc. Rev., 2018, 47(8), 2680–2721 RSC
.
- B. Yi, X. Chen, B. Zeng, K. Guo, Z. Wan, Q. Qian, H. Yan and J. Chen, J. Porous Mater., 2012, 19(1), 37–44 CrossRef CAS
.
- M. Wu, P. Ai, M. Tan, B. Jiang, Y. Li, J. Zheng, W. Wu, Z. Li, Q. Zhang and X. He, Chem. Eng. J., 2014, 245, 166–172 CrossRef CAS
.
- Q. Pang, J. Tang, H. Huang, X. Liang, C. Hart, K. C. Tam and L. F. Nazar, Adv. Mater., 2015, 27(39), 6021–6028 CrossRef CAS PubMed
.
- K. Siuzdak and R. Bogdanowicz, Energy Technol., 2018, 6(2), 223–237 CrossRef CAS
.
- X. Qian, M. Ren, M. Fang, M. Kan, D. Yue, Z. Bian, H. Li, J. Jia and Y. Zhao, Appl. Catal., B, 2018, 231, 108–114 CrossRef CAS
.
- L. P. Rivoira, B. C. Ledesma, J. M. Juárez and A. R. Beltramone, Fuel, 2018, 226, 498–507 CrossRef CAS
.
- K. Zhi, L. Wang, Y. Zhang, X. Zhang, L. Zhang, L. Liu, J. Yao and W. Xiang, J. Mol. Recognit., 2018, 31(3), e2627–e2635 CrossRef PubMed
.
- D. Hulicova-Jurcakova, M. Seredych, G. Q. Lu and T. J. Bandosz, Adv. Funct. Mater., 2009, 19(3), 438–447 CrossRef CAS
.
- Z. Li, Z. Xu, X. Tan, H. Wang, C. M. B. Holt, T. Stephenson, B. C. Olsen and D. Mitlin, Energy Environ. Sci., 2013, 6(3), 871 RSC
.
- X. Zhou, P. Wang, Y. Zhang, L. Wang, L. Zhang, L. Zhang, L. Xu and L. Liu, J. Mater. Chem. A, 2017, 5(25), 12958–12968 RSC
.
- J. Wei, D. Zhou, Z. Sun, Y. Deng, Y. Xia and D. Zhao, Adv. Funct. Mater., 2013, 23(18), 2322–2328 CrossRef CAS
.
- Y. Liu, Y. Liu, Z. Liu, X. Hu and Z. Xu, Anal. Bioanal. Chem., 2018, 410(2), 509–519 CrossRef CAS PubMed
.
- A. A. Sharipova, S. B. Aidarova, N. E. Bekturganova, A. Tleuova, M. Schenderlein, O. Lygina, S. Lyubchik and R. Miller, Colloids Surf., A, 2016, 505, 193–196 CrossRef CAS
.
- Y. Liu, X. Zhu, F. Qian, S. Zhang and J. Chen, RSC Adv., 2014, 4(109), 63620–63626 RSC
.
- J. Liu, Y. Deng, X. Li and L. Wang, ACS Sustainable Chem. Eng., 2016, 4(1), 177–187 CrossRef CAS
.
- Z. Y. Ryu, J. T. Zheng, M. Z. Wang and B. J. Zhang, Carbon, 1999, 37(8), 1257–1264 CrossRef CAS
.
- J. Ding, H. Wang, Z. Li, K. Cui, D. Karpuzov, X. Tan, A. Kohandehghan and D. Mitlin, Energy Environ. Sci., 2015, 8(3), 941–955 RSC
.
- H. Wang, Z. Xu, A. Kohandehghan, Z. Li, K. Cui, X. Tan, T. J. Stephenson, C. K. King'ondu, C. M. B. Holt, B. C. Olsen, J. K. Tak, D. Harfield, A. O. Anyia and D. Mitlin, ACS Nano, 2013, 7(6), 5131–5141 CrossRef CAS PubMed
.
- C. Long, X. Chen, L. Jiang, L. Zhi and Z. Fan, Nano Energy, 2015, 12, 141–151 CrossRef CAS
.
- J. Ding, H. Wang, Z. Li, A. Kohandehghan, K. Cui, Z. Xu, B. Zahiri, X. Tan, E. M. Lotfabad, B. C. Olsen and D. Mitlin, ACS Nano, 2013, 7(12), 11004–11015 CrossRef CAS PubMed
.
- E. M. Lotfabad, J. Ding, K. Cui, A. Kohandehghan, W. P. Kalisvaart, M. Hazelton and D. Mitlin, ACS Nano, 2014, 8(7), 7115–7129 CrossRef CAS PubMed
.
- X. Han, H. Jiang, Y. Zhou, W. Hong, Y. Zhou, P. Gao, R. Ding and E. Liu, J. Alloys Compd., 2018, 744, 544–551 CrossRef CAS
.
- G. Lin, R. Ma, Y. Zhou, Q. Liu, X. Dong and J. Wang, Electrochim. Acta, 2018, 261, 49–57 CrossRef CAS
.
- S. Yan, J. Lin, P. Liu, Z. Zhao, J. Lian, W. Chang, L. Yao, Y. Liu, H. Lin and S. Han, RSC Adv., 2018, 8(13), 6806–6813 RSC
.
- Y. Q. Zhao, M. Lu, P.-Y. Tao, Y.-J. Zhang, X.-T. Gong, Z. Yang, G.-Q. Zhang and H.-L. Li, J. Power Sources, 2016, 307, 391–400 CrossRef CAS
.
- M. Aziz and A. F. Ismail, X-Ray Photoelectron Spectroscopy (XPS), Elsevier, 2017, pp. 81–93 Search PubMed
.
- C. R. Brundle, X-Ray Photoelectron Spectroscopy, Butterworth-Heinemann, Boston, 1992, pp. 282–299 Search PubMed
.
- H. Seyama, M. Soma and B. K. G. Theng, X-Ray Photoelectron Spectroscopy, Elsevier, 2013; vol. 5, pp. 161–176 Search PubMed
.
- J. Xu, Z. Tan, W. Zeng, G. Chen, S. Wu, Y. Zhao, K. Ni, Z. Tao, M. Ikram, H. Ji and Y. Zhu, Adv. Mater., 2016, 28(26), 5222–5228 CrossRef CAS PubMed
.
- S. Song, F. Ma, G. Wu, D. Ma, W. Geng and J. Wan, J. Mater. Chem. A, 2015, 3(35), 18154–18162 RSC
.
- L. Zhang, T. You, T. Zhou, X. Zhou and F. Xu, ACS Appl. Mater. Interfaces, 2016, 8(22), 13918–13925 CrossRef CAS PubMed
.
- J. Hou, C. Cao, F. Idrees and X. Ma, ACS Nano, 2015, 9(3), 2556–2564 CrossRef CAS PubMed
.
- R. Xing, T. Zhou, Y. Zhou, R. Ma, Q. Liu, J. Luo and J. Wang, Nano-Micro Lett., 2018, 10(1), 3–16 CrossRef PubMed
.
- E. Frackowiak, M. Meller, J. Menzel, D. Gastol and K. Fic, Faraday Discuss., 2014, 172, 179–198 RSC
.
- K. G. Latham, A. Rawal, J. M. Hook and S. W. Donne, RSC Adv., 2016, 6(16), 12964–12976 RSC
.
- X. Wei, X. Jiang, J. Wei and S. Gao, Chem. Mater., 2016, 28(2), 445–458 CrossRef CAS
.
- D. W. Wang, F. Li, L. C. Yin, X. Lu, Z. G. Chen, I. R. Gentle, G. Q. Lu and H. M. Cheng, Chemistry, 2012, 18(17), 5345–5351 CrossRef CAS PubMed
.
- K. Wang, N. Zhao, S. Lei, R. Yan, X. Tian, J. Wang, Y. Song, D. Xu, Q. Guo and L. Liu, Electrochim. Acta, 2015, 166, 1–11 CrossRef CAS
.
- W. Wang, J. Qi, Y. Sui, Y. He, Q. Meng, F. Wei and Y. Jin, J. Nanosci. Nanotechnol., 2018, 18(8), 5600–5608 CrossRef CAS PubMed
.
- Y. Luan, Y. Huang, L. Wang, M. Li, R. Wang and B. Jiang, J. Electroanal. Chem., 2016, 763, 90–96 CrossRef CAS
.
- M. Yu, Y. Han, J. Li and L. Wang, Chem. Eng. J., 2017, 317, 493–502 CrossRef CAS
.
- B. Lu, L. Hu, H. Yin, X. Mao, W. Xiao and D. Wang, Int. J. Hydrogen Energy, 2016, 41(41), 18713–18720 CrossRef CAS
.
- T. Liu, L. Zhang, B. Cheng, W. You and J. Yu, Chem. Commun., 2018, 54(30), 3731–3734 RSC
.
- S. Liu, S. C. Lee, U. M. Patil, C. Ray, K. V. Sankar, K. Zhang, A. Kundu, S. kang, J. H. Park and S. Chan Jun, J. Mater. Chem. A, 2017, 5(9), 4543–4549 RSC
.
- L. Zhang, L. Xu, Y. Zhang, X. Zhou, L. Zhang and A. Yasin, RSC Adv., 2018, 8(7), 3869–3877 RSC
.
- R. Gao, X. Kong, F. Su, X. He, L. Chen and Y. Zhang, J. Chromatogr. A, 2010, 1217(52), 8095–8102 CrossRef CAS PubMed
.
- Y. Chen, X. Lei, R. Dou, Y. Chen, Y. Hu and Z. Zhang, Environ. Sci. Pollut. Res., 2017, 24(22), 18640–18650 CrossRef CAS PubMed
.
- S. K. Behera, S.-Y. Oh and H.-S. Park, J. Hazard. Mater., 2010, 179(1–3), 684–691 CrossRef CAS PubMed
.
- B. Liu, J. Lu, Y. Xie, B. Yang, X. Wang and R. Sun, J. Colloid Interface Sci., 2014, 418, 311–316 CrossRef CAS PubMed
.
Footnote |
| † Electronic supplementary information (ESI) available. See DOI: 10.1039/c8ra08332k |
| This journal is © The Royal Society of Chemistry 2018 |

