 Open Access Article
Study of catalytic ozonation for tetracycline hydrochloride degradation in water by silicate ore supported Co3O4†
Lisha Luo abc,
Donglei Zoua,
Dongwei Lu
 *c,
Fengli Yub,
Bingjing Xin
 b and
Jun Mac
aKey Laboratory of Ministry of Education for Groundwater Resources and Environment, College of New Energy and Environment, Jilin University, Changchun 130000, P. R. China
bCollege of Resources and Environmental Engineering, Jilin Institute of Chemical Technology, Jilin 132022, China
cState Key Laboratory of Urban Water Resource and Environment, Harbin Institute of Technology, Harbin 150090, P. R. China. E-mail: lvdongwei@hit.edu.cn
First published on 7th December 2018
Abstract
Tetracycline hydrochloride (TCH) degradation by cobalt modified silicate ore (CoSO) catalytic ozonation in aqueous solution was investigated. CoSO catalyst was synthesized by an impregnation method using Co(NO3)2 as the precursor and natural silicon ore (SO) as the support. The key catalyst preparation conditions (i.e., impregnation concentration, calcination temperature and time) were optimized. The activity and stability of CoSO catalyst and its catalytic ozonation mechanism for TCH degradation were studied. The results showed that Co3O4 was successfully coated on the silicon ore and the CoSO catalyst was highly efficient in catalytic ozonation for TCH degradation. The TCH removal by CoSO/O3 could reach 93.2%, while only 69.3% by SO/O3 and only 46.0% by O3 alone at 25 min. The reaction of TCH degradation followed pseudo-first order kinetics. TOC removal rate by CoSO/O3 was 2.0 times higher than that by SO/O3, and 3.5 times higher than that by O3 alone. The reaction conditions (TCH initial concentration, catalyst concentration, pH and temperature) for catalytic ozonation were systematically investigated. The possible mechanism for the CoSO catalytic ozonation process was proposed, where hydroxyl radical oxidation mainly accounted for the substantial TCH degradation. Furthermore, CoSO showed great durability and stability after seven reaction cycles.
1. Introduction
Tetracycline hydrochloride (TCH, C22H24N2O8·HCl) is the second most widely used antibiotic for disease control and animal enhancing growth.1 It has a stable chemical structure and is difficult to be metabolized completely in the bodies of people or animals.2 It enters into wastewater and soil by excreted feces or urine, as pharmaceutically active forms and degradation products.3 In addition, due to its poor biodegradability and antibiotic properties, it is difficult for the conventional biological treatment technology to remove TCH thoroughly.1,4 Thus, it accumulates in aquatic environments and leads to the proliferation of antibiotic-resistance genes, disrupts ecosystem function and ultimately harms human health.5Recently, advanced oxidation processes (AOPs) such as ozone, Fenton and photocatalytic oxidation, have been extensively applied for the treatment of antibiotic wastewater.6 Ozone, as the conventionally powerful oxidant, has been conceived as a safe and clean oxidation technology. However, high energy demand and operation cost, low oxidation efficiency and selectivity towards organic substrates restrict its large-scale industrial applications.7 Combining ozone with the solid phase catalysts can accelerate the decomposition of ozone into hydroxyl radicals (·OH) and somehow overcome the limitations of ozonation alone.8 It has relatively low energy demand and high degradation and mineralization effectiveness of some refractory organic pollutants in waters, thus becoming a research hot spot in the field of ozone oxidation.7 So far, various solid catalysts have been reported including metal oxides, supported metals/metal oxides and some porous materials.9–16 Cobalt oxide is one of the highly reactive metal oxide as an ozonation catalyst.11 In order to facilitate the separation of the cobalt oxide catalyst from water and provide more active sites on catalysts, some porous materials were used as supporters. Qi et al.7 reported that the catalytic ozonation of phenol using Co3O4/nitrogen-doping graphene (Co3O4/NG) greatly improved the removal rate of the phenol. Hu et al.12 reported that cobalt oxide supported on mesoporous zirconia (CoOx/MZ) enhanced the mineralization of 2,4-D. Asma et al.13 studied that the catalytic ozonation of nitrobenzene using cobalt supported activated carbon catalyst (Co/OSAC) exhibited a high activity compare to ozone alone and OSAC. However, the carbon-based materials can generate large amount of sludge and is easily oxidized by ozone.17–19 In addition, the synthetic materials are high cost and may cause pollution problems to the environment. These disadvantages are the main limitation for the application of carbon-based materials and synthetic catalysts in the catalytic ozonation.20
In the present work, cobalt was modified on the natural and environmental-friendly mineral material (i.e., silicate ore) through efficient and simple impregnation method. Cobalt modified silicate ore was characterized by SEM-EDS, XRD, XPS, and BET, etc. The catalytic performance of CoSO in ozonation of TCH was investigated and the corresponding catalyzed ozonation mechanism was proposed. The influence of the catalyst preparation conditions were systematically studied. A series of experiments were designed to understand the degradation mechanism of TCH in the catalytic ozonization reactor. Furthermore, the stability and reusability of catalyst under optimum experimental conditions were also evaluated.
2. Materials and methods
2.1 Chemicals
The commercial tetracycline hydrochloride, with purity more than 98.0%, was purchased from Sigma-Aldrich. Physicochemical property of tetracycline hydrochloride1 was shown in Table S1.† Cobaltous nitrate (Co(NO3)2·6H2O) was purchased from Beijing chemical industry group Co., Ltd., China. Acetonitrile (HPLC Grade) were obtained from Shanghai Sinopharm Chemical Reagent Co. Ltd. (China). TBA (AR Grade, 99.9%), HClO4 and NaOH were obtained from the Tianjin Ruijinte Chemical Reagent Co., Ltd. All chemicals were analytical grade. Silicate ore was obtained from Harbin Institute of Technology.2.2 Preparation and characterization of CoSO catalyst
Co(NO3)2·6H2O was used as Co source to prepare CoSO catalyst, which was prepared by incipient wetness impregnation. Detailed preparation process was as follows: first, the SO particles were washed with deionized water more than three times to remove surface dust, and then dried at 100 °C for 24 h. The raw sample was grinded by a high-speed universal mill and then sieved to +60 to 40 mesh particle size fractions. Second, 5 g of crushed SO was soaked in Co(NO3)2·6H2O solution (0.5 mol L−1, 100 mL), and use the water bath shock for 24 h keeping 30 °C. After that, the suspension was precipitated and filtrated, which was then dried at 70 °C for 36 h before calcination treatment (500 °C for 5 h in air). After calcination, the prepared catalyst CoSO was cooled to room temperature and stored in a desiccator. Precursor (Co(NO3)2·6H2O) solution concentration, calcination temperature and calcination time were investigate to optimize the preparation condition for CoSO catalyst.Pores characteristics and specific surface area of CoSO were determined by N2 adsorption and desorption isotherms at 77 K on a Quantasorb surface area analyzer (ASAP-2020, Micromeritics, USA). The specific surface areas, pore volume and size of the materials were estimated by Brunauer–Emmett–Teller (BET) method. The morphology of the samples was visualized by SEM-EDS (JSM-6490LV, Japan), and the catalyst surface was sputter coated with gold. X-ray diffraction (XRD) patterns of CoSO catalysts were characterized by a D/max-RA XRD instrument (Rigaku, Japan). The content of elements in CoSO catalyst was determined by X-ray photoelectron spectroscopy (XPS, Kratos-AXIS ULTRA DLD, Japan).
2.3 Catalytic ozonation procedure
Catalytic ozonation procedure was carried out in a semibatch mode by using the experimental installation shown in Fig. S1.† Ozone was produced in situ from dry air by a DHX-I laboratory ozone generator (Harbin Jiujiu Electrochemistry Technology, China). Ozone was immediately added into the solution through the microporous titanium diffuser after the addition of catalyst. The slurry was continuously stirred. In most cases, the initial TCH concentration, the ozone gas concentration, the ozone flow rate and the catalyst concentration were 30 mg L−1, 1.0 mg L−1, 400 mL min−1 and 1.0 g L−1, respectively. The dissolved ozone concentration in water was measured by the indigo method. The gaseous ozone 1 mg L−1 was bubbled into the reactor to get 500 mL ozone saturated aqueous solution, and the concentration of ozone in the liquid phase was shown in Fig. S2.† The reaction temperature remained at 20 °C. The initial pH of TCH solution was about 7.0 and regulated using HClO4 and NaOH solutions.2.4 Analysis methods
The TCH samples were filtered through a Millipore filter (0.22 μm), and then analyzed by means of a 1200 series high-performance liquid chromatography (HPLC, Agilent, USA) with a UV detector at 365 nm and XDB-C18 column (4.6 × 150 mm, 5 μm). The mobile phase was acetonitrile and 0.01 mol L−1 aqueous oxalic acid (31![[thin space (1/6-em)]](https://www.rsc.org/images/entities/char_2009.gif) :
:![[thin space (1/6-em)]](https://www.rsc.org/images/entities/char_2009.gif) 69, v/v) mixture at room temperature, with a constant flow rate of 1.0 mL min−1. The gas ozone concentration was measured by the iodometric method.21 The dissolved ozone concentration in water was measured by the indigo method.22
69, v/v) mixture at room temperature, with a constant flow rate of 1.0 mL min−1. The gas ozone concentration was measured by the iodometric method.21 The dissolved ozone concentration in water was measured by the indigo method.22
After each reuse, the CoSO catalyst was washed with deionized water several times and dried 24 h at 100 °C. The released cobalt ion was measured by inductively coupled plasma (ICP) on an OPTIMA 5300DV (PerkinElmer Co., USA). Total organic carbon (TOC) was determined by a Shimadzu TOC-VCPH analyzer. The point of zero charge (pHpzc) of CoSO catalyst was measured with a Zetasizer Nano (Malvern, UK).
2.5 Synthesis of CoSO catalysts
Insufficient or excess Co3O4 loading content was not favorable for the catalytic activity. The possible reason for this phenomenon was that low metal oxide contents of CoSO would cause low catalytic activity while too much metal oxide contents would reduce the specific surface area of the CoSO. Moreover, Co3O4 on the surface of the SO was essential for catalytic ozonation. The dosage of Co3O4 obviously affected the pollutant degradation efficiency. It can promote ozone to rapidly decompose into ·OH.11 But excess metal oxides would resulted in ·OH quenching.24 Therefore, the catalyst with a concentration of 0.5 mol L−1 Co(NO3)3·6H2O was prepared in the further experiments. The content of Co element in CoSO catalyst was 11.2% (denoted as 11.2% CoSO).
2.6 Investigation of 11.2% CoSO system
SEM of the SO and CoSO samples were shown in Fig. S6.† Significant differences were found among the SO and CoSO. For the SO, the particle was relatively small and scattered in Fig. S6(a)†. After the cobalt modification, the particles of CoSO showed bigger size than SO in Fig. S6(b)†. The agglomeration of such particles may be caused by calcination.
EDS spectrum of SO, CoSO, and elemental mapping of the CoSO catalyst were shown in Fig. S7,†O, Al and Si were the domain elements in the natural SO with the ratio of 55.3, 3.3, and 39.4%, respectively. The Co element was presence in the CoSO catalyst. O, Al, Si and Co were detected as the domain elements in the CoSO catalyst with the ratio of 51.7, 2.2, 34.9 and 11.2%, respectively. Moreover, the Co element was evenly distributed on the surface of the SO (Fig. S7(f)†). The results indicated that the Co element was successfully coated on the SO surface.
Fig. 2 revealed the surface chemical components of SO and CoSO materials. As shown in Fig. 2a, the characteristic peaks of the SO corresponded to Si 2p, C 1s and O 1s, while the characteristic peaks of the CoSO corresponded to Si 2p, C 1s, O 1s and Co 2p. It confirmed the presence of Co in the CoSO composites. Fig. 2b showed the Co 2p XPS spectrum of the synthesized catalyst. The two peaks had a peak separation of 15.0 eV and binding energies at 794.8 and 779.8 eV, which correspond to the characteristic XPS peaks of Co3O4.25,26 The O 1s region could be decomposed into four peaks (Fig. 3c), the peaks at 531.8 eV and 532.4 eV were assigned to surface adsorbed oxygen. The peak at 532.9 eV was due to the chemically or physically adsorbed water, and 533.5 eV was likely associated with Si–O–Si.27,28 Fig. 2d showed the peak at 103.3 eV corresponding to Si 2p.29
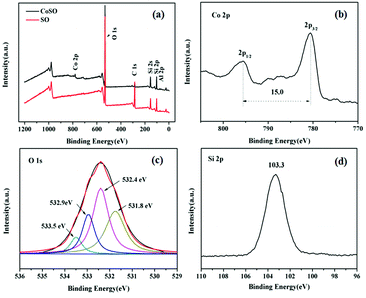 | ||
| Fig. 2 XPS spectra analysis of the SO and CoSO catalyst. (a) Wide-range scan of the SO and CoSO; (b) Co 2p, (c) O 1s and (d) Si 2p of the CoSO composites. | ||
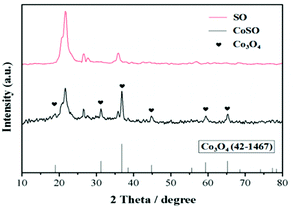
The XPS results indicated that the presence of oxidized cobalt species as Co3O4 in the CoSO catalyst. It was consistent with the XRD patterns (Fig. 1).
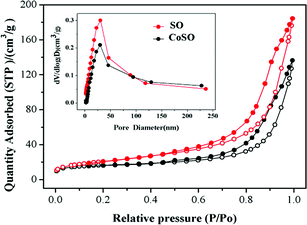
The pore size distributions and N2 adsorption–desorption isotherms of both SO and CoSO were shown in Fig. 3. Two samples exhibited adsorption–desorption isotherms identified as typical type IV with hysteresis loops, which means that the SO and CoSO catalyst had mesoporous structures.29 The data concerning their BET, pore volume and average pore size were listed in Table 1. The specific surface areas of the SO and CoSO were 75 and 57 m2 g−1, respectively. The results illustrate that the modification of SO by cobalt decreased its specific surface area, pore volume and average pore size. This may be that the cobalt oxide dispersed into the pores of the SO and the agglomeration of CoSO particles during the sintering process (as Fig. S5†).
| Sample | BET (m2 g−1) | Pore volume (cm3 g−1) | Average pore size (nm) |
|---|---|---|---|
| SO | 75 | 0.24 | 12.95 |
| CoSO | 57 | 0.17 | 11.90 |
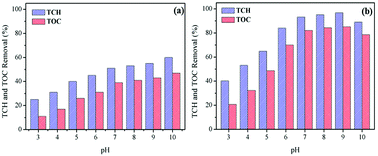
Influence of initial pH. Influence of initial pH on TCH and TOC removal in the processes of ozonation alone and CoSO catalytic ozonation, respectively, were exhibited in Fig. 4. As shown in Fig. 4a, the removal efficiency of TCH by ozonation alone increased significantly with the increase of initial solution pH. This could be due to that the pH increase promoted the decomposition of ozone to produce ·OH.30 The decomposition of O3 occurs as followings:
| O3 + OH−→O2˙− + HO2˙ | (1) |
| O3 + HO2˙ → 2O2 + ·OH | (2) |
As for O3 alone, O3 was the main oxidant at initial pH of 3, which led to lower TCH degradation. However, when the initial pH increased from 7 to 10, both O3 (oxidation potential 2.07 eV) and ·OH (higher oxidation potential 2.8 eV) were the predominant oxidants, thus causing more TCH degradation. Compared to O3 alone, the degradation rate of TCH had been obviously improved in CoSO catalytic ozonation system. The degradation rate of TCH reached 53.2% significantly higher than 32.1% with O3 alone at pH 4. This indicated that the catalyst CoSO can efficiently induce the decomposition of ozone to produce ·OH, which was difficult to decompose under low pH. The TCH degradation rates were more than 93.2% at pH from 7 to 9 in CoSO/O3 system. This showed that the CoSO/O3 system had excellent catalytic effect, and the catalyst promoted the decomposition of ozone to produce ·OH and effectively enhanced the TCH degradation. Correspondingly, the TOC removal rate increased with initial pH increasing in O3 alone, and the maximum TOC removal was only 47.5% (Fig. 4a). In comparison, TOC removal rates at all pH conditions were greatly higher in CoSO catalytic ozonization (Fig. 4b). It should be noticed that, when the initial pH of the solution increased from 9 to 10, the TCH and TOC removal rates decreased in CoSO/O3. This phenomenon could be due to the following two reasons: (i) the excessively generated ·OH reacted with each other; (ii) ·OH reacted with hydroperoxyl (HO2˙) free radical generated during O3 decomposition.24 The two mainly reactions were as follows:
| ·OH + ·OH → H2O2 | (3) |
| HO2˙ + ·OH → H2O + O2 | (4) |
TCH can be positively charged, zwitterionic or negatively charged under different pH conditions with three pKa values (∼3.3, ∼7.7 and ∼9.7). At low pH, TCH was fully protonated into TCH3+. With the increase of pH, deprotonation reactions took place in three steps, where TCH2, TCH− and TCH2− increased.31 Generally, the dissociation degree and deprotonation of TCH increased with pH increase, which contributed to its affinity reaction with O3.32 Therefore, the TCH removal rate increased accordingly in Fig. 4.
The surface charge of metal oxide was largely determined by its hydroxyl groups.33 The catalyst becomes protonated or deprotonated depending on the solution pH below or above the pHpzc as follows:34
| M–OH + H+ ⇔ M–OH2+ pH < pHpzc | (5) |
| M–OH + OH− ⇔ M–O− + H2O pH > pHpzc | (6) |
The pHpzc of prepared CoSO was 7.97. It was deprotonated and negatively charged in aqueous solution at pH > 7.97. As reported by Chen et al.,24 negatively charged surface had a strong reactivity toward ozone, which contributed to the ozone oxidation. In the present study, the optimum solution pH was 9. The removal efficiency of TCH and TOC at pH 9.0 was only a little higher than that at pH 7.0. Therefore, in order to make the reaction system convenient and simple to operate, the further catalytic ozonation experiments were conducted at pH 7.0.
Influence of TCH initial concentration. As shown in Fig. 5a, the degradation of TCH decreased remarkably with initial TCH ranged at 5–50 mg L−1 in the CoSO/O3 system. Same trend showed in Fig. 5b that the TOC removal efficiency decreased with the increase of initial TCH concentration. This indicated that the initial concentration had a negative effect on TCH and TOC removal. Obviously, due to the same quantity of CoSO catalysts in catalytic ozonation process, the number of active sites on the CoSO catalysts surface remain stable. Therefore, low-concentration TCH would be degraded quickly. Furthermore, the surface activities of CoSO might decrease due to the adsorption of TCH or its intermediate products as initial TCH concentration increasing, thus leading to the decrease of TCH and TOC removal.35,36
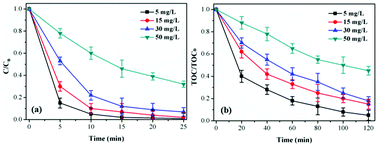 | ||
| Fig. 5 Influence of initial TCH concentration on TCH degradation and TOC removal. Initial pH = 7.0; T = 20 °C; gaseous ozone = 1.0 mg L−1; catalyst = 1.0 g L−1. | ||
Influence of reaction temperature. The reaction temperature was an important factor for TCH degradation, which influenced the ozone solubility and reaction rate in aqueous solution.37 Fig. 6 presented the influence of reaction temperature (5, 10, 20 and 35 °C) on catalytic ozonation activity of CoSO for of TCH degradation. As shown in Fig. 7, TCH removal efficiency slightly increased, while TOC removal significantly increased from 37.6% to 82.1% with temperature increasing from 5 °C to 20 °C at 120 min. However, TCH and TOC removal were reduced when the temperature further increased to 35 °C. Increase reaction temperature can produce higher chemical reaction rate constant and improve the TCH degradation,38 while ozone solubility in water would decrease with temperature increasing.27 Therefore, 20 °C was selected as the optimal reaction temperature for catalytic ozonation of TCH over CoSO.
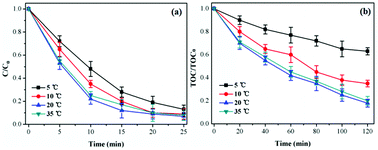 | ||
| Fig. 6 Influence of reaction temperature on TCH degradation and TOC removal. Initial pH = 7.0; initial TCH = 30 mg L−1; gaseous ozone = 1.0 mg L−1; catalyst = 1.0 g L−1. | ||
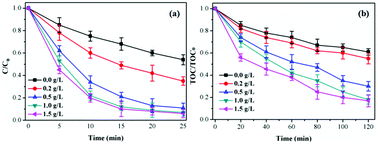 | ||
| Fig. 7 Influence of catalyst concentration on TCH degradation and TOC removal. Initial pH = 7.0; initial TCH = 30 mg L−1; T = 20 °C; gaseous ozone = 1.0 mg L−1. | ||
Influence of catalyst concentration. As shown in Fig. 7, the TCH removal efficiency increased from 46.7% to 93.9% at 25 min and TOC removal efficiency from 39.2% to 83.2% with catalyst concentration increasing from 0.0 g L−1 to 1.5 g L−1. The increasing of catalyst concentration was conducive to improve the specific surface area and active sites thus accelerating O3 decomposition and generating more ·OH. This would increase the removal efficiency of TCH and TOC.39 However, the TCH (TOC) removal efficiency only increased 0.7% (1.1%) when the catalyst concentration increased from 1.0 g L−1 to 1.5 g L−1 due to the limited amount of O3 in the catalytic ozonation reaction system.9 Considering the treatment cost, 1.0 g L−1 was chosen as the catalyst concentration in the following experiments.
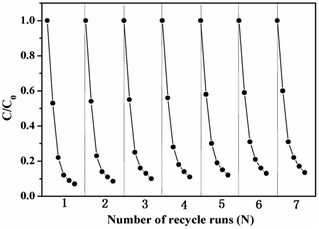
Catalyst stability and reusability of 11.2% CoSO system. Considering the industrial application of the CoSO catalysts, it is essential to maintain the high catalytic activity, stable structure and lower metal ions leaching for long operation times. The CoSO catalysts were reused seven times to examine their stability performances for the TCH degradation. As shown in Fig. 8, the TCH degradation had no obvious deactivation with the increase of using times. The TCH removal efficiency remain almost unchanged throughout seven successive runs. Besides that, the concentrations of leached cobalt ions from the CoSO into the solution after 25 min of catalytic ozonation was below 0.015 mg L−1. The leached ion concentration meets the Integrated Wastewater Discharge Standard in China.23 The results indicated that the CoSO catalyst had an excellent long-term stability.
2.7 Possible reaction mechanism during CoSO catalytic ozonation process
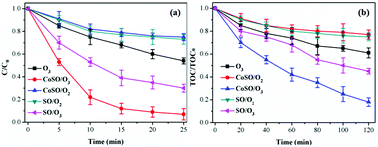 | ||
| Fig. 9 Comparison of TCH and TOC removal among different processes. Initial pH = 7.0; initial TCH = 30 mg L−1; T = 20 °C; gaseous ozone = 1.0 mg L−1; catalyst = 1.0 g L−1. | ||
In general, CoSO had an excellent catalytic activity on both TCH and TOC removal. In addition, the adsorption property of the catalyst also promoted TCH degradation and mineralization. However, the TOC removal rate was only 82.1% at 120 minutes, which was significantly less than the removal efficiency of the TCH. This result was because TCH was degraded into a large number of intermediates during ozone oxidation, which were difficult to oxidize completely and quickly.
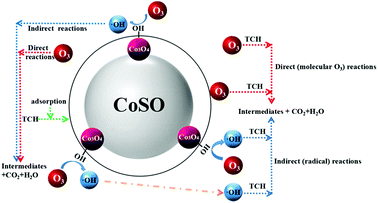
In catalytic ozonation process, surface hydroxyl groups on the catalyst surface would facilitate the ozone decomposition. In addition, ozone could be adsorbed on the catalyst surface due to its electrophilic character which promotes the ozone decomposition and the generation of ·OH.42 As shown in Fig. S10,† the addition of H2O2 significantly improved the TCH degradation by ozone, which can promote ozone decomposition to generate more reactive ·OH. The H2O2 experiment further supported our proposed mechanism. In our experiment, the pHpzc of CoSO was 7.97, it was protonated and positively charged in aqueous solution at pH < 7.97. In addition, when the pH was more than 7.7 (pKa2) the majority of TCH molecules in solution were in the form of anion.43 When the solution pH located between pKa2 and pHpzc, it would enhance the adsorption between negatively charged TCH and positively charged CoSO catalysts. As shown in Fig. 4, TCH had a high degradation rate when pH value was between 7 and 9. This indicated that oxidation reaction of TCH took place on the surface of catalyst to some extent. In addition, TBA was hardly adsorbed on the surface of catalysts,43 and the addition of TBA could effectively inhibit the TCH oxidation through bulk reactions instead of that on catalyst surface. TCH was still decomposed in the addition of TBA indicating that its oxidation also occurred on catalyst surface. Overall, the degradation of TCH with CoSO could be attributed to a synergistic mechanism that combines TCH oxidation at the surface of catalyst as well as in the bulk liquid phase (As shown in Fig. 10). Simultaneously, it was illustrated in the formula (7)–(12).
(I) Catalyst surface reaction:
(a) Indirect (radical) reactions
| CoSO−·OH + TCH → CoSO + CO2 + H2O + intermediates | (7) |
| CoSO−TCH + ·OH → CoSO + CO2 + H2O + intermediates | (8) |
(b) Direct (molecular O3) reactions
| CoSO−O3 + TCH → CoSO + CO2 + H2O + intermediates | (9) |
| CoSO−TCH + O3 → CoSO + CO2 + H2O + intermediates | (10) |
(II) Bulk solution reaction:
(a) Indirect (radical) reactions
| TCH + ·OH → intermediates + CO2 + H2O | (11) |
(b) Direct (molecular O3) reactions
| TCH + O3 → intermediates + CO2 + H2O | (12) |
3. Conclusions
In this study, natural silicate ore as a catalyst support was modified through immobilization of cobalt metal oxide using incipient wetness impregnation method. The CoSO catalyst with impregnation concentration of 0.5 mol L−1, calcination temperature at 500 °C and calcination time at 5 h showed the best performance on ozonation of TCH. Compared to the O3 alone and SO/O3 process, the presence of CoSO obviously improved the degradation and mineralization efficiency of TCH. The TCH and TOC removal in ozone oxidation process followed apparent first-order kinetics. The presence of TBA significantly inhibits TCH degradation indicating that the oxidation mechanism of TCH occured via hydroxyl radical. The catalyst activity of CoSO on TCH and TOC removal slightly decreased with used cycle increasing. In general, the CoSO catalyst has great application potential to remove antibiotic wastewater because of its excellent catalytic activity, good stability and low cost.Conflicts of interest
There are no conflicts to declare.Acknowledgements
This work was financially supported by the Fundamental Research Funds for the Central Universities (Grant No. HIT. NSRIF.2019047), the China Postdoctoral Science Special Foundation (No. 2018T110304) and Heilongjiang Postdoctoral Fund (No. LBH-Z17059).References
- H. Xiong, S. Dong, J. Zhang, D. Zhou and B. E. Rittmann, Water Res., 2018, 136, 75 CrossRef CAS PubMed.
- Y. Wang, H. Zhang, J. Zhang, C. Lu, Q. Huang, J. Wu and F. Liu, J. Hazard. Mater., 2011, 192, 35 CAS.
- C. Pacheco, M. Polo, J. Utrilla and J. PeNalver, Chem. Eng. J., 2011, 178, 115 CrossRef.
- I. Dalmázio, M. Almeida and R. Augusti, J. Am. Soc. Mass Spectrom., 2007, 18, 679 CrossRef PubMed.
- H. Xiong, D. Zou, D. Zhou, S. Dong, J. Wang and B. E. Rittmannd, Chem. Eng. J., 2017, 316, 7 CrossRef CAS.
- L. Hou, H. Zhang, L. Wang and L. Chen, Chem. Eng. J., 2013, 229, 577 CrossRef CAS.
- Q. Bao, K. S. Hui and J. G. Duh, J. Environ. Sci., 2016, 50, 38 CrossRef PubMed.
- L. Luo, D. Zou, D. Lu, B. Xin, M. Zhou, X. Zhai and J. Ma, RSC Adv., 2018, 8, 33534 RSC.
- L. Gang, Y. Lu, L. Cheng, M. Zhu, C. Zhai, Y. Du and P. Yang, J. Hazard. Mater., 2015, 294, 201 CrossRef PubMed.
- M. Fathinia, A. Khataee, S. Aber and A. Naseri, Appl. Catal., B, 2016, 184, 270 CrossRef CAS.
- Y. Dong, K. He, L. Yin and A. Zhang, Nanotechnology, 2007, 18, 435602 CrossRef.
- C. Hu, S. Xing, A. Jiuhui Qu and H. He, J. Phys. Chem., 2008, 112, 5978 CAS.
- A. Abdedayem, M. Guiza, F. J. R. Toledo and A. Ouederni, Sep. Purif. Technol., 2017, 184, 308 CrossRef CAS.
- H. Einaga, N. Maeda, S. Yamamoto and Y. Teraoka, Catal. Today, 2015, 245, 22 CrossRef CAS.
- F. Rezaei, G. Moussavi, A. R. Bakhtiari and Y. Yamini, J. Hazard. Mater., 2016, 306, 348 CrossRef CAS PubMed.
- A. Ikhlaq, D. R. Brown and B. Kasprzyk-Hordern, Appl. Catal., B, 2012, 123, 94 CrossRef.
- R. Huang, H. Yan, L. Li, D. Deng, Y. Shu and Q. Zhang, Appl. Catal., B, 2011, 106, 264 CAS.
- X. Lu, Q. Zhang, W. Yang, X. Li, L. Zeng and L. Li, RSC Adv., 2015, 5, 10537 RSC.
- F. Qi, B. Xu, L. Zhao, Z. Chen, L. Zhang, D. Sun and J. Ma, Appl. Catal., B, 2012, 121–122, 171 CrossRef CAS.
- G. Moussavi, R. Khosravi and N. R. Omran, Appl. Catal., A, 2012, 445–446, 42 CrossRef CAS.
- K. Rakness, G. Gordon, B. Langlais, W. Masschelein, N. Matsumoto, Y. Richard, C. M. Robson and I. Somiya, Ozone: Sci. Eng., 1996, 18, 209 CrossRef CAS.
- H. Bader and J. Hoigné, Water Res., 1981, 15, 449 CrossRef CAS.
- B. Reddy, B. Chowdhury and P. G. Smirniotis, Appl. Catal., A, 2001, 211, 19 CrossRef CAS.
- W. Chen, X. Li, Z. Pan, S. Ma and L. Li, Chem. Eng. J., 2016, 304, 594 CrossRef CAS.
- L. Fu, Z. M. Liu, Y. Q. Liu, B. X. Han, P. G. Hu, L. C. Cao and D. B. Zhu, Adv. Mater., 2005, 17, 217 CrossRef CAS.
- C. W. Kung, H. W. Chen, C. Y. Lin, R. Vittal and K. C. Ho, J. Power Sources, 2012, 214, 91 CrossRef CAS.
- X. Tan, Y. Wan, Y. Huang, C. He, Z. Zhang, Z. He, L. Hu, J. Zeng and D. Shu, J. Hazard. Mater., 2017, 321, 162 CrossRef CAS PubMed.
- Y. Nie, C. Hu, N. Li, L. Yang and J. Qu, Appl. Catal., B, 2014, 147, 287 CrossRef CAS.
- H. Yan, P. Lu, Z. Pan, X. Wang, Q. Zhang and L. Li, J. Mol. Catal. A: Chem., 2013, 377, 57 CrossRef CAS.
- Y. Guo, B. Xu and F. Qi, Chem. Eng. J., 2016, 287, 381 CrossRef CAS.
- Y. Wang, H. Zhang, J. Zhang, C. Lu, Q. Huang, J. Wu and F. Liu, J. Hazard. Mater., 2011, 192, 35 CAS.
- M. Khan, H. Bae and J. Jung, J. Hazard. Mater., 2010, 181, 659 CrossRef CAS PubMed.
- B. Kasprzyk-Hordern, M. Ziółek and J. Nawrocki, Appl. Catal., B, 2003, 46, 639 CrossRef CAS.
- L. Zhao, Z. Sun, J. Ma and H. Liu, Environ. Sci. Technol., 2009, 43, 2047 CrossRef CAS.
- Z. Q. Liu, J. Tu, Q. Wang, Y. H. Cui, L. Zhang, L. Zhang, X. Wu, B. Zhang and J. Ma, Sep. Purif. Technol., 2018, 200, 51 CrossRef CAS.
- Y. Ren, H. Zhang, H. An, Y. Zhao, J. Feng, L. Xue, T. Luan and Z. Fan, J. Colloid Interface Sci., 2018, 256, 347 CrossRef PubMed.
- L. Zhao, J. Ma, Z. Sun and X. Zhai, Appl. Catal., B, 2008, 83, 256 CrossRef CAS.
- R. Huang, B. Lan, Z. Chen, H. Yan, Q. Zhang, J. Bing and L. Li, Chem. Eng. J., 2012, 180, 19 CrossRef CAS.
- Y. Huang, W. Xu, L. Hu, J. Zeng, C. He, X. Tan, Z. He, Q. Zhang and D. Shu, Catal. Today, 2017, 297, 143 CrossRef CAS.
- A. Abdedayem, M. Guiza, F. J. R. Toledo and A. Ouederni, Sep. Purif. Technol., 2017, 184, 308 CrossRef CAS.
- G. Moussavi, A. Khavanin and R. Alizadeh, Appl. Catal., B, 2010, 97, 160 CrossRef CAS.
- S. P. Ghuge and A. K. Saroha, J. Environ. Manage., 2018, 211, 83 CrossRef CAS PubMed.
- Z. Hopkins and L. Blaney, Sci. Total Environ., 2014, 468, 337 CrossRef PubMed.
Footnote |
| † Electronic supplementary informations (ESI) available. See DOI: 10.1039/c8ra08402e |
| This journal is © The Royal Society of Chemistry 2018 |

