
 Open Access Article
 This Open Access Article is licensed under a Creative Commons Attribution-Non Commercial 3.0 Unported Licence
A combined experimental-computational investigation on water adsorption in various ZIFs with the SOD and RHO topologies†
Meizhen Gao,
Jing Wang,
Zhenghao Rong,
Qi Shi * and
Jinxiang Dong
* and
Jinxiang Dong
Research Institute of Special Chemicals, College of Chemistry and Chemical Engineering, Taiyuan University of Technology, Taiyuan 030024, China. E-mail: shiqi594@163.com
First published on 27th November 2018
Abstract
We synthesized a series of seven zeolitic imidazolate frameworks (ZIFs), namely ZIF-8, ZIF-90, SIM-1, MAF-6, ZIF-25, ZIF-93 and ZIF-97. Then we investigated the adsorption behavior of water for each ZIF via a combined experimental-computational method. We focused on the van der Waals (vdW) and electrostatic contributions to their water adsorption capacity. The results showed that the vdW interactions were negligible and that electrostatic interactions played a dominant role. Moreover, we studied the effects of topology in the [Zn(almeIm)2] system with the same linker, 4-methylimidazole-5-carbaldehyde (almeIm). We found that SIM-1 with a smaller pore size and higher density exhibited greater water adsorption at low relative pressures, and in contrast, ZIF-93 with a larger pore size and lower density had significantly higher adsorption capacity at high relative pressures.
1. Introduction
Zeolitic imidazolate frameworks (ZIFs), as a type of metal–organic framework, are comprised of transition metal ions (Zn, Co, etc.) and imidazolate linkers.1,2 The ZIF structure is connected in a similar manner as zeolites, where the metal ion and imidazolate linker replace the Si/Al and O atoms, respectively. Furthermore, ZIFs are highly stable.1,2 It is possible to obtain a large number of ZIFs with functional diversity by tuning the various linkers.1,2 Consequently, the combined properties of ZIFs lead to their potential application for adsorptive separation.3Understanding the water adsorption in ZIFs is valuable for adsorptive separation in industry. For example, hydrophobic ZIFs have been extensively studied for the recovery of organics from dilute aqueous solutions.4–6 In addition, due to the presence of trace amounts of water in industrial flue gas, the effect of water on CO2 capture in ZIFs cannot be neglected.7–9 Therefore, it is indispensable to know the adsorption behavior of water in ZIFs before they are considered as practical adsorbents for industrial purposes.
In recent years, the adsorption of water in ZIFs has been investigated through experiments and simulations. Experimentally, Kaskel et al.10 first reported water vapor adsorption in ZIF-8 and showed that ZIF-8 is a highly hydrophobic material. Lively et al.11 performed water vapor adsorption in ZIF-71 and found that its water uptake is very small, confirming that this material is hydrophobic. Chance et al.12 studied water vapor adsorption in ZIF-90 and observed that it exhibits hydrophilic properties. Banerjee et al.13 measured the water vapor adsorption and desorption isotherms in CoNIm (RHO), which showed its hydrophilic character. Nair et al.14,15 investigated the water vapor adsorption isotherms of hybrid ZIF-8-90, and they continuously and drastically controlled the hydrophilicity of the ZIFs by tuning the ratio of mixed linkers. Zhang et al.16 reported on the water adsorption in MAF-6. They observed that MAF-6 exhibits high hydrophobicity in both its external crystal surfaces and internal pores. Yang et al.6 recently measured the water vapor adsorption in ZIF-93, ZIF-97, SIM-1, ZIF-90, and ZIF-8. ZIF-8, MAF-6 and ZIF-71 are extremely hydrophobic due to the existence of unfavorable chlorine-based methyl and ethyl groups for water adsorption. The opposite trend in ZIF-90, ZIF-93, SIM-1, CoNIm (RHO) and ZIF-97 was also confirmed, which have hydrophilic carbonyl, nitro and hydroxymethyl groups for water adsorption. To simulate the water adsorption in ZIFs, a few groups applied Monte Carlo (MC) techniques. Nieto-Draghi et al.17 evaluated the hydrophobicity and hydrophilicity of ZIFs using the ideal adsorption heat and Henry's constant. Coudert et al.18 demonstrated how linker functionalization, geometry and topology drastically influence the water adsorption via GCMC simulation on a series of ZIFs. Jiang et al.19,20 simulated water adsorption in a series of ZIFs. Simulation results showed that ZIFs with functional groups that can form H-bonds and can be regarded as hydrophilic; whereas, the ZIFs that have functional groups with no H-bonding formed can be classified as hydrophobic. Thus, the adsorption mechanism of water is ascribed to the interactions that enhance H-bonds formation between water and the polar groups of ZIFs.
According to the experimental and computational studies mentioned above, water adsorption is sensitive to the functional groups of ZIFs. However, the role of vdW and electrostatic interactions between water and ZIFs has not been investigated to date. In this work, various ZIFs based on the SOD and RHO topology were studied systematically using a combined experimental-computational investigation to examine the impact of the functional groups of ZIFs on their water adsorption properties. We analyzed each contribution of the electrostatic and vdW interactions to the water adsorption capacity to reveal the adsorption behavior of water in ZIFs. Finally, we studied the effect of topology in the [Zn(almeIm)2] system with the same linker, 4-methylimidazole-5-carbaldehyde (almeIm).
2. Computational details
2.1 ZIF structures
In this study, we measured water adsorption in seven ZIFs. Fig. 1a and b show the structures of one cage and imidazolate linkers of the ZIFs, respectively. Specifically, among the seven ZIFs, there were two types of topologies, SOD and RHO. The SOD-type topology was connected by 4- and 6-membered rings and the RHO type was connected by 4-, 6-, and 8-membered rings. The SOD topology included ZIF-8, ZIF-90, and SIM-1. The linkers of ZIF-8 and ZIF-90, 2-methylimidazole (mIm) and imidazole-2-carboxaldehyde (Ica), were singly functionalized on position 2; while, the linker of SIM-1, 4-methylimidazole-5-carbaldehyde (almeIm), was dually functionalized at the 4 and 5 positions. The RHO topology contained MAF-6, ZIF-25, ZIF-93, and ZIF-97. The linker of MAF-6, 2-ethylimidazole (eIm), was singly functionalized on position 2; while, the linkers of ZIF-25, ZIF-93, and ZIF-97, 4,5-dimethyl-1H-imidazole (dmeIm), 4-methylimidazole-5-carbaldehyde (almeIm), and 4-hydroxymethyl-5-methylimidazole (hymIm), respectively, were dual-functionalized at the 4 and 5 positions.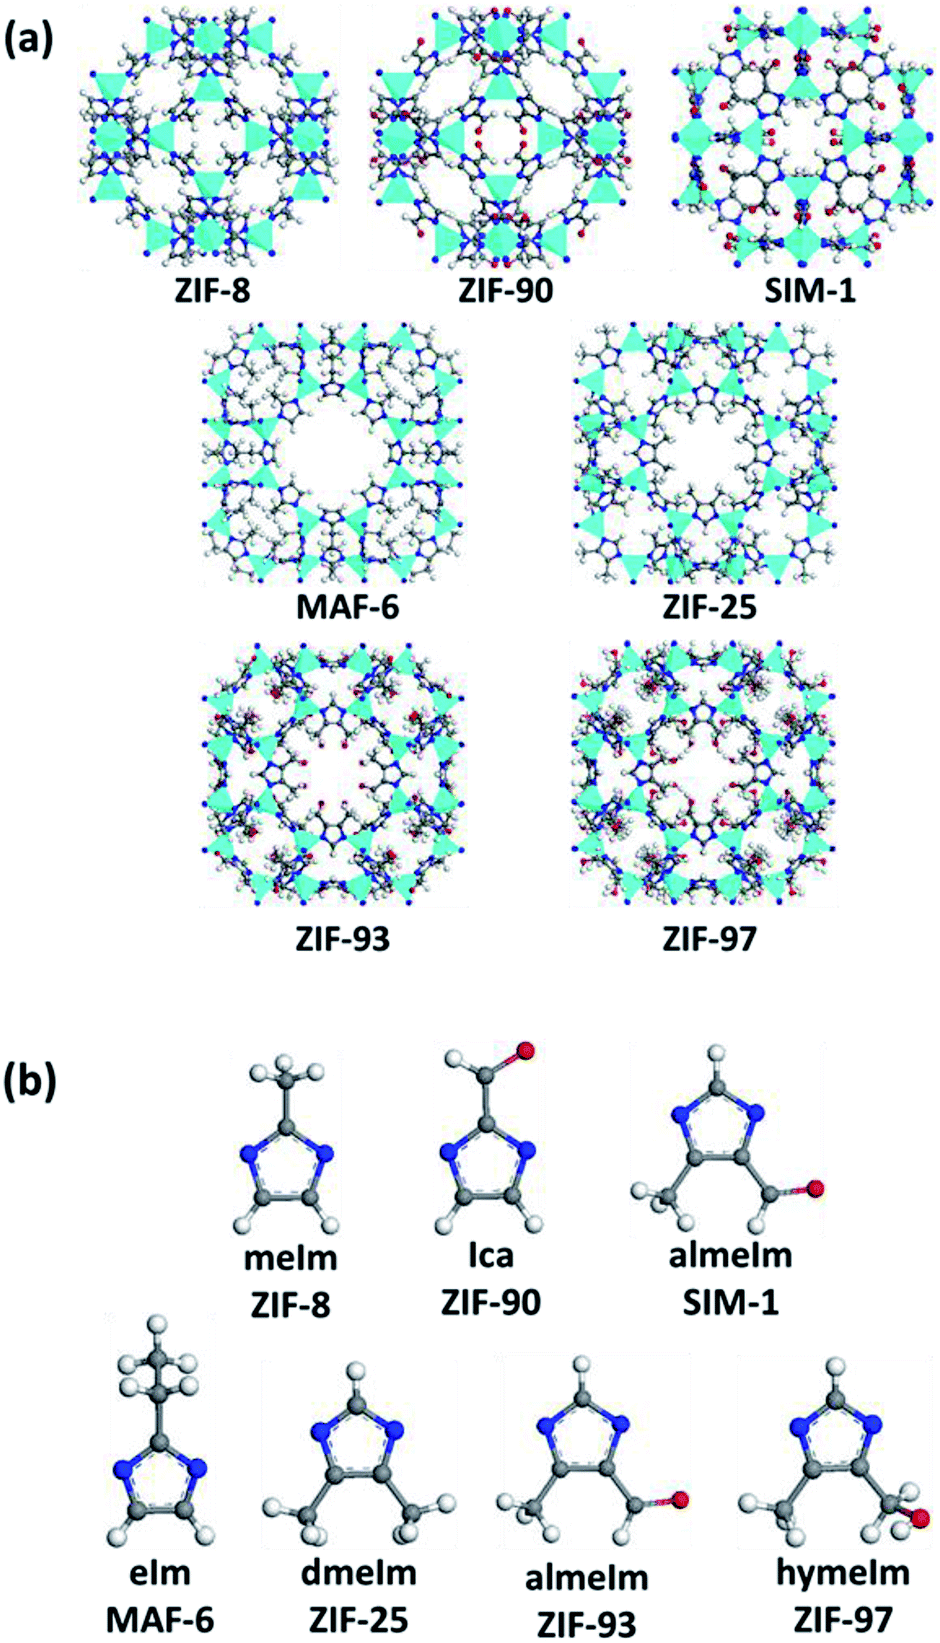 | ||
| Fig. 1 (a) Structures of one cage of ZIF-8, ZIF-90, SIM-1, MAF-6, ZIF-25, ZIF-93, and ZIF-97 and (b) imidazolate linkers of the corresponding ZIFs. Atom colors: zinc, cyan tetrahedral; C: gray; N: dark blue; O: red; and H: white. | ||
The crystal structures of all the ZIFs except for ZIF-25 were obtained from the published literature. The structure of ZIF-8,1 ZIF-90,21 ZIF-93,22 and ZIF-97 (ref. 22) was constructed by Yaghi et al., SIM-1 (ref. 23) was built by combining experimental and computational methods and MAF-6 (ref. 24) was published by Chen et al. For ZIF-25, we manually constructed its initial structure based on a single crystal of ZIF-71 (ref. 25) using Materials Studio Visualizer. Table 1 summarizes the structural parameters of the studied ZIFs. Our simulations used crystal structures that were optimized with the Forcite module in the geometry optimization algorithm.
| ZIF | ZIF-8 | ZIF-90 | SIM-1 | MAF-6 | ZIF-25 | ZIF-93 | ZIF-97 |
|---|---|---|---|---|---|---|---|
| a Computational densities of perfect crystals.b Experimental BET surface areas.c Experimental pore volume. | |||||||
| Topology | SOD | SOD | SOD | RHO | RHO | RHO | RHO |
| Linker | meIm | Ica | almeIm | eIm | dmeIm | almeIm | hymeIm |
| Space group | I![[4 with combining macron]](https://www.rsc.org/images/entities/char_0034_0304.gif) 3m 3m |
I3m |
I23 | Im![[3 with combining macron]](https://www.rsc.org/images/entities/char_0033_0304.gif) m m |
Pmm |
I432 | I432 |
| Unit cell (Å) | 16.9910 | 17.2715 | 33.4870 | 29.2582 | 28.5539 | 28.3565 | 28.4319 |
| ρa (g cm−3) | 0.924 | 0.988 | 1.204 | 0.814 | 0.875 | 0.991 | 0.997 |
| Sb (m2 g−1) | 1643 | 1150 | 602 | 1402 | 1304 | 882 | 854 |
| Vc (cm3 g−1) | 0.66 | 0.57 | 0.29 | 0.62 | 0.54 | 0.42 | 0.36 |
2.2 Force field
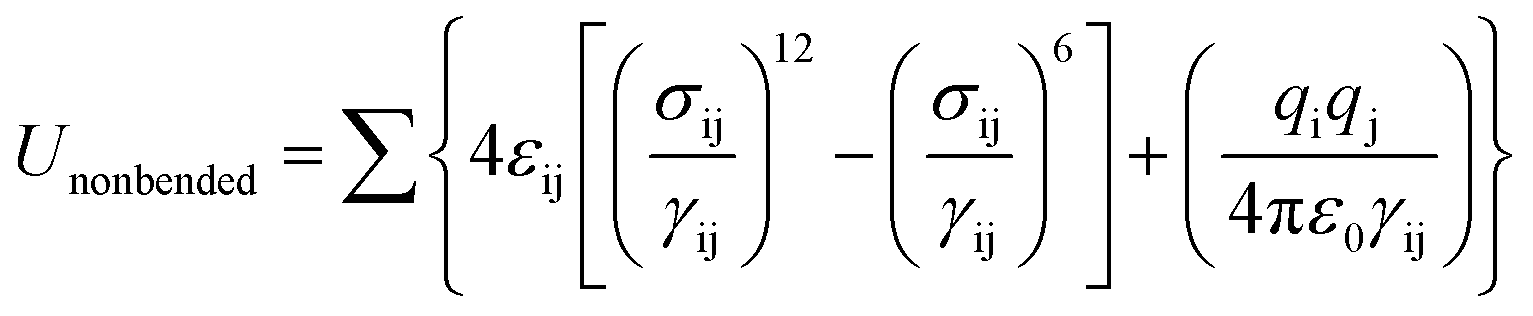
The interaction of adsorbate–adsorbent and adsorbate–adsorbate was described by a combination of Lennard-Jones (LJ) and coulombic potentials:where, σij and εij are the collision diameter and the well depth, respectively, qi refers to the charge of atom i, γij represents the distance between atoms i and j, and the permittivity of vacuum ε0 = 8.8542 × 10⁻¹² C2 N−1 m−2. The partial atomic charges in the ZIFs were calculated via the density functional theory (DFT) on fragmental clusters (see Fig. S1–S7, ESI†). The DFT calculations were performed with the Gaussian 09 software using the B3LYP functional combined with the LanL2DZ basis set for the Zn atom and the 6-31G (d) basis set for all other atoms. The partial atomic charges were estimated by fitting the electrostatic potentials (see Tables S1–S7, ESI†). The DREIDING force field was successfully used by Jiang et al.19 to describe the water adsorption in ZIFs. Therefore, we also used the DREIDING in this work. The LJ potential parameters of the ZIFs are listed in Table S8 (ESI).†
The water molecules were described as a rigid three-point transferable interaction potential (TIP3P) model.26 It has been demonstrated that the TIP3P model shows a good interaction potential when compared with experimental measurements.27 Table S9 (ESI†) lists all the TIP3P parameters of water. The LJ cross potential parameters were determined using the Lorentz–Berthelot mixing rules.
2.3 Adsorption simulations
The grand-canonical Monte Carlo (GCMC) method was applied to simulate water adsorption in the studied ZIFs. The adsorption was performed below the saturation vapor pressure of water; thus, water was treated as an ideal gas. The saturation vapor pressure of water is P0 = 3.14 kPa at 298 K in ref. 19. All adsorption processes were simulated at 298 K. It has been shown that framework flexibility has almost no influence on gas adsorption in ZIFs;28 hence, the ZIFs were regarded as rigid during simulations. The simulation box contained eight (2 × 2 × 2) unit cells for ZIF-8 and ZIF-90 and one unit cells for SIM-1, MAF-6, ZIF-25, ZIF-93, and ZIF-97. Periodic boundary conditions were employed in all three dimensions. The cutoff radius of 12.8 Å was set for the LJ interactions, and the Ewald sum method was applied to handle the long-range electrostatic interactions. All GCMC simulations included 1.0 × 10⁷ steps to reach equilibration, followed by 1.0 × 10⁷ steps to sample the desired thermodynamic properties. The GCMC simulations were conducted using the sorption code in Materials Studios 8.0.29To evaluate adsorption energy, the single-molecule MC method was performed to simulate the heat of adsorption at infinite dilution, Q0st. The heat of adsorption, Q0st, was calculated as follows:19
| Q0st = RgT − U0ad |
| U0ad = Utotal − (Uadsorbent + Uadsorbate) |
3. Experimental section
3.1 ZIF synthesis
3.2 Characterization
The ZIF samples were characterized via powder X-ray diffraction (PXRD), thermal gravimetry (TG), N2 adsorption, and scanning electron microscopy (SEM). PXRD data was obtained on an X-ray diffractometer (Rigaku, MiniFlex II) with Cu Kα radiation (λ = 1.5418 Å). TG analysis was conducted at a heating rate of 5 °C min−1 under an air atmosphere using a simultaneous thermal analyzer (Labsystems Evo, Setaram). Surface area and pore volume were assessed by measuring the N2 adsorption isotherms at 77 K on an automated volumetric adsorption apparatus (Micromeritics, ASAP2020). SEM images were obtained with a scanning electron microscope (Hitachi, SU8010).3.3 Adsorption isotherm measurement
The water vapor adsorption isotherms at 298 K were measured on an automated gravimetric sorption analyzer (Surface Measurement Systems, DVS Intrinsic). The activated samples were mounted on a balance, and the water sorption was analyzed at relative pressure P/P0 (P0 is the saturation vapor pressure) ranging from 0–0.9 (P/P0 = 0, 0.1, 0.2, 0.3, 0.4, 0.5, 0.6, 0.7, 0.8 and 0.9) until the sample reached equilibrium. Equilibrium was considered to be achieved if less than 0.002% weight change was observed in 10 min and the maximum time limit for each step was 360 min.4. Results and discussion
4.1 Material characterization
To confirm the bulk purity of all the samples, PXRD data was recorded for all the ZIFs. The experimental PXRD patterns of ZIF-8, ZIF-90 and SIM-1 were compared with the simulated powder pattern of ZIF-8, which had the same SOD topology (Fig. 2a). The experimental PXRD patterns of MAF-6, ZIF-25, ZIF-93, and ZIF-97 were compared with the simulated powder pattern of MAF-6, which had the same RHO topology (Fig. 2b). The results demonstrated that these ZIF materials were pure.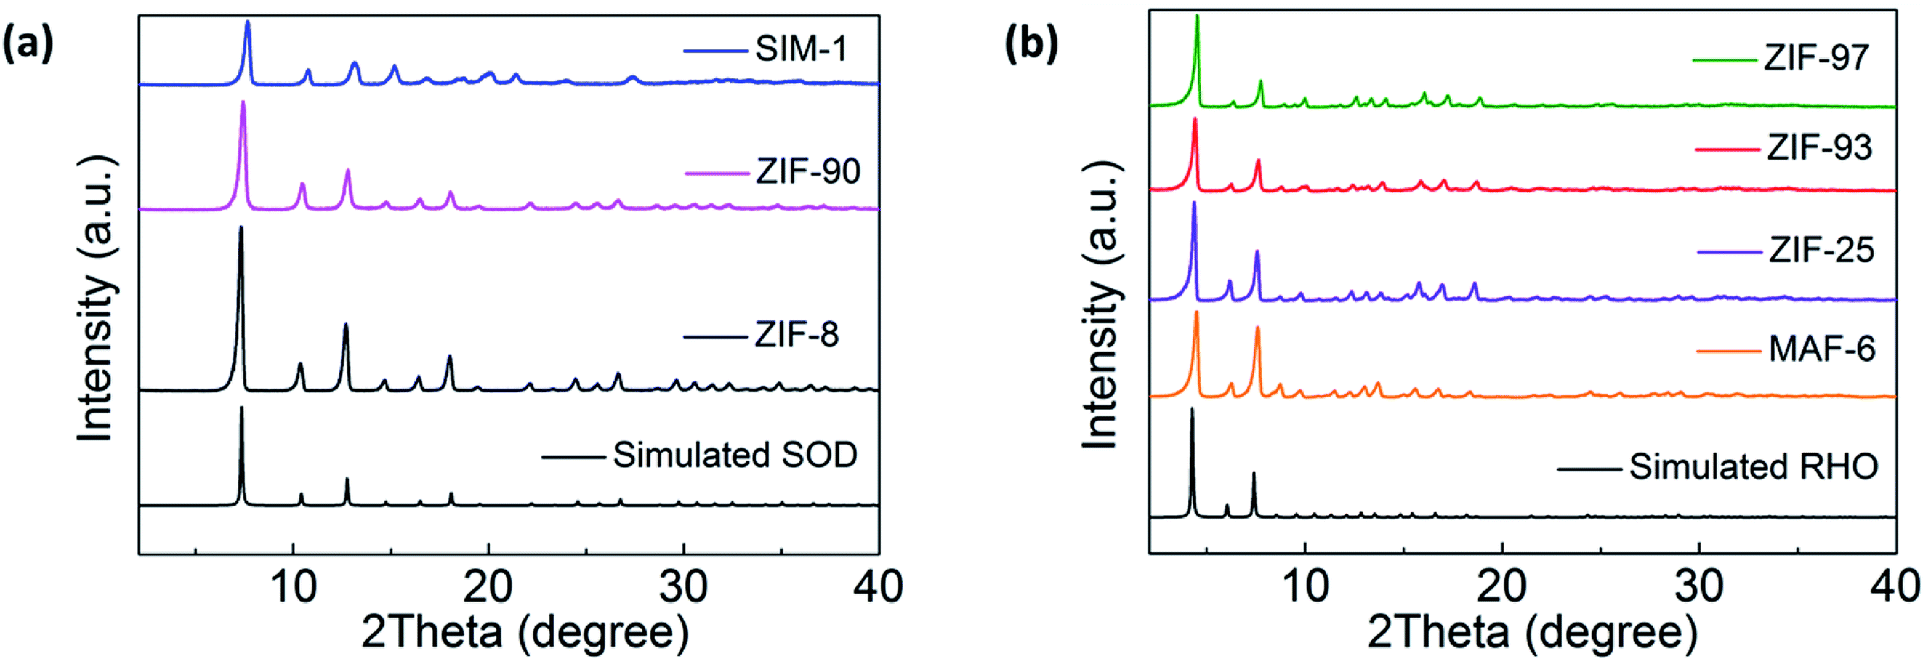 | ||
| Fig. 2 (a) PXRD patterns of ZIF-8, ZIF-90, and SIM-1 compared with the simulated SOD pattern. (b) PXRD patterns of MAF-6, ZIF-25, ZIF-93, and ZIF-97 compared with the simulated RHO pattern. | ||
In addition, TG was performed to confirm that guest molecules were removed from the pores of the ZIFs. Fig. 3a and b present the TG curves of the SOD-type ZIFs and RHO-type ZIFs, respectively. The TG curves of all the activated samples exhibited no loss in sample mass from RT to 200 °C, which meant that the guest molecules in the pores were removed. All the ZIFs were finally broken down into ZnO, and the experimental values (36.5, 33.8, 30.9, 35.3, 32.7, 30.2, and 28.2 wt% for ZIF-8, ZIF-90, SIM-1, MAF-6, ZIF-25, ZIF-93, and ZIF-97) were in good agreement with the corresponding calculated values (35.8, 31.9, 28.7, 31.8, 31.8, 28.7, and 28.3 wt%), respectively.
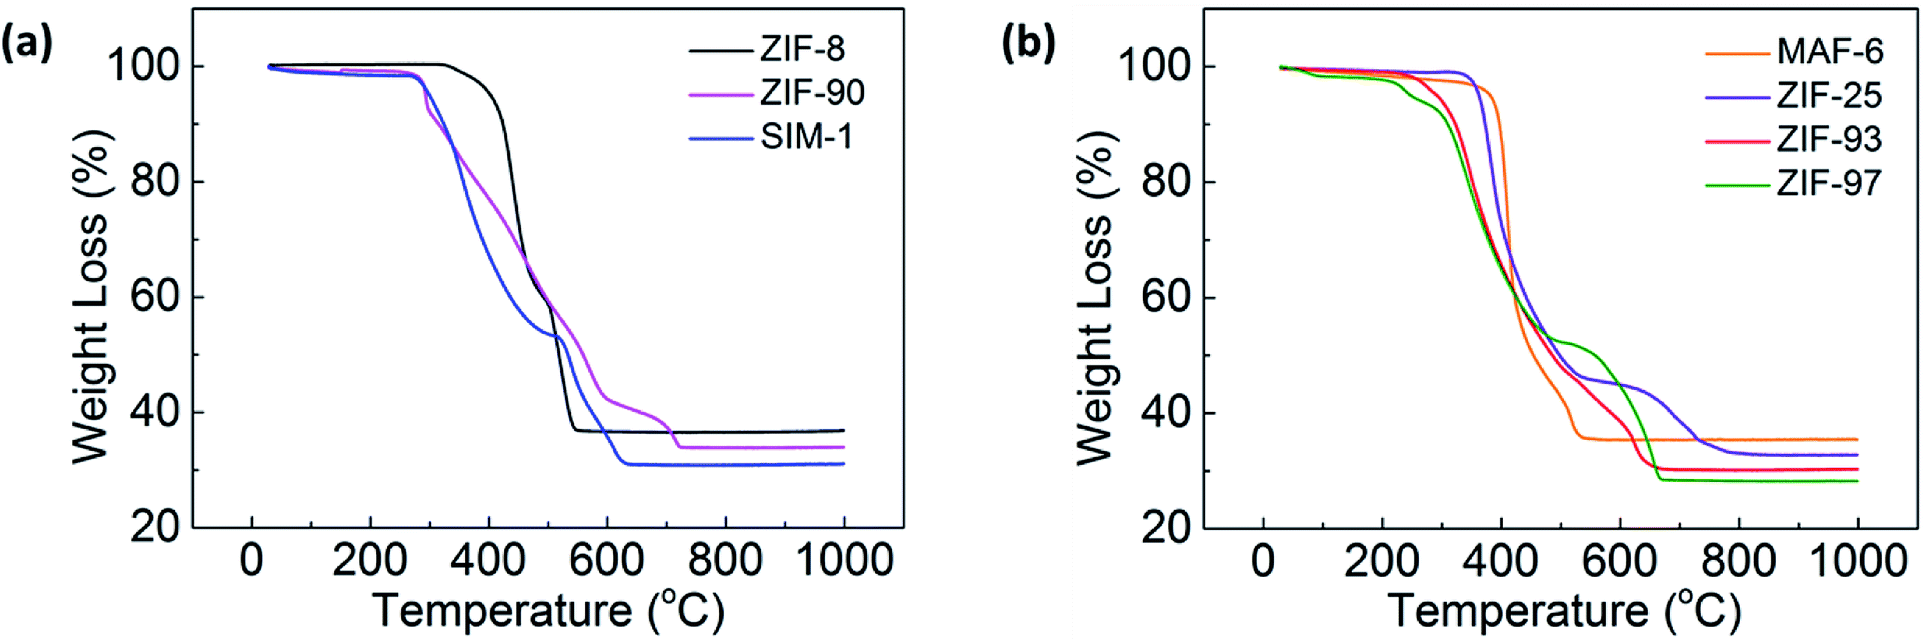 | ||
| Fig. 3 TG curves of (a) ZIF-8, ZIF-90, and SIM-1 and (b) MAF-6, ZIF-25, ZIF-93, and ZIF-97. | ||
To further characterize the ZIF materials, N2 adsorption studies were also conducted. Fig. 4a and b show the N2 adsorption/desorption isotherms of the SOD-type ZIFs and RHO-type ZIFs, respectively. The type I isotherms observed for all the ZIFs revealed their microporous properties. In addition, the N2 adsorption isotherm of ZIF-90 showed a step at about P/P0 = 0.3, which is in agreement with the results of the SEM analysis and proves the existence of mesopores between the primary nanoparticles formed a porous feature in the external surface (Fig. S8, ESI†). The BET surface areas were calculated to be 1643, 1150, 602, 1402, 1304, 882, and 854 m2 g−1 for ZIF-8, ZIF-90, SIM-1, MAF-6, ZIF-25, ZIF-93, and ZIF-97, with a pore volume of 0.66, 0.57, 0.29, 0.62, 0.54, 0.42, and 0.36 cm3 g−1, respectively.
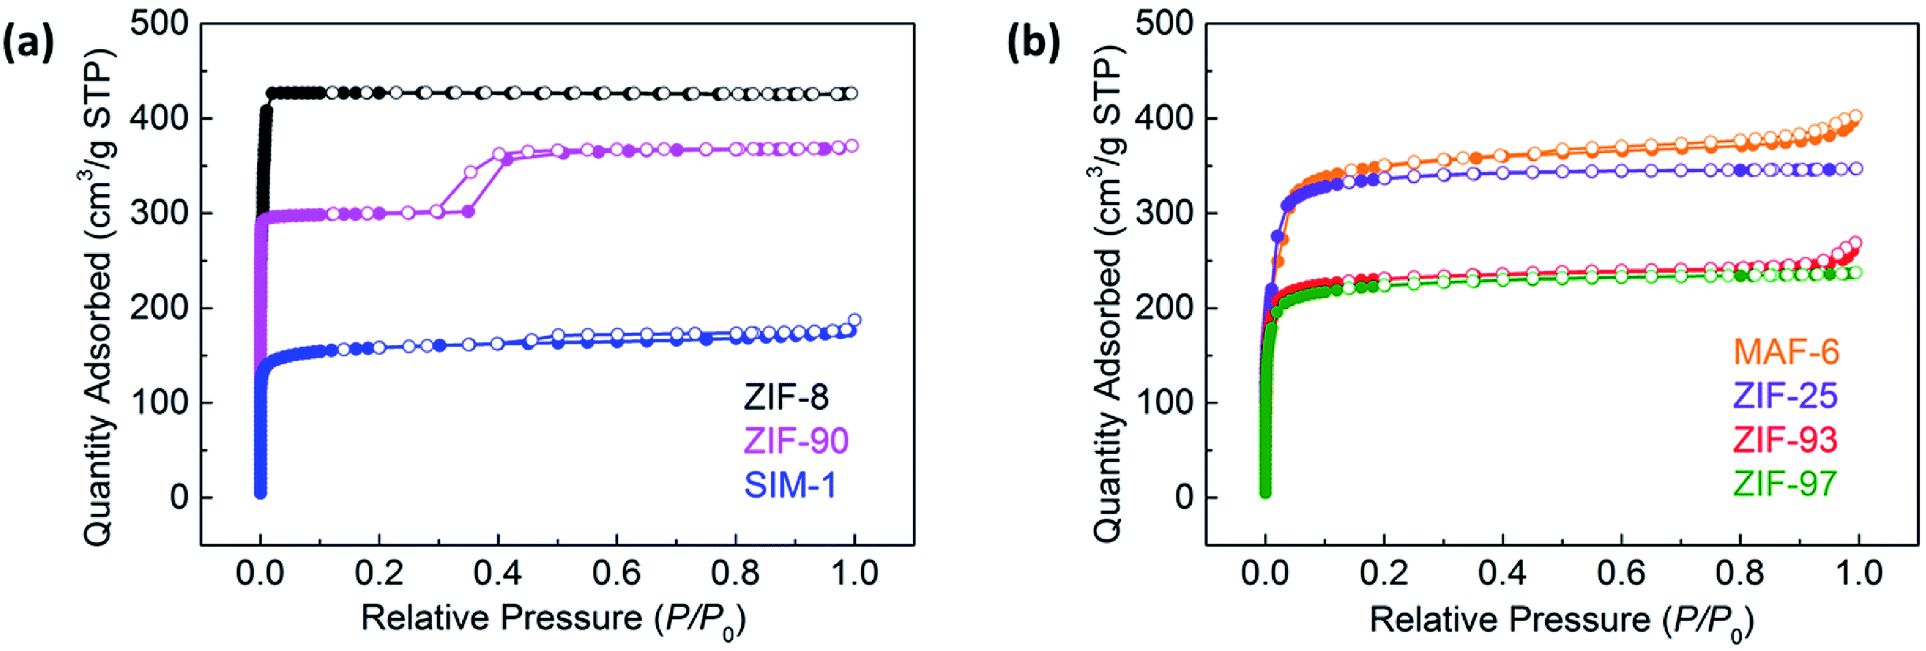 | ||
| Fig. 4 N2 adsorption/desorption isotherms at 77 K of (a) ZIF-8 (black), ZIF-90 (magenta), and SIM-1 (blue) and (b) MAF-6 (orange), ZIF-25 (purple), ZIF-93 (red), and ZIF-97 (green). The filled and empty symbols denote the adsorption and desorption isotherms, respectively. | ||
To examine the morphology of the ZIF samples, Fig. 5 shows their representative SEM images. As can be seen from the SEM images, the morphology of the ZIFs was polyhedral. The typical particle size was about 10 μm for ZIF-8, and the relatively uniform average particle sizes were approximately 20 μm, 3 μm, 500 nm, 10 μm, and 3 μm for ZIF-90, SIM-1, MAF-6, ZIF-25, and ZIF-97, respectively. For ZIF-93, its morphology was non-uniform aggregates and its typical particle size was 0.5 μm.
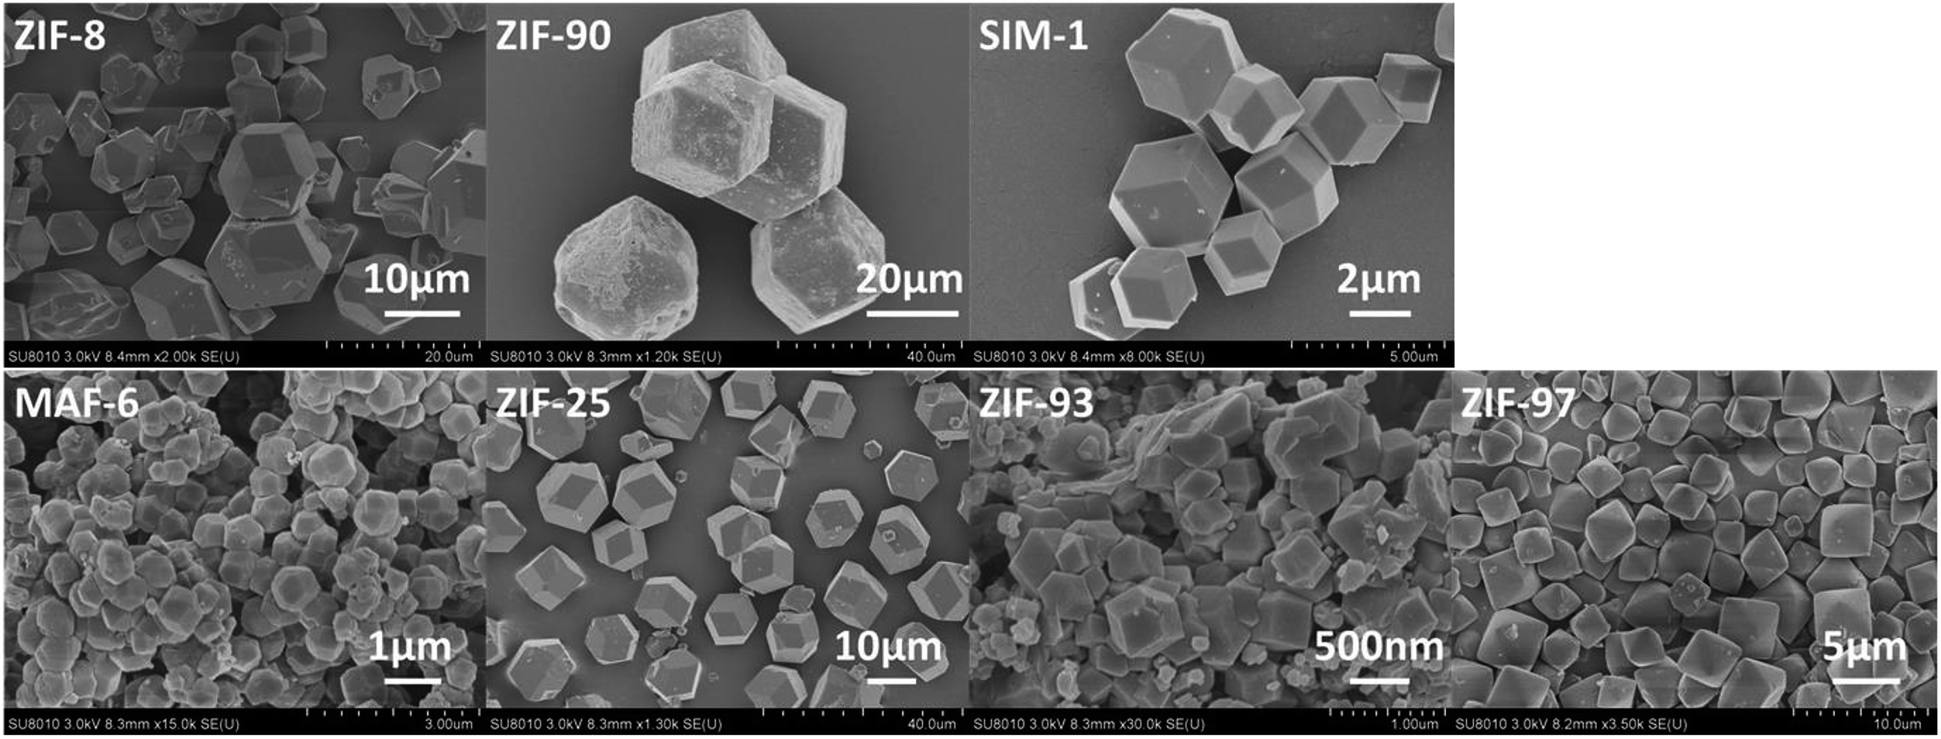 | ||
| Fig. 5 SEM images of the ZIF-8, ZIF-90, SIM-1, MAF-6, ZIF-25, ZIF-93, and ZIF-97 samples. | ||
4.2 Water vapor adsorption
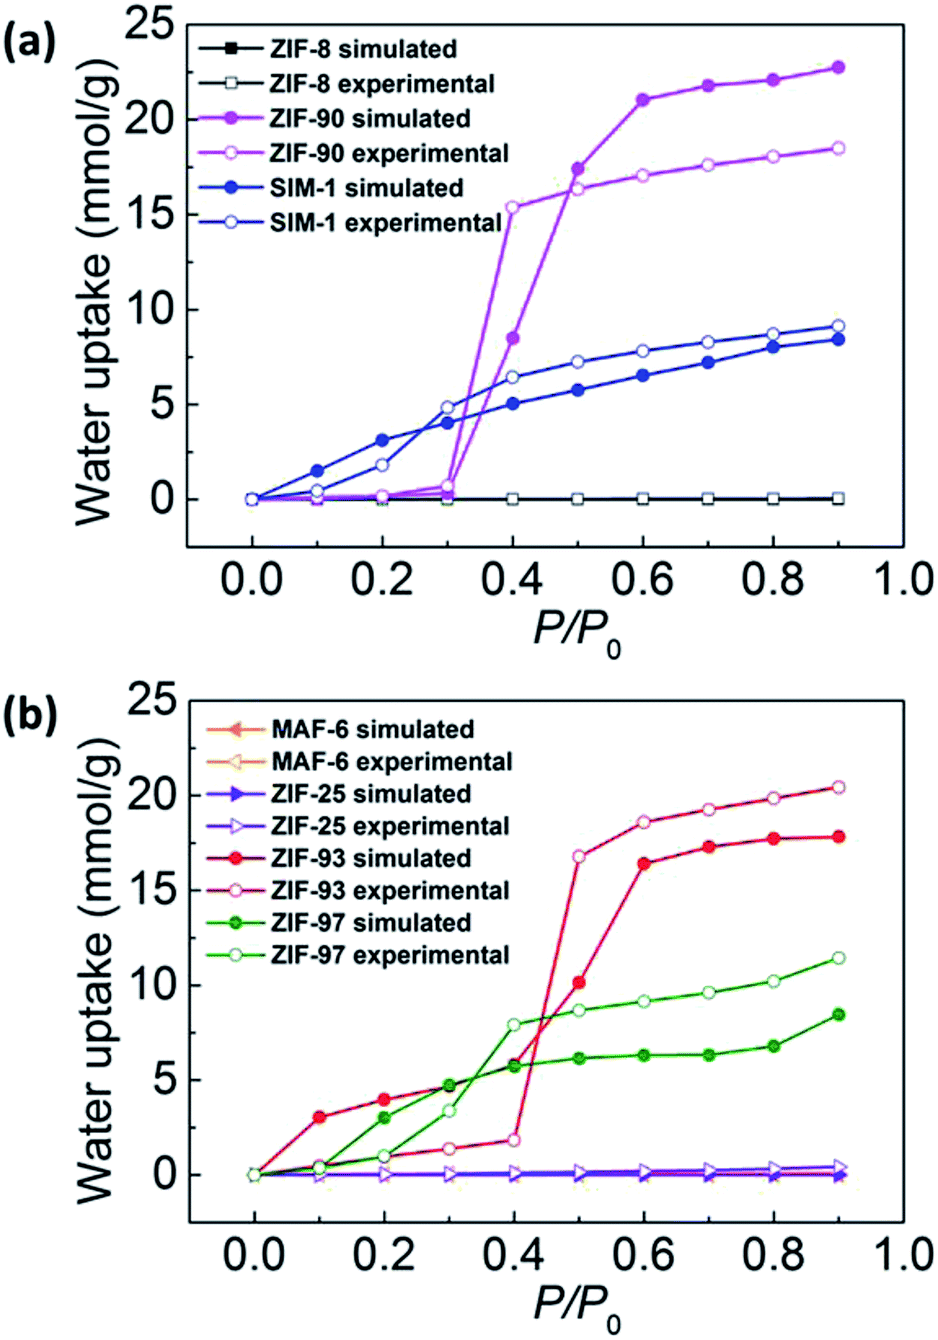 | ||
| Fig. 6 Simulated (filled symbols) and experimental (empty symbols) water adsorption isotherms at 298 K of (a) ZIF-8 (black), ZIF-90 (magenta), and SIM-1 (blue) and (b) MAF-6 (orange), ZIF-25 (purple), ZIF-93 (red), and ZIF-97 (green). | ||
Adsorption heat is one of the important indicators used to measure the adsorption capacity of adsorbents. Here, the heat of adsorption at infinite dilution, Q0st, reflected the interaction between a single water molecule and the individual ZIF. Fig. 7 shows the simulated heats of water adsorption in ZIF-8, ZIF-90, SIM-1, MAF-6, ZIF-25, ZIF-93, and ZIF-97. Among the seven ZIFs, SIM-1, ZIF-93, ZIF-97, and ZIF-90 exhibited higher Q0st (more than 30 kJ mol−1) than ZIF-8, MAF-6, and ZIF-25 due to their polar –CHO and –CH2OH groups. With polar functional groups, SIM-1, ZIF-93, ZIF-97, and ZIF-90 formed H-bonds with H2O and promoted H2O adsorption. In contrast, the non-polar groups (–CH3 and –C2H5) in ZIF-8, MAF-6, and ZIF-25 did not form H-bonds with H2O, and the H2O-ZIF interactions were very weak. In addition, the order of Q0st, ZIF-93 > ZIF-97 > ZIF-90 > ZIF-8, is consistent with the study by Nieto-Draghi et al.17 The specific values of water adsorption heat from our simulation and reported simulation are available in Table S10 (ESI†).
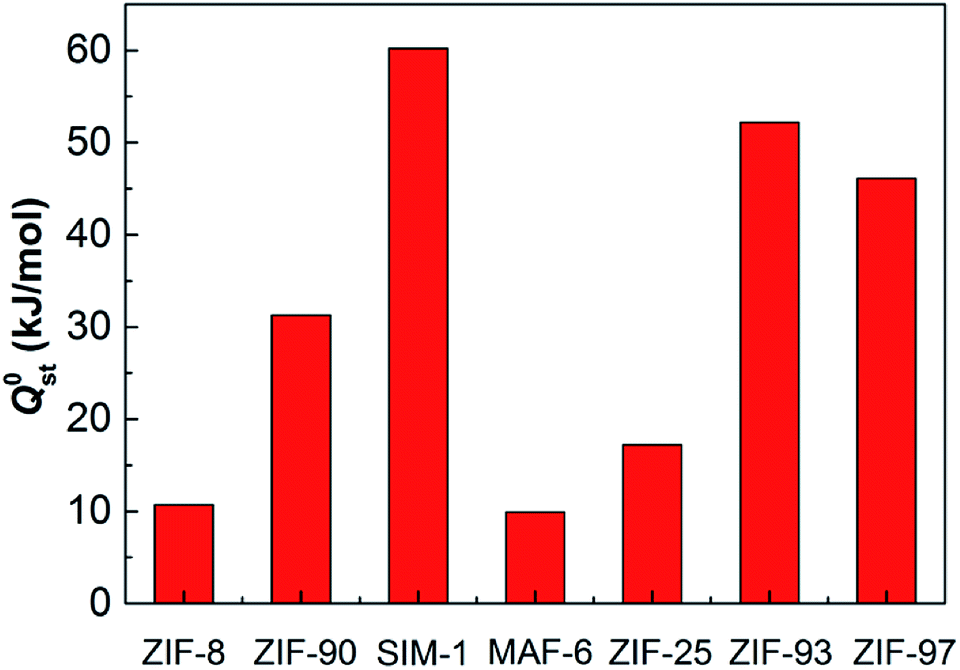 | ||
| Fig. 7 Simulated adsorption heats at infinite dilution for water adsorption in ZIF-8, ZIF-90, SIM-1, MAF-6, ZIF-25, ZIF-93, and ZIF-97. | ||
In this study, we determined the hydrophilic or hydrophobic property of the ZIFs via the combination of water uptake and the heat of adsorption, Q0st. From the discussion above, we contend that ZIF-8, MAF-6, and ZIF-25 can be treated as hydrophobic because their water uptake was negligible and Q0st was small, which was substantially lower than the heat of vaporization of water (45.85 kJ mol−1); whereas, SIM-1, ZIF-93, ZIF-97, and ZIF-90 can be regarded as hydrophilic because their water uptake was substantial and Q0st was large.
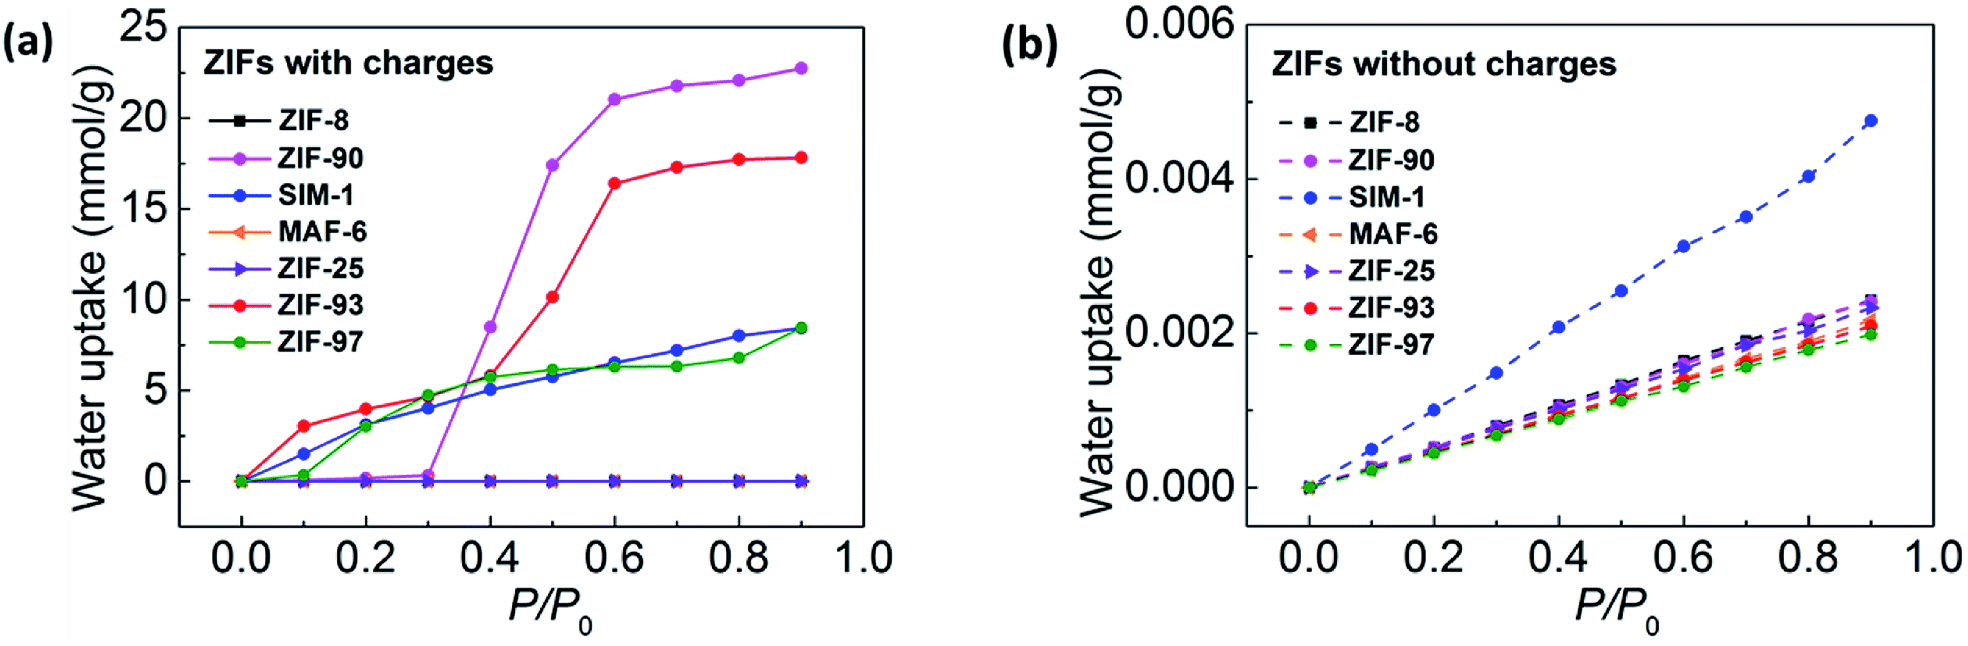 | ||
| Fig. 8 Simulated water adsorption isotherms at 298 K for each ZIF (a) with atomic charges (solid lines) and (b) without atomic charges (dashed lines). | ||
First, we analyzed the role of the vdW interactions. As can be seen in Fig. 8b, the water adsorption in the different ZIFs showed almost no difference and the water uptake NvdW was nearly zero. This demonstrates that the contribution of the vdW interaction is negligible for water adsorption in ZIFs.
Next, we illustrated the role of the electrostatic interactions. We found that the magnitude of contribution of the electrostatic interactions was related to the functional groups. As shown in Fig. 8a and b, for the hydrophobic ZIF-8, MAF-6, and ZIF-25 with non-polar groups, the water uptake was nearly zero for both Ntotal and NvdW; that is, Ntotal − NvdW was nearly zero. Whereas, for the hydrophilic SIM-1, ZIF-93, ZIF-97, and ZIF-90 with polar groups, Ntotal was large but NvdW was nearly zero, that is, Ntotal − NvdW was large. Thus, this shows that the electrostatic interactions play a dominant role in enhancing water adsorption in ZIFs. This is due to the high polarity of the water molecule. In addition, we discovered that the electrostatic interactions were strongly affected by the functional group polarity. In conclusion, the data shows that the polarity of the functional groups of the ZIF framework is the main factor determining its hydrophobicity or hydrophilicity.
Furthermore, we also simulated the CO2 adsorption in ZIF-25 and ZIF-93 (Fig. S9, ESI†). We discovered that the high CO2 adsorption is ascribed to the joint contribution of the vdW and electrostatic interaction. This phenomenon is different from water adsorption.
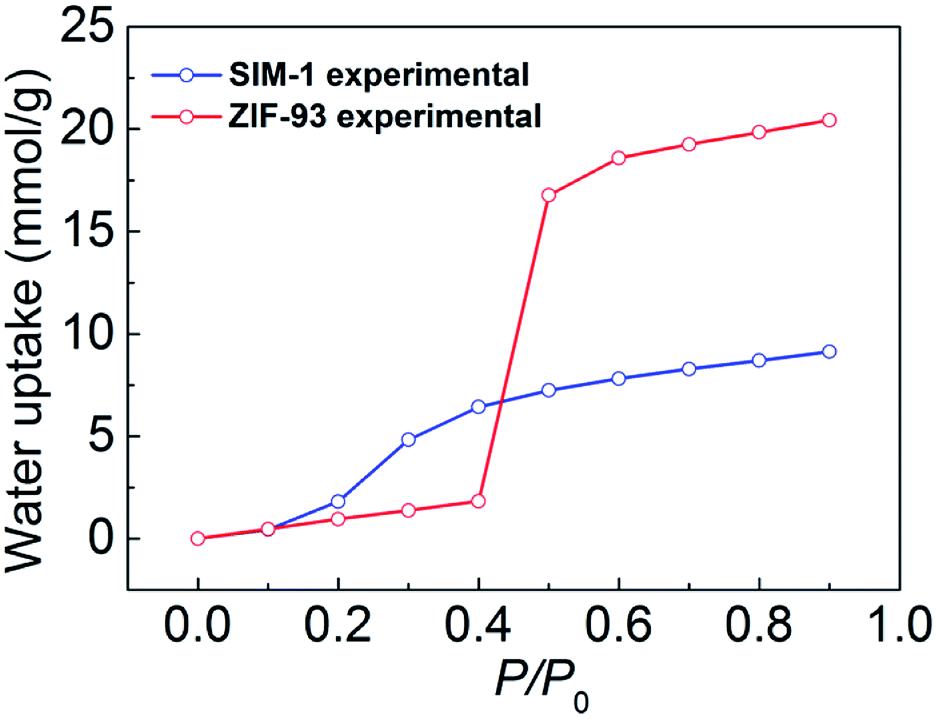 | ||
| Fig. 9 Experimental water adsorption isotherms at 298 K of SIM-1 and ZIF-93. | ||
5. Conclusions
In this study, we synthesized seven ZIFs with different topologies and imidazolate linkers and studied their water vapor adsorption via a combination of experimental measurements and computational simulations. We described the hydrophobicity or hydrophilicity of ZIFs using both their adsorption isotherms and adsorption heats. With non-polar groups, ZIF-8, MAF-6, and ZIF-25 did not form H-bonds with H2O and had weak interactions with H2O, which gave rise to a very small water uptake and Q0st, and thus, they are highly hydrophobic. With polar groups, SIM-1, ZIF-93, ZIF-97, and ZIF-90 formed H-bonds with H2O and promoted H2O adsorption, which resulted in a larger water uptake and Q0st, and thus they can be considered hydrophilic.In addition, we focused on analyzing the role of the vdW and electrostatic interactions in water adsorption of ZIFs. Our results demonstrated that the contribution of vdW interactions is negligible and the contribution of electrostatic interactions plays a dominant role. The electrostatic interactions between water and the ZIFs were strongly affected by their functional group polarity. Finally, we compared the water adsorption of SIM-1 (SOD) and ZIF-93 (RHO) to investigate the effects of topology. The experimental results showed that SIM-1 with a smaller pore size and higher density had a greater water adsorption at low relative pressures, and in contrast, ZIF-93 with a larger pore size and lower density had significantly higher adsorption at high relative pressures.
Conflicts of interest
There are no conflicts to declare.Acknowledgements
This work was financially supported by the National Natural Science Foundation of China (grant No. 21776198, 21822808 and 21436008).Notes and references
- K. S. Park, Z. Ni, A. P. Cote, J. Y. Choi, R. Huang, F. J. Uribe-Romo, H. K. Chae, M. O'Keeffe and O. M. Yaghi, Proc. Natl. Acad. Sci. U. S. A., 2006, 103, 10186–10191 CrossRef CAS PubMed.
- A. Phan, C. J. Doonan, F. J. Uriberomo, C. B. Knobler, M. O'Keeffe and O. M. Yaghi, Acc. Chem. Res., 2010, 43, 58–67 CrossRef CAS PubMed.
- B. R. Pimentel, A. Parulkar, E. K. Zhou, N. A. Brunelli and R. P. Lively, ChemSusChem, 2014, 7, 3202–3240 CrossRef CAS PubMed.
- C. Gao, Q. Shi and J. Dong, CrystEngComm, 2016, 18, 3842–3849 RSC.
- H. Jin, Y. Li, X. Liu, Y. Ban, Y. Peng, W. Jiao and W. Yang, Chem. Eng. Sci., 2015, 124, 170–178 CrossRef CAS.
- H. Jin, Y. Li and W. Yang, Ind. Eng. Chem. Res., 2018, 57, 11963–11969 CrossRef CAS.
- H. Huang, W. Zhang, D. Liu and C. Zhong, Ind. Eng. Chem. Res., 2012, 51, 10031–10038 CrossRef CAS.
- Y. Liu, J. Liu, Y. S. Lin and M. Chang, J. Phys. Chem. C, 2014, 118, 6744–6751 CrossRef CAS.
- J. Hu, Y. Liu, J. Liu and C. Gu, Fuel, 2017, 200, 244–251 CrossRef CAS.
- P. Küsgens, M. Rose, I. Senkovska, H. Fröde, A. Henschel, S. Siegle and S. Kaskel, Microporous Mesoporous Mater., 2009, 120, 325–330 CrossRef.
- R. P. Lively, M. E. Dose, J. A. Thompson, B. A. McCool, R. R. Chance and W. J. Koros, Chem. Commun., 2011, 47, 8667–8669 RSC.
- K. Zhang, R. P. Lively, M. E. Dose, A. J. Brown, C. Zhang, J. Chung, S. Nair, W. J. Koros and R. R. Chance, Chem. Commun., 2013, 49, 3245–3247 RSC.
- B. P. Biswal, T. Panda and R. Banerjee, Chem. Commun., 2012, 48, 11868–11870 RSC.
- K. Eum, K. C. Jayachandrababu, F. Rashidi, K. Zhang, J. Leisen, S. Graham, R. P. Lively, R. R. Chance, D. S. Sholl and C. W. Jones, J. Am. Chem. Soc., 2015, 137, 4191–4197 CrossRef CAS PubMed.
- K. C. Jayachandrababu, D. S. Sholl and S. Nair, J. Am. Chem. Soc., 2017, 139, 5906–5915 CrossRef CAS PubMed.
- C. T. He, L. Jiang, Z. M. Ye, R. Krishna, Z. S. Zhong, P. Q. Liao, J. Xu, G. Ouyang, J. P. Zhang and X. M. Chen, J. Am. Chem. Soc., 2015, 137, 7217–7223 CrossRef CAS PubMed.
- H. Amrouche, B. Creton, F. Siperstein and C. Nieto-Draghi, RSC Adv., 2012, 2, 6028 RSC.
- A. U. Ortiz, A. P. Freitas, A. Boutin, A. H. Fuchs and F. X. Coudert, Phys. Chem. Chem. Phys., 2014, 16, 9940–9949 RSC.
- K. Zhang, A. Nalaparaju, Y. Chen and J. Jiang, Phys. Chem. Chem. Phys., 2014, 16, 9643–9655 RSC.
- K. Zhang, K. M. Gupta, Y. Chen and J. Jiang, AIChE J., 2015, 61, 2763–2775 CrossRef CAS.
- W. Morris, C. J. Doonan, H. Furukawa, R. Banerjee and O. M. Yaghi, J. Am. Chem. Soc., 2008, 130, 12626–12627 CrossRef CAS PubMed.
- W. Morris, B. Leung, H. Furukawa, O. K. Yaghi, N. He, H. Hayashi, H. Yao, M. Asta, B. B. Laird and O. M. Yaghi, J. Am. Chem. Soc., 2010, 132, 11006–11008 CrossRef CAS PubMed.
- M. Baias, A. Lesage, S. Aguado, J. Canivet, V. Moizan-Basle, N. Audebrand, D. Farrusseng and L. Emsley, Angew. Chem., 2015, 54, 5971–5976 CrossRef CAS PubMed.
- X.-C. Huang, Y.-Y. Lin, J.-P. Zhang and X.-M. Chen, Angew. Chem., 2006, 118, 1587–1589 CrossRef.
- R. Banerjee, A. Phan, B. Wang, C. Knobler, H. Furukawa, M. O'Keeffe and O. M. Yaghi, Science, 2008, 319, 939–943 CrossRef CAS PubMed.
- W. L. Jorgensen, J. Chandrasekhar, J. D. Madura, R. W. Impey and M. L. Klein, J. Chem. Phys., 1983, 79, 926–935 CrossRef CAS.
- P. Mark and L. Nilsson, J. Phys. Chem. A, 2001, 105, 9954–9960 CrossRef CAS.
- L. Zhang, G. Wu and J. Jiang, J. Phys. Chem. C, 2014, 118, 8788–8794 CrossRef CAS.
- Dassault Systèmes BIOVIA, Materials Studio Modeling Environment, Release 2017, Dassault Systèmes BIOVIA, San Diego, CA, 2016 Search PubMed.
- S. Aguado, J. Canivet and D. Farrusseng, Chem. Commun., 2010, 46, 7999–8001 RSC.
- W. Morris, N. He, K. G. Ray, P. Klonowski, H. Furukawa, I. N. Daniels, Y. A. Houndonougbo, M. Asta, O. M. Yaghi and B. B. Laird, J. Phys. Chem. C, 2012, 116, 24084–24090 CrossRef CAS.
Footnote |
| † Electronic supplementary information (ESI) available: The molecular simulated information, simulated and experimental results, and SEM images. See DOI: 10.1039/c8ra08460b |
| This journal is © The Royal Society of Chemistry 2018 |