DOI:
10.1039/C8RA08578A
(Paper)
RSC Adv., 2018,
8, 39362-39370
Adsorption separation of CO from syngas with CuCl@AC adsorbent by a VPSA process
Received
16th October 2018
, Accepted 20th November 2018
First published on 26th November 2018
Abstract
In this work, activated carbon (AC) supported CuCl (CuCl@AC) prepared with CuCl2 as precursor is investigated for CO separation from the synthesis gas mixture. Firstly, the CuCl@AC adsorbents are investigated for their CO reversible adsorption capacity at an operation temperature of 303 K. And a vacuum pressure swing adsorption (VPSA) process of CO separation from syngas utilizing the prepared CuCl@AC adsorbent is investigated at ambient temperature and 0.79 MPa through a dynamic optimization with Aspen Adsorption software. The integrated model is closer to a realistic PSA process, making the results of the simulation and optimization more convincing. The adsorption result reveals that the obtained CuCl@AC adsorbent with the copper loading of 7 mmol g−1 AC achieves a high reversible CO adsorption capacity and adsorption selectivity. The simulation result shows that, under optimal conditions, the CO product with the purity of 98.1 vol% can be separated from the syngas with the CO concentration of 32.3 vol% utilizing the prepared CuCl@AC adsorbent, and the recovery of CO is 92.9%.
1 Introduction
Carbon monoxide is an important chemical used widely as a raw material for the production of various chemicals including methanol, ethylene glycol, formic acid, acetic acid, polyurethane foams, polycarbonate plastics, etc.1 The production of CO mainly utilizes the methods of the steam reforming of natural gas and coal gasification, producing a synthesis gas mixture containing CO, CO2, CH4, N2 and H2.2 And then the high purity CO must be separated from the gas mixture for the production of various chemicals. In addition, huge amounts of CO are released from the tail gases of some industrial oxidation processes, such as coke oven gas, blast furnace gas, carbon black manufacturing tail gas, etc.3–5 The CO from these tail gases should be separated and used from both the industrial and environmental point of views.
Recently, extensive efforts have been devoted to develop the technologies for CO separation from gas mixtures, including cryogenic distillation, liquid absorption and adsorption processes.6 Cryogenic distillation is an extremely cost- and energy-intensive process, and suitable only when the CO-containing gas stream has a relatively low concentration of N2 due to the similar boiling points.7,8 Liquid absorption processes of CO utilizing ammoniacal cuprous chloride and aromatic CuAlCl4 solution (COSORB) have the disadvantage of the instability of Cu+ ions, which always react to give Cu0 and Cu2+.9,10 Among these technologies, adsorptive separation like the pressure swing adsorption (PSA) appears to be the most promising and energy-saving alternative due to low energy costs and easy operations.11,12
For the adsorptive separation, CO adsorbents are the key to directly determine the separation performance.13 In the development of adsorption separation technologies, various porous solids including activated carbon,14,15 zeolites,16,17 and metal–organic frameworks (MOFs)18,19 display the high CO adsorption capacity. However, these adsorbents do not have significant adsorption selectivity for CO. Recently, CO separation20–27 based on the Cu(I) π-complexation adsorbents could achieve high adsorption capacity and high adsorption selectivity for CO, resulting from the stronger π-complexation interactions of CO with Cu+ ions supported on the porous solid materials. On the other hand, these types of bonds are still sufficiently weak to be broken by using simple engineering operations. Presently, the Cu(I)-based adsorbents are mainly prepared by dispersing CuCl onto the porous supports of zeolites or activated carbon (AC) using different dispersion methods. For the zeolites supported CuCl (CuCl@zeolites) adsorbents, the interactions of CO with CuCl@zeolites are relatively stronger than CuCl@AC resulting in a higher desorption temperature of ∼453 K.28 In the previous work of the first author involved in Tianjin University,29 the activated carbon (AC) supported CuCl (CuCl@AC) adsorbent was successfully prepared with CuCl2 as precursor by a solid-state dispersion method, and the activation of CuCl2 supported on AC to CuCl was realized at 543 K in N2 without any reducing gas. The prepared CuCl@AC adsorbent displayed high CO adsorption capacity and adsorption selectivity, and the adsorbed CO on CuCl@AC could be desorbed at lower temperature of 303 K under vacuum. This lower desorption temperature can greatly reduce the operation costs in CO separation processes compared with the higher desorption temperature of CuCl@zeolites. Thus, this CuCl@AC adsorbent has broad prospects for separation of CO from the synthesis gas mixture. So it is necessary to investigate the vacuum pressure swing adsorption (VPSA) process of CO separation from syngas utilizing CuCl@AC for designing a realistic PSA process.
In this work, a five-bed and 7-step VPSA process at ambient temperature of CO separation from syngas utilizing the prepared CuCl@AC adsorbent was investigated with Aspen Adsorption software. The operating conditions were optimized to obtain the high CO recovery and CO product purity. After optimization, the PSA process was analyzed, and the influence of the parameters on the process was explained.
2 Experimental
The CuCl@AC adsorbent with copper loadings of 7 mmol g−1 AC was prepared with CuCl2 as precursor by a solid-state dispersion method according to the previous work of the first author involved in Tianjin University,29 and denoted as CuCl(7.0)@AC. For an ideal adsorbent for gas separation in industrial application, it is required to be reversible for multiple adsorption and desorption cycles, and the adsorption and desorption cycle operations should be carried out at the same temperature. In the previous work,29 the effect of the operation temperature on the reversible adsorption capacity of CO on CuCl@AC was investigated, and the optimum operation temperature was determined as 303 K. So, in this work, the reversible adsorptions of CO, CO2, CH4, N2 and H2 on CuCl(7.0)@AC at operation temperature of 303 K were measured using a static volumetric method30,31 for investigating the PSA process. After adsorption of CO on CuCl(7.0)@AC, the desorption was carried out in situ by venting off the gas, vacuuming for 30 min with the mechanical vacuum pump at temperature of 303 K, and the adsorption equilibrium isotherms of CO, CO2, CH4, N2 and H2 on the desorbed adsorbents were measured again at the same temperature of 303 K, respectively.
3 Simulation of CO separation from syngas using a five-bed model
3.1 Process description
In this work, a five-bed and 7-step VPSA process at ambient temperature of CO separation from syngas utilizing the prepared CuCl@AC adsorbent was investigated with Aspen Adsorption software. Fig. 1 shows the flow diagram of this process, and the schedule is shown in Table 1. The relevant bed and adsorbent parameters used in the simulation are listed in Table 2, and the equilibrium and kinetic parameters for CO, CO2, CH4, N2 and H2 on CuCl@AC are listed in Tables 2 and 3. The overall process of each bed involves seven steps including adsorption (AD), pressure equalization for depressurization (ED), replacement (RP), blowdown (BD), vacuum (VU), pressure equalization for pressurization (EP) and feed repressurization (FR), and the total cycle time for the process is 20.0 min.32,33 Take bed 1 for example, at the beginning of a cycle, the feed gas of syngas (32.3 vol% CO, 1.0 vol% CO2, 2.4 vol% CH4, 18.3 vol% N2, 46.0 vol% H2, T = 303.15 K, p = 101.325 kPa) passed through the adsorption bed after compression. During the adsorption step (AD), most of the CO from the mixture was selectively adsorbed on the CuCl@AC adsorbent, and the waste gas left from the adsorption bed. And at the first 60 s during the adsorption step, all the waste gas was introduced into pipe of gas waste. For the next 180 s during the adsorption step, one stream of the waste gas was drawn into the adsorption bed 2 to pressurize bed 2 in preparation for the adsorption. After the adsorption step, the ED step was conducted, and the gas of the bed 1 was introduced into bed 3 which was performing the EP step. Following the ED step, the replacement step (RP) was conducted utilizing part of the CO product to increase the concentration of CO and exclude the exhaust gas. And then the blowdown (BD) and vacuum (VU) steps were conducted to regenerate the adsorbent and extract the high purity CO product. Finally, the EP and FR steps were conducted to increase the pressure of the bed for a new cycle.
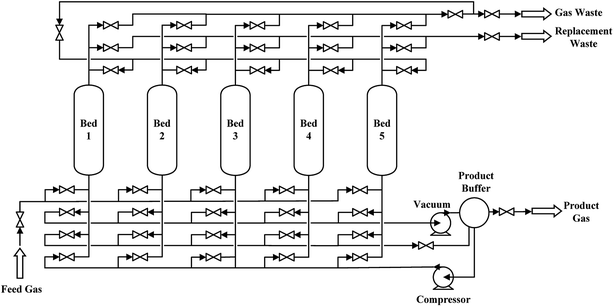 |
| | Fig. 1 Schematic flow diagram of five-bed VPSA process. | |
Table 1 Schedule of five-bed VPSA process
| |
60 s |
180 s |
60 s |
180 s |
60 s |
180 s |
60 s |
180 s |
60 s |
180 s |
| Bed 1 |
AD↑ |
AD↑ |
ED↑ |
RP↑ |
RP↑ |
BD↓ |
VU↓ |
VU↓ |
EP↓ |
FR↓ |
| Bed 2 |
EP↓ |
FR↓ |
AD↑ |
AD↑ |
ED↑ |
RP↑ |
RP↑ |
BD↓ |
VU↓ |
VU↓ |
| Bed 3 |
VU↓ |
VU↓ |
EP↓ |
FR↓ |
AD↑ |
AD↑ |
ED↑ |
RP↑ |
RP↑ |
BD↓ |
| Bed 4 |
RP↑ |
BD↓ |
VU↓ |
VU↓ |
EP↓ |
FR↓ |
AD↑ |
AD↑ |
ED↑ |
RP↑ |
| Bed 5 |
ED↑ |
RP↑ |
RP↑ |
BD↓ |
VU↓ |
VU↓ |
EP↓ |
FR↓ |
AD↑ |
AD↑ |
Table 2 Bed and adsorbent parameters used in the simulation
| Parameters |
Value |
Units |
Description |
| Hb |
1.00 |
m |
Height of bed |
| Db |
0.25 |
m |
Internal diameter of bed |
| WT |
0.01 |
m |
Wall thickness used of bed |
| εb |
0.24 |
m3 void/m3 bed |
Interparticle voidage |
| εp |
0.21 |
m3 void/m3 bed |
Intraparticle voidage |
| ρs |
473 |
kg m−3 |
Bulk solid density of adsorbent |
| Rp |
0.001 |
m |
Adsorbent particle radius |
| ψ |
0.86 |
n/a |
Adsorbent shape factor |
| MTC (“CH4”) |
0.068 |
s−1 |
Constant mass transfer coefficients |
| MTC (“CO”) |
0.17 |
s−1 |
Constant mass transfer coefficients |
| MTC (“CO2”) |
0.1 |
s−1 |
Constant mass transfer coefficients |
| MTC (“H2”) |
0.7 |
s−1 |
Constant mass transfer coefficients |
| MTC (“N2”) |
0.19 |
s−1 |
Constant mass transfer coefficients |
| Cps |
0.857 |
kJ (kg K)−1 |
Adsorbent specific heat capacity |
| Cpw |
0.502 |
kJ (kg K)−1 |
Heat capacity of wall |
| ap |
477 |
m2 g−1 |
Specific surface area of adsorbent |
| Hw |
65 |
W (m2 K)−1 |
Heat transfer coefficient between wall and gas |
| kg |
0.242 |
W (m K)−1 |
Heat conductivity of gas phase |
| ks |
0.3 |
W (m K)−1 |
Heat conductivity of solid phase |
| kw |
17 |
W (m K)−1 |
Heat conductivity of wall |
| ρw |
7800 |
kg m−3 |
Density of wall |
| Tamb |
303.15 |
K |
Ambient temperature |
Table 3 Parameters of adsorption isotherm and physical parameters of adsorbates
| Parameters |
CH4 |
CO |
CO2 |
H2 |
N2 |
| IP1/(kmol kg−1 bar−1) |
1.79 × 10⁻⁴ |
0.013 |
5.26 × 10⁻⁴ |
4.52 × 10⁻⁵ |
7.33 × 10⁻⁵ |
| IP2/bar−1 |
0.171 |
3.551 |
0.228 |
0.191 |
0.215 |
| ΔH/(kJ mol−1) |
−21.70 |
−31.40 |
−24.87 |
−11.84 |
−15.65 |
| Cpa/(kJ kmol−1 K−1) |
32.24 |
24.81 |
37.27 |
28.86 |
29.03 |
3.2 Mathematical model
The following assumptions have been made for the mathematical models of the adsorption bed:34–36 (i) the gas phase obey the ideal gas law; (ii) there are no radial variations in the temperature, pressure, and concentrations of gases in the solid and gas phase; (iii) gas flow can be described by the plug flow model; (iv) the kinetics of the adsorption are approximated by the LDF (linear driving force) model; (v) the void fractions in the bed and adsorbent were uniform.
Based on the above assumptions, the component and total mass balance with an estimated axial dispersion coefficient are established as follows:37
| |
 | (1) |
| |
 | (2) |
The LDF (linear driving force) model is defined by:38
| |
 | (3) |
The energy balance of the gas and solid phases are established in eqn (4)–(6).
| |
 | (4) |
| |
 | (5) |
| |
 | (6) |
The pressure drop along the bed is calculated by the Ergun equation:
| |
 | (7) |
Finally, the Langmuir model is used to describe the adsorption equilibrium isotherms of CO, CO2, CH4, N2 and H2 on the CuCl@AC adsorbent.
| |
 | (8) |
The PSA system is governed by the nonlinear equations listed in this section. In this work, the PDAEs were discretized in the spatial domain by a second-order central finite difference method with 50 axial nodes.39
4 Results and discussion
4.1 Adsorption isotherms of CO, CO2, CH4, N2 and H2
Fig. 2 gives the adsorption equilibrium isotherms of pure CO, CO2, CH4, N2 and H2 on the CuCl(7.0)@AC adsorbent at operation temperature of 303 K. Apparently, the adsorbent achieves a high reversible CO adsorption capacity, and can preferentially adsorb CO over CO2, CH4, N2 and H2, which is ascribed to the stronger interaction between the highly dispersed CuCl and CO via π-complexation and the weaker van der Waals and electrostatic interactions of CO2, CH4, N2 and H2 with the adsorbent. In addition, the adsorption equilibrium isotherms were fitted by the Langmuir model, respectively, and fitting parameters are listed in Table 3.
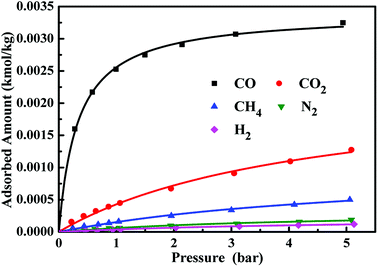 |
| | Fig. 2 Adsorption isotherms of CO, CO2, CH4, N2 and H2 on CuCl(7.0)@AC at operation temperature of 303 K. | |
4.2 Computational results
The simulation a five-bed VPSA process at ambient temperature of CO separation from syngas utilizing the prepared CuCl@AC adsorbent was conducted using Aspen Adsorption software with the adsorption isotherm parameters and the relevant adsorption bed parameters. The main objective is to analyze a medium-scale VPSA process and optimize the operating conditions. And the high CO purity of higher than 98 vol% and high CO recovery of higher than 90% are considered as the requirements of this VPSA process. The outlet flow rate of the waste gas and the replacement gas flow rate are the important parameters affecting the CO purity and CO recovery. Thus, in this work, these two parameters were optimized to achieve the required the CO purity and CO recovery. And the optimized result is listed in Table 4. Under the feed gas treatment amounts of 39.7 N m3 h−1, when the outlet flow rate of the waste gas and the replacement gas flow rate are 25.7 and 7.7 N m3 h−1, respectively, a high CO purity of 98.1 vol% with CO recovery of 92.9% is achieved, and outlet flow rate of the product gas is 12.1 N m3 h−1.
Table 4 Concentrations of components in streams and the recovery of components in the product gas at a cycle steady state of the five-bed model
| Components |
CH4 |
CO |
CO2 |
H2 |
N2 |
| Product gas |
0.2 |
98.1 |
0.3 |
0.9 |
0.5 |
| Gas waste |
3.3 |
2.8 |
1.2 |
66.5 |
26.2 |
| Replacement waste |
4.8 |
7.2 |
3.4 |
58.7 |
25.9 |
| Recovery |
2.2 |
92.9 |
9.0 |
0.6 |
0.8 |
4.2.1 Pressure change of the five adsorption beds in a cycle. Fig. 3 shows the pressure history curves of the five adsorption beds in a cycle. Take bed 1 for example to analyze the pressure change in this VPSA process. At the first 240 s, the compressed feed gas passes through the adsorption bed, and the pressure of bed 1 sharply increased to the required adsorption pressure of 0.79 MPa. After the adsorption (AD) step, the gas of the bed 1 was introduced into bed 3 to equalize pressure for 60 s, and the pressure decreased to 0.40 MPa. At the next 240 s, the replacement step (RP) was conducted utilizing CO product gas, and the pressure was kept at 0.41 MPa. And then the blowdown (BD) step was conducted for 180 s to vent the inside pressure for the next vacuum step, and the pressure decreased to 0.11 MPa. Compared to the direct vacuum step, the conducted blowdown step can reduce the energy consumption. And then the vacuum (VU) step was conducted for 240 s to regenerate the adsorbent and extract the high purity CO product, and the pressure decreased to 0.014 MPa. A low vacuum level in the regeneration step is critical for good performance of the VPSA process. Finally, the pressure equalization for pressurization (EP) and feed repressurization (FR) steps were conducted to increase the pressure of the bed for a new cycle, and the pressure increased to 0.62 MPa.
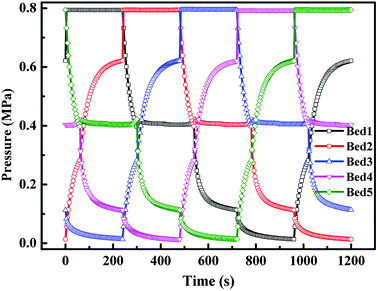 |
| | Fig. 3 Pressure history curves of five adsorption beds in a cycle. | |
4.2.2 Change of axial CO concentration on adsorption beds in a cycle. Fig. 4 shows the Change of axial CO concentration on adsorption bed 1 in a cycle. Seven measurement points are pinpointed among the adsorption bed with labeled Z/H for 0.00, 0.20, 0.40, 0.50, 0.60, 0.80 and 1.00, respectively, and Z/H = 0.00 is defined as the entrance of adsorption bed. It can be seen from Fig. 4 that, after the adsorption step, the adsorption bed at Z/H = 0.00–0.60 reached the saturation for the CO adsorption. During the ED step, some impurity gases were discharged from the adsorption bed, and the CO concentration increased slightly. During the replacement step, the CO concentration in adsorption bed increased gradually, and after the replacement step, the CO concentration in adsorption bed was higher than 98% except for the bed outlet, i.e., at the end of the replacement step, the adsorption bed at Z/H = 1.00 just going to be saturated for the CO adsorption. Thus, the adsorbents were fully utilized at the optimal condition.
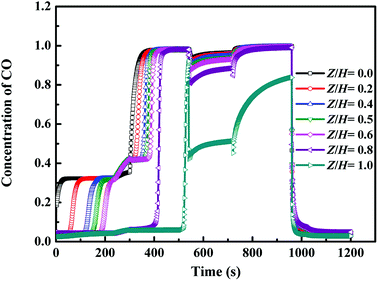 |
| | Fig. 4 Change of axial CO concentration on adsorption beds in a cycle (Z, axial distance of adsorption beds; H, height of adsorption bed). | |
4.2.3 Axial concentration distribution in gas phase at the end of each step. Fig. 5 shows the axial concentration profiles of CO, CO2, CH4, N2 and H2 after the adsorption (AD) step. In can be seen that, after the adsorption step, the adsorption bed at Z/H = 0.00–0.60 reached the saturation, and the concentration of CO, CO2, CH4, N2 and H2 did not change with the axial distance of the bed, which consistent with the concentration of each component in feed gas. And in the unsaturated adsorption bed at Z/H > 0.60, with the increase of axial distance of the bed, CO concentration decreased gradually, and the concentration of other components increased gradually. Finally, the concentrations of all components tend to be stable.
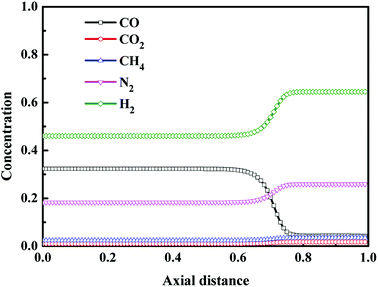 |
| | Fig. 5 Concentration profiles in gas phase after the adsorption step. | |
Fig. 6 shows the axial concentration profiles of CO, CO2, CH4, N2 and H2 after the step of pressure equalization for depressurization (ED). During the ED step, the pressure was released to the adsorption bed which needs to be pressurized, and some impurity gases were discharged from the adsorption bed. Thus, compared with the adsorption step, at the end of ED step, the CO concentration increased, and the concentration of other components decreased. In addition, from Fig. 6, after the ED step, the axial distance of saturated adsorption bed moved from Z/H = 0.6 to 0.7. Fig. 7 shows the axial concentration profiles of CO, CO2, CH4, N2 and H2 after replacement (RP) step. The replacement step, also called the product purge step, aims to exclude impurity gases from the adsorption bed and increase the concentration of CO in the adsorption bed utilizing part of the CO product. The extent of replacement can greatly affect the purity and recovery of CO. It can be seen from Fig. 7 that, except for the outlet of adsorption bed, the CO concentration in adsorption bed was higher than 98% at the end of replacement step, and the concentration of other components was close to 0. The result indicates that the replacement process is sufficient at the optimal condition.
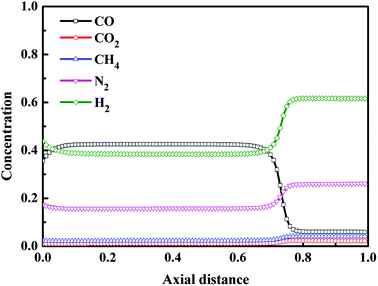 |
| | Fig. 6 Concentration profiles in gas phase after the step of pressure equalization for depressurization. | |
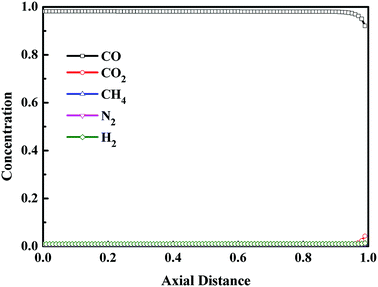 |
| | Fig. 7 Concentration profiles in gas phase after the replacement step. | |
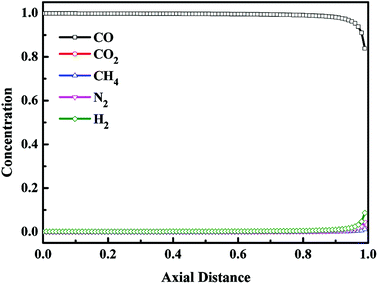
The axial concentration profiles in gas phase after the blowdown (BD) step and the vacuum (VU) step are depicted in Fig. 8 and Fig. 9, respectively. For VPSA processes, the evacuated pressure is one of the critical benefits to improve the recovery of the product. The blowdown and vacuum steps play the same role in VPSA processes. And unlike the vacuum step, the blowdown step does not consume any energy. After the blowdown step, the pressure of the adsorption bed decreased to 0.11 MPa. From the adsorption isotherms of CO, CO2, CH4, N2 and H2 on CuCl(7.0)@AC (see Fig. 1), it can be seen that, during the blowdown step, most of the light component gas adsorbed on the adsorption bed was desorbed from the adsorbents, while only a small amount of adsorbed CO was desorbed. Thus, compared with replacement step, after the blowdown step, the concentration of light components increased, and the CO concentration decreased. In addition, it can be seen from Fig. 8 that the impurity gases were mainly concentrated on the top of the adsorption bed. During the vacuum step, the pressure of the adsorption bed further decreased to 0.014 MPa, and the adsorbed CO was almost completely desorbed from the adsorption bed and introduced to the product gas system. And it can be seen from Fig. 9 that, except for the outlet of adsorption bed, the CO concentration in adsorption bed was higher than 99% at the end of vacuum step, and the concentration of other components was close to 0.
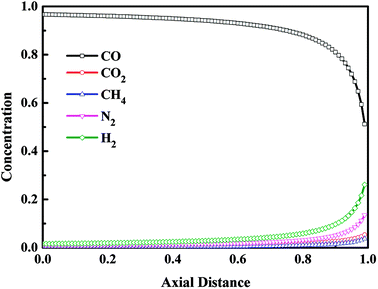 |
| | Fig. 8 Concentration profiles in gas phase after the blowdown step. | |
 |
| | Fig. 9 Concentration profiles in gas phase after the vacuum step. | |
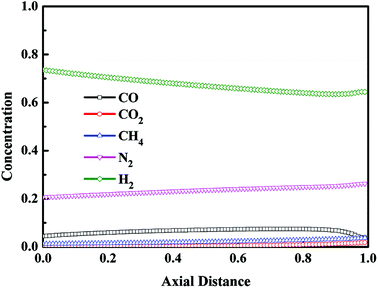
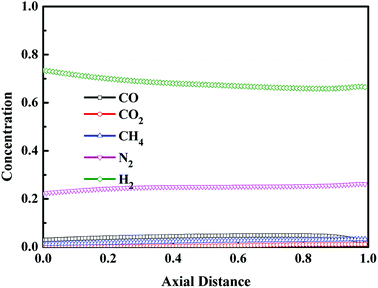
Fig. 10 and 11 display the axial concentration distributions in gas phase after the step of pressure equalization for pressurization (EP) and the step of the feed repressurization (FR), respectively. These two steps were conducted to increase the pressure of the bed for a new cycle utilizing the pressurized gas from the beds performing the step of pressure equalization for depressurization and the step of adsorption, respectively, in which the CO concentration was at a low level, and the concentration of other components was high. Thus, at the optimal condition, the CO concentration of the bed was maintained at a low level after these two steps.
 |
| | Fig. 10 Concentration profiles in gas phase after the step of pressure equalization for pressurization. | |
 |
| | Fig. 11 Concentration profiles in gas phase after the feed repressurization step. | |
5 Conclusions
In this work, the activated carbon (AC) supported CuCl (CuCl@AC) is investigated for CO separation from the synthesis gas mixture. This CuCl/AC adsorbent achieves a high reversible CO adsorption capacity at lower operation temperature of 303 K. A simulation and optimization of five-bed VPSA for the CO separation from syngas on CuCl@AC has been described and discussed. The operation step of adsorbent beds in this process is governed by valves and dynamic boundaries that are close to realistic conditions. The operating conditions have been optimized for maximizing the CO recovery and CO product purity by adjusting the outlet flow rate of the waste gas and the replacement gas flow rate. The optimization result indicate that the performance of the VPSA process can be improved under the operating restrictions, and a significantly high recovery (92.9%) and purity (98.1 vol%) of CO can be achieved from the syngas with a low CO concentration (32.3 vol%). This VPSA process is operated at ambient temperature, which can great reduce the operation costs in CO separation processes. In addition, the systematic analysis of this VPSA process can provide significant insight for designing a realistic PSA process.
Conflicts of interest
There are no conflicts to declare.
Nomenclature
| ci | Gas phase concentration of component i (mol m−3) |
| Cvg | Heat capacity of the gas at constant volume (kJ kmol−1 K−1) |
| Cps | Adsorbent specific heat capacity (kJ kg−1 K−1) |
| Cpa | Heat capacity of the gas at constant pressure (kJ kmol−1 K−1) |
| Dax | Axial dispersion coefficient (m2 s−1) |
| Dm | Molecular diffusivity coefficient (m2 s−1) |
| Db | Internal diameter of bed (m) |
| Hw | Heat transfer coefficient between wall and gas (W m−2 K−1) |
| Hb | Height of bed (m) |
| IP1 | Adsorption equilibrium constant (bar−1) |
| IP2 | Adsorption equilibrium constant (kmol kg−1 bar−1) |
| MTCi | Constant mass transfer coefficients (s−1) |
| M | Molecular weight (kg mol−1) |
| kg | Heat conductivity of gas phase (W m−1 K−1) |
| ks | Heat conductivity of solid phase (W m−1 K−1) |
| kw | Heat conductivity of wall (W m−1 K−1) |
| pi | Pressure (bar) |
| R | Gas constant (J mol−1 K−1) |
| Rp | Adsorbent particle radius (m) |
| Tamb | Ambient temperature (K) |
| Tg | Temperature of gas phase (K) |
| Ts | Temperature of solid phase (K) |
| T0 | Temperature of wall (K) |
| vg | Gas velocity (m s−1) |
| WT | Wall thickness (m) |
| yi | Mole fraction of component i |
| εb | Bed void fraction |
| εp | Particle void fraction |
| ρs | Particle density (kg m−3) |
| ψ | Shape factor |
| μ | Gas viscosity (kg m−1 s−1) |
| ΔH | Isosteric heat of adsorption of component (kJ mol−1) |
Acknowledgements
This work has been supported by Natural Science Foundation of Shandong Province (No. ZR2018BB071) and a Project of Shandong Province Higher Educational Science and Technology Program (No. J17KA107).
Notes and references
- D. Saha and S. Deng, Adsorption equilibria and kinetics of carbon monoxide on zeolite 5A, 13X, MOF-5, and MOF-177, J. Chem. Eng. Data, 2009, 54, 2245–2250 CrossRef CAS.
- N. Heymans, B. Alban, S. Moreau and G. De Weireld, Experimental and theoretical study of the adsorption of pure molecules and binary systems containing methane, carbon monoxide, carbon dioxide and nitrogen. Application to the syngas generation, Chem. Eng. Sci., 2011, 66, 3850–3858 CrossRef CAS.
- T. Harlacher, T. Melin and M. Wessling, Techno-economic analysis of membrane-based argon recovery in a silicon carbide process, Ind. Eng. Chem. Res., 2013, 52, 10460–10466 CrossRef CAS.
- T. Harlacher, M. Scholz, T. Melin and M. Wessling, Optimizing argon recovery: membrane separation of carbon monoxide at high concentrations via the water gas shift, Ind. Eng. Chem. Res., 2012, 51, 12463–12470 CrossRef CAS.
- G. Zarca, I. Ortiz and A. Urtiaga, Kinetics of the carbon monoxide reactive uptake by an imidazolium chlorocuprate(I) ionic liquid, Chem. Eng. J., 2014, 252, 298–304 CrossRef CAS.
- G. Zarca, I. Ortiz and A. Urtiaga, Copper(I)-containing supported ionic liquid membranes for carbon monoxide/nitrogen separation, J. Membr. Sci., 2013, 438, 38–45 CrossRef CAS.
- G. S. Patil, S. Baruah and N. N. Dutta, Facilitated transport of carbon monoxide: a review, Gas Sep. Purif., 1991, 5, 2–8 CrossRef CAS.
- F. Kasuya and T. Tsuji, High purity CO gas separation by pressure swing adsorption, Gas Sep. Purif., 1991, 5, 242–246 CrossRef CAS.
- D. J. Safarik and R. B. Eldridge, Olefin/paraffin separations by reactive absorption: a review, Ind. Eng. Chem. Res., 1998, 37, 2571–2581 CrossRef CAS.
- J. A. Hogendoorn, W. P. M. van Swaaij and G. F. Versteeg, The absorption of carbon monoxide in COSORB solutions: absorption rate and capacity, Chem. Eng. J., 1995, 59, 243–252 CAS.
- R. T. Yang, Adsorbents: Fundamentals and Applications, Wiley, New York, 2003 Search PubMed.
- N. N. Dutta and G. S. Patil, Developments in CO separation, Gas Sep. Purif., 1995, 9, 277–283 CrossRef CAS.
- L. Wang, J. Zhao, L. Wang, T. Yan, Y.-Y. Sun and S. B. Zhang, Titanium-decorated graphene oxide for carbon monoxide capture and separation, Phys. Chem. Chem. Phys., 2011, 13, 21126–21131 RSC.
- J. A. Delgado, V. I. Águeda, M. A. Uguina, J. L. Sotelo, P. Brea and C. A. Grande, Adsorption and diffusion of H2, CO, CH4, and CO2 in BPL activated carbon and 13X zeolite: evaluation of performance in pressure swing adsorption hydrogen purification by simulation, Ind. Eng. Chem. Res., 2014, 53, 15414–15426 CrossRef CAS.
- F. V. S. Lopes, C. A. Grande, A. M. Ribeiro, J. M. Loureiro, O. Evaggelos, V. Nikolakis and A. E. Rodrigues, Adsorption of H2, CO2, CH4, CO, N2 and H2O in activated carbon and zeolite for hydrogen production, Sep. Sci. Technol., 2009, 44, 1045–1073 CrossRef CAS.
- H. Tsutaya and J. Lzumi, Carbon monoxide adsorption by zeolite, Zeolites, 1991, 11, 90 CrossRef.
- G. Sethia, R. S. Somani and H. Chand Bajaj, Adsorption of carbon monoxide, methane and nitrogen on alkaline earth metal ion exchanged zeolite-X: structure, cation position and adsorption relationship, RSC Adv., 2015, 5, 12773–12781 RSC.
- V. I. Agueda, J. A. Delgado, M. A. Uguina, P. Brea, A. I. Spjelkavik, R. Blom and C. Grande, Adsorption and diffusion of H2, N2, CO, CH4 and CO2 in UTSA-16 metal-organic framework extrudates, Chem. Eng. Sci., 2015, 124, 159–169 CrossRef CAS.
- K. Munusamy, G. Sethia, D. V. Patil, P. B. Somayajulu Rallapalli, R. S. Somani and H. C. Bajaj, Sorption of carbon dioxide, methane, nitrogen and carbon monoxide on MIL-101(Cr): volumetric measurements and dynamic adsorption studies, Chem. Eng. J., 2012, 195–196, 359–368 CrossRef CAS.
- C. J. King, in Handbook of Separation Process Technology, ed. R. W. Rousseau, Wiley, New York, 1987 Search PubMed.
- T. C. Golden, W. C. Kratz, F. C. Wilhelm, R. Pierantozzi and A. Rokicki, Highly dispersed cuprous compositions, US Pat., 5.175.137, 1992.
- H. Hirai, K. Wada and M. Komiyama, Active carbon-supported copper(I) chloride as solid adsorbent for carbon monoxide, Bull. Chem. Soc. Jpn., 1986, 59, 2217–2223 CrossRef CAS.
- H. Hirai, K. Wada, K. Kurima and M. Komiyama, Carbon monoxide adsorbent composed of copper(I) chloride and polystyrene resin having amino groups, Bull. Chem. Soc. Jpn., 1986, 59, 2553–2558 CrossRef CAS.
- H. Tamon, K. Kitamura and M. Okazaki, Adsorption of carbon monoxide on activated carbon impregnated with metal halide, AIChE J., 1996, 42, 422–430 CrossRef CAS.
- Y. Xie, J. Zhang, J. Qiu, X. Tong, J. Fu, G. Yang, H. Yan and Y. Tang, Zeolites modified by CuCl for separating CO from gas mixtures containing CO2, Adsorption, 1997, 3, 27–32 CrossRef CAS.
- J. Ma, L. Li, J. Ren and R. Li, CO adsorption on activated carbon-supported Cu-based adsorbent prepared by a facile route, Sep. Purif. Technol., 2010, 76, 89–93 CrossRef CAS.
- J. Peng, S. Xian, J. Xiao, Y. Huang, Q. Xia, H. Wang and Z. Li, A supported Cu(I)@MIL-100(Fe) adsorbent with high CO adsorption capacity and CO/N2 selectivity, Chem. Eng. J., 2015, 270, 282–289 CrossRef CAS.
- F. Gao, Y. Wang and S. Wang, Selective adsorption of CO on CuCl/Y adsorbent prepared using CuCl2 as precursor: equilibrium and thermodynamics, Chem. Eng. J., 2016, 290, 418–427 CrossRef CAS.
- F. Gao, Y. Wang, X. Wang and S. Wang, Selective CO adsorbent CuCl/AC prepared using CuCl2 as a precursor by a facile method, RSC Adv., 2016, 6, 34439–34446 RSC.
- Z. Huang, L. Xu, J. Li, G. Guo and Y. Wang, Adsorption equilibrium of carbon dioxide and methane on β-zeolite at pressures of up to 2000 kPa using a static volumetric method, J. Chem. Eng. Data, 2010, 55, 2123–2127 CrossRef CAS.
- M. Delavar, A. A. Ghoreyshi, M. Jahanshahi, S. Khalili and N. Nabian, Equilibria and kinetics of natural gas adsorption on multi-walled carbon nanotube material, RSC Adv., 2012, 2, 4490–4497 RSC.
- S. P. Reynolds, A. Mehrotra, A. D. Ebner and J. A. Ritter, Heavy reflux PSA cycles for CO2 recovery from flue gas: Part I. Performance evaluation, Adsorption, 2008, 14, 399–413 CrossRef CAS.
- Z. Liu, C. A. Grande, P. Li, J. Yu and A. E. Rodrigues, Multi-bed vacuum pressure swing adsorption for carbon dioxide capture from flue gas, Sep. Purif. Technol., 2011, 81, 307–317 CrossRef CAS.
- C. T. Chou and W. C. Huang, Simulation of a four bed pressure swing adsorption process for oxygen enrichment, Ind. Eng. Chem. Res., 1994, 33, 1250–1258 CrossRef CAS.
- C. Z. Shen, Z. Liu, P. Li and J. Yu, Two-stage VPSA process for CO2 capture from flue gas using activated carbon beads, Ind. Eng. Chem. Res., 2012, 51, 5011–5021 CrossRef CAS.
- H. Yang, C. Yin, B. Jiang and D. Zhang, Optimization and analysis of a VPSA process for N2/CH4 separation, Sep. Purif. Technol., 2015, 134, 232–240 CrossRef.
- R. T. Yang, Gas Separation by Adsorption Process, Butterworths, Boston, 1987, pp. 50–101 Search PubMed.
- A. Olajossy, A. Gawdzik, Z. Budner and J. Dula, Methane separation from coal mine methane gas by vacuum pressure swing adsorption, Chem. Eng. Res. Des., 2003, 81, 474–482 CrossRef CAS.
- R. Haghpanah, A. Majumder, R. Nilam, A. Rajendran, S. Farooq, I. A. Karimi and M. Amanullah, Multiobjective optimization of a four-step adsorption process for postcombustion CO2 capture via finite volume simulation, Ind. Eng. Chem. Res., 2013, 52, 4249–4265 CrossRef CAS.
|
| This journal is © The Royal Society of Chemistry 2018 |
Click here to see how this site uses Cookies. View our privacy policy here.  Open Access Article
 *a
*a


