 Open Access Article
Evaluation of exfoliation degree of montmorillonite in aqueous dispersions through turbidity measurement
Tianxing Chenab,
Yiming Yangab,
Yunliang Zhao*ab,
Feng Raod and
Shaoxian Song *abc
*abc
aHubei Key Laboratory of Mineral Resources Processing and Environment, Wuhan University of Technology, Luoshi Road 122, Wuhan, Hubei 430070, China. E-mail: zyl286@whut.edu.cn; ssx851215@whut.edu.cn
bSchool of Resources and Environmental Engineering, Wuhan University of Technology, Luoshi Road 122, Wuhan, Hubei 430070, China
cHubei Provincial Collaborative Innovation Center for High Efficient Utilization of Vanadium Resources, Wuhan University of Technology, Luoshi Road 122, Wuhan, Hubei 430070, China
dInstituto de Investigación en Metalurgia y Materiales, Universidad Michoacana de San Nicolás de Hidalgo, Ciudad Universitaria, Morelia, Michoacán 58030, Mexico
First published on 5th December 2018
Abstract
In this work, the exfoliation of montmorillonite (MMT) in aqueous suspensions was investigated through the measurement of turbidity. The experimental results have shown that the turbidity is closely correlated to the exfoliation degree of MMT in aqueous suspensions. Below the solid concentration of 2% w/v and in the range of pH 4–10, the turbidity of aqueous dispersions of MMT without exfoliation appeared constant, while it decreased on increasing the exfoliation degree of MMT. The ratio of the turbidities before and after the exfoliation (τ0/τ) was directly proportional to the number of fresh MMT flakes formed from the exfoliation. τ0/τ was termed the exfoliation degree E. The larger the value of E, the more MMT flakes formed. It has been found that the exfoliation of MMT in aqueous dispersions was depressed due to the presence of electrolytic ions. This depression increased with the increase of ion concentration and valence.
1. Introduction
The preparation and application of mono- to few-layer layered materials have attracted great attention during the past decade.1–5 Layered materials can be considered as a class of solids with strong in-plane chemical bonds but weak out-of-plane, van der Waals bonds. Such materials can be sheared parallel to produce nanometer-thin platelets. MMT is a major constituent of bentonite that has a 2![[thin space (1/6-em)]](https://www.rsc.org/images/entities/char_2009.gif) :
:![[thin space (1/6-em)]](https://www.rsc.org/images/entities/char_2009.gif) 1 aluminosilicate layered structure with negative charges on its surfaces.6 Interchangeable counterions are attracted to the inter-layer space to balance the excess of negative surface charge. The structure of MMT will expand in the in-plane direction when water or other molecules are attracted by the exchangeable cations in the layers. There are a number of methods used for the exfoliation of MMT that involve intercalation, ion exchange, or ultrasonic waves.7–9
1 aluminosilicate layered structure with negative charges on its surfaces.6 Interchangeable counterions are attracted to the inter-layer space to balance the excess of negative surface charge. The structure of MMT will expand in the in-plane direction when water or other molecules are attracted by the exchangeable cations in the layers. There are a number of methods used for the exfoliation of MMT that involve intercalation, ion exchange, or ultrasonic waves.7–9
The exfoliation behavior of MMT in aqueous medium has attracted great interest in recent years. Exfoliation is defined as the decomposition of large aggregates into smaller particles, which is different from delamination. Intercalated water molecules lead to increasing separation between two successive layers of MMT in aqueous media. As long as there is a significant interaction between the two successive layers with some crystallographic orientation maintained, this separation is called delamination. When at some point (strong stirring or ultrasonication), no further interaction occurs between the two delaminated units which become independently mobile in aqueous media, this phenomenon is called exfoliation.10 The exfoliation of MMT will produce a large amount of slimes and have detrimental effects on slurry rheology, flotation and comminution.11–14 In addition, the direct effect of exfoliation of MMT is to increase the specific surface area and cation exchange capacity (CEC) values by a substantial margin. Exfoliated MMT platelets with a high aspect ratio are unique functional colloidal 2D materials, which can be incorporated into hydrophilic polymers to form a novel class of nanocomposite that possess great potential as superabsorbents, drug vehicles, tissue scaffolds, wound dressing and biosensors.15–19
Despite the importance of MMT exfoliation in many industrial processes, few works have been done to directly quantify the degree of exfoliation in a consistent and statistically significant way. Dynamic light scattering (DLS) or transmission electron microscopy (TEM) often used to measure the platelet size of exfoliated MMT.20 But DLS cannot measure the degree of exfoliation, and only provides a convenient means of measuring an “effective spherical” particle diameter. TEM can direct view the dimensions of platelets, but also cannot determine the degree of exfoliation. Atomic force microscopy (AFM) has also become an important technique for the characterization of nanoparticles.21,22 AFM has been used to characterize the distribution of MMT platelet thickness. But, the drying of the particles in AFM measurements might cause the re-aggregation of the thin flakes. Accordingly, there is a great significance to develop a new method to estimate the exfoliation degree of MMT in aqueous media.
It is well known that the turbidity of a colloidal dispersion closely correlates to the number of particles in the dispersion. In this study, an attempt has been made to investigate exfoliation degree of MMT in aqueous media through turbidity measurement. The objective is to establish the relationship between exfoliation and turbidity of MMT particles in aqueous media, in order to obtain more understandings of the property of the exfoliated MMT platelets.
2. Theoretical background
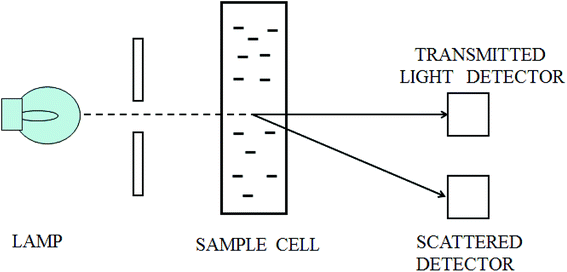
When a beam of light traverses a material medium, its intensity is reduced, either by absorption and/or by scattering, as shown in Fig. 1. When the light attenuation is entirely caused by scattering due to the particles not absorbing the light, so the ratio of total scattering intensity by the suspension (IS) to the initial light intensity (I0) is equal to suspension turbidity and can be written as:23
 | (1) |
 is scattering power, which is the scattered light intensity at angle θ to the incident beam by one particle.
Within the framework of the Rayleigh–Gans–Debye approximation, the scattering power by one MMT particle at a scattering angle θ can be written as:24
 | (2) |
After being exfoliated, one MMT particle with the dimension of a × b × c0 turn into n platelets with the dimension of a × b × c. The turbidity ratio of the suspension of MMT before and after being exfoliated can be written by:
 | (3) |
Combining eqn (1)–(3), we define exfoliation degree:
It shows that the exfoliation degree is directly proportional to the number of new MMT platelets formed from the exfoliation of original MMT particles.
3. Experimental
3.1. Materials
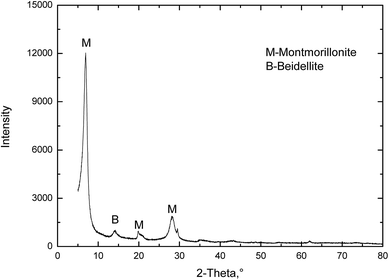
The original MMT used in the present study was collected from Sanding Technology Co., Ltd, Zhejiang province, China. A common method for obtaining purified colloidal MMT is fractionation by sedimentation after removal of carbonates, oxides, and organic materials. The MMT suspensions was dried at 100 °C and ground to pass through 200 mesh sieve. The powder XRD pattern of the pristine MMT is shown in Fig. 2. It shows that the pristine MMT particles were very high grade and contained negligible impurities.Sodium chloride (NaCl), potassium chloride (KCl), calcium chloride (CaCl2), magnesium chloride (MgCl2), ferric chloride (FeCl3) and aluminium chloride (AlCl3) were from the Sinopharm Chemical Reagent Co., Ltd (China). All of them were of analytical purity. The water used in this work was produced using a Millipore Milli-Q Direct 8/16 water purification system with 18.2 MΩ.
3.2. Measurements
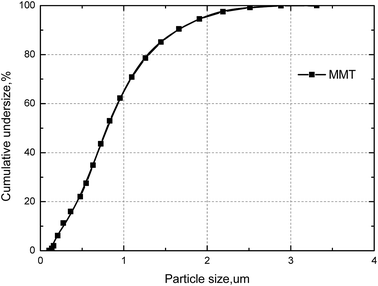
X-ray diffraction (XRD) analysis was carried out with a Bruker D8 Advance X-ray diffractometer with Cu Kα radiation. The diffraction patterns in the 2θ range from 10° to 90° were collected with a step-scanning speed of 10° min−1.The particle size distribution of the MMT samples were estimated by light scattering, using a Malvern Mastersizer 2000. Sample aliquots were placed in an ultrasonic bath for 1 min before measurement. As shown in Fig. 3, the MMT sample at 50% cumulative undersize (D50) and the particle size at 80% cumulative undersize (D80) were of 0.8 μm and 1.4 μm, respectively.
The exfoliated MMT platelets were got according to a ultrasonic process rather similar to that indicated by Song et al.25 The MMT powder was added into highly deionized Milli-Q water in a beaker and then mixed for 30 min with a magnetic stirrer to ensure a homogeneous distribution, called as un-exfoliated MMT. The MMT suspensions were treated by a Vernon Hills Illinois CP505 ultrasonic dispersion instrument (40 kHz) at different ultrasonic intensity for a fixed time. Then a Fluko FA25 high speed mixer was used to disperse the suspensions with 10![[thin space (1/6-em)]](https://www.rsc.org/images/entities/char_2009.gif) 000 rpm for 3 min. The ultrasonic and shearing treatment was done to exfoliate the MMT.
000 rpm for 3 min. The ultrasonic and shearing treatment was done to exfoliate the MMT.
For turbidity measurement, MMT suspension was first dispersed by the high speed mixer for 1 min and then 20 mL MMT suspension was estimated for nephelometric turbidity, using a WTW turb555IR turbidimeter. The nephelometer is connected to a computer which collects the data. Three values were recorded for each sample to minimize errors.
4. Results and discussions
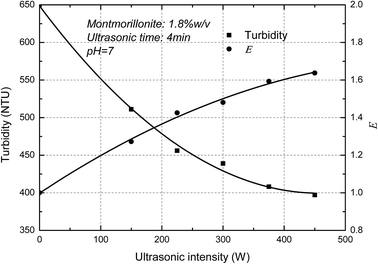
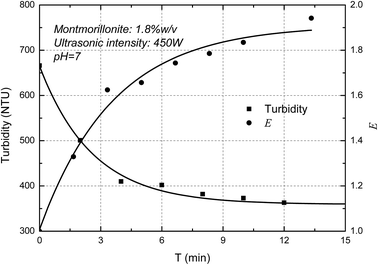
The turbidity of the MMT suspensions as a function of ultrasonic intensity was measured below. It showed in Fig. 4 that the turbidity of MMT suspensions decreased as increasing ultrasonic intensity and the E value increased with the increase of ultrasonic intensity. The curves thus obtained are typical of such experiments with a decrease in turbidity due to the Mie theory. In-line turbidimetry results follow the Mie theory demonstrate that decreasing the original clay particle size below 500 nm results in decreasing the turbidity.26 Compared with a different method for the determination of the exfoliation degree of montmorillonite in previous papers,27 the trend of AFM measurements which the degree of exfoliation of MMT increase with increasing ultrasonic intensity corresponded well with the turbidity results. Consequently, the result demonstrated that the new concept, E, can used to represent the exfoliation degree of the MMT particles.Fig. 5 shows the ultrasonic time on the turbidity of the MMT suspensions. It is clearly shown that the turbidity of MMT suspensions decreased as increasing ultrasonic time. In other words, the E value increased with the increase of ultrasonic time. And the E value reaches the plateau value due to the exfoliation degree of MMT reaches the limit. Similar results were reported elsewhere by other researchers.28 Therefore, the exfoliation degree of MMT can be well estimated by the turbidity measurement.
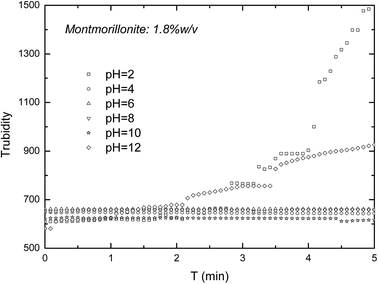
In the actual situation, the turbidity of suspensions will reduce due to not only the exfoliation of MMT, but also the coagulation and settling down of particles. In the case of that MMT platelets settle down during the exfoliation of MMT particles, the turbidity method might lead to errors. So, turbidity method needs the stable exfoliated MMT suspensions for the longest duration possible. In this part, turbidity was measured as a function of the pH value and solid concentration. Fig. 6 shows the turbidity of the un-exfoliated MMT as a function of time. As seen in Fig. 6, the turbidity of the un-exfoliated MMT increase with the increase of time at pH 2 and 12, but keep stable at pH 4, 6, 8 and 10. This increase might be from the consequence of the corresponding decrease in double layer thickness and the formation of small flocs.29
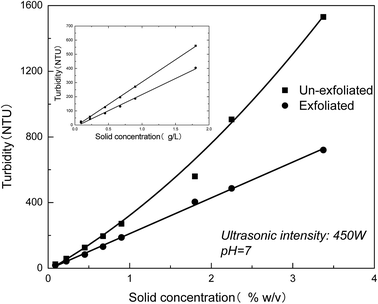
The exfoliation behavior in dispersions of different MMT contents is next characterized by turbidity measurement. Fig. 7 shows that turbidity of the un-exfoliated and exfoliated MMT as a function of solid concentration. As seen in Fig. 7, the turbidity of the un-exfoliated MMT changes linearly with the solid concentration below 2% w/v. Above the critical concentration, the turbidity of MMT undergo an unnormal value. This result indicates that the turbidity measurement for evaluation of the exfoliation degree of MMT in aqueous suspensions should be applied between pH value 4–10 and below the solid concentration of 2% w/v.
To investigate the effects of the electrolytic ions on the exfoliation kinetics of MMT, the turbidity of un-exfoliated and exfoliated MMT as a function of electrolytic ions was measured below. It showed in Fig. 8 that the E value decreased when compared to the MMT sample with no added electrolytic ions. The electrolytic ions concentration keeps very low levels to avoid the coagulation. Obviously, the MMT sample with no salt is expected to undergo better exfoliation. This demonstrates that the presence of electrolytic ions can slow down the MMT exfoliation process. This observation might be attributed to the decreasing of osmotic pressure difference between the intra-tactoid regime and the bulk water medium.
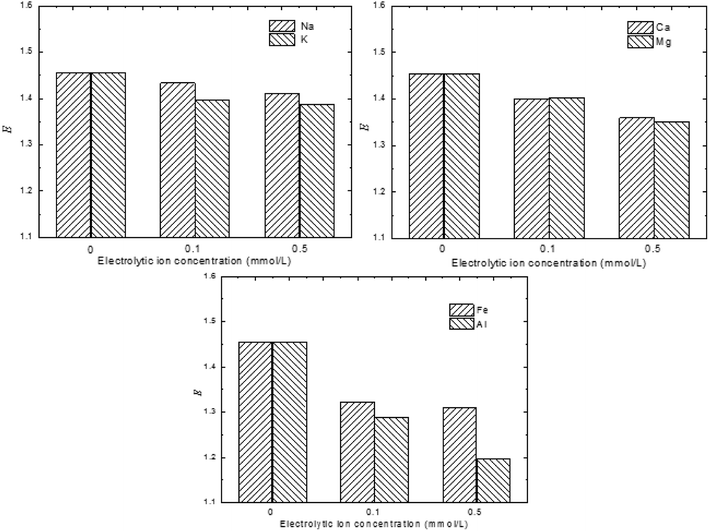 | ||
| Fig. 8 Exfoliation degree of MMT as a function of electrolytic ions in the bulk medium (montmorillonite: 1.8%w/v, ultrasonic intensity: 450 W, pH = 7). | ||
The degree of exfoliation of MMT suspension in the function of electrolytic ions in various valences was also studied. Clearly, the degree of exfoliation was greatly dependent on the valence of the cation presented in the suspension. The multivalent cations exerted a greater influence on the degree of exfoliation than the monovalent cation. This observation might be due to the influence of reverse osmotic pressure and the specific adsorption of the trivalent cation in the Stern layer.30
5. Conclusions
(1) There is a close relationship between the turbidity and exfoliation degree of MMT in aqueous suspensions. The exfoliation degree is directly proportional to E and the larger E value indicated more MMT flakes formed. It needs to stabilize the exfoliated MMT materials for the longest duration in the turbidity measurement.(2) Also, pH value and solid concentration were the dominant factor in turbidity measurement. The turbidity measurement for evaluation of the exfoliation degree of MMT in aqueous suspensions should be applied between pH value 4–10 and below the solid concentration of 2% w/v.
(3) The presence of electrolytic ions in the medium hinders the exfoliation process and the degree of exfoliation decreased with the increasing ions concentration and valences.
Conflicts of interest
There are no conflicts to declare.Acknowledgements
This work was financially supported by the National Natural Science Foundation of China under the project No. 51474167, 51674183 and 51874220 and the Fundamental Research Funds for the Central Universities under the project No. 2017-YB-025.References
- P. F. Luckham and S. Rossi, Adv. Colloid Interface Sci., 1999, 82, 43–92 CrossRef CAS.
- A. K. Geim, Science, 2009, 324, 1530–1534 CrossRef CAS PubMed.
- K. F. Mak, C. Lee, J. Hone, J. Shan and T. F. Heinz, Phys. Rev. Lett., 2010, 105, 2–5 CrossRef PubMed.
- F. L. Deepak, C. P. Vinod, K. Mukhopadhyay, A. Govindaraj and C. N. R. Rao, Chem. Phys. Lett., 2002, 353, 345–352 CrossRef CAS.
- Q. H. Wang, K. Kalantar-Zadeh, A. Kis, J. N. Coleman and M. S. Strano, Nat. Nanotechnol., 2012, 7, 699–712 CrossRef CAS PubMed.
- S. Kaufhold and R. Dohrmann, J. Colloid Interface Sci., 2013, 390, 225–233 CrossRef CAS PubMed.
- F. Jia and S. Song, Surf. Rev. Lett., 2014, 21, 1430001 CrossRef.
- Z. Wang, X. Wang, G. Li and Z. Zhang, Appl. Clay Sci., 2008, 42, 146–150 CrossRef CAS.
- C. Mu, X. Li, Y. Zhao, H. Zhang, L. Wang and D. Li, J. Appl. Polym. Sci., 2013, 128, 3141–3148 CrossRef CAS.
- J. E. F. C. Gardolinski and G. Lagaly, Clay Miner., 2005, 40, 547–556 CrossRef CAS.
- Y. Wang, Y. Peng, T. Nicholson and R. A. Lauten, Appl. Clay Sci., 2015, 114, 48–52 CrossRef CAS.
- E. Forbes, K. J. Davey and L. Smith, Miner. Eng., 2014, 56, 136–144 CrossRef CAS.
- L. Huynh, A. Feiler, A. Michelmore, J. Ralston and P. Jenkins, Miner. Eng., 2000, 13, 1059–1069 CrossRef CAS.
- T. Chen, Y. Zhao and S. Song, Powder Technol., 2017, 309, 61–67 CrossRef CAS.
- S. Sinha Ray and M. Okamoto, Prog. Polym. Sci., 2003, 28, 1539–1641 CrossRef.
- M. Alexandre and P. Dubois, Mater. Sci. Eng., R, 2000, 28, 1–63 CrossRef.
- W. Wang, Y. Zhao, H. Bai, T. Zhang, V. Ibarra-Galvan and S. Song, Carbohydr. Polym., 2018, 198, 518–528 CrossRef CAS.
- W. Wang, Y. Zhao, H. Yi, T. Chen, S. Kang, H. Li and S. Song, Nanotechnology, 2018, 29, 025605 CrossRef PubMed.
- S. Kang, Y. Zhao, W. Wang, T. Zhang, T. Chen, H. Yi, F. Rao and S. Song, Appl. Surf. Sci., 2018, 448, 203–211 CrossRef CAS.
- M. Plaschke, T. Schafer, T. Bundschuh, T. N. Manh, R. Knopp, H. Geckeis and J. I. Kim, Anal. Chem., 2001, 73, 4338–4347 CrossRef CAS.
- H. J. Ploehn and C. Y. Liu, Ind. Eng. Chem. Res., 2006, 45, 7025–7034 CrossRef CAS.
- A. Cadene, S. Durand-Vidal, P. Turq and J. Brendle, J. Colloid Interface Sci., 2005, 285, 719–730 CrossRef CAS PubMed.
- F. Jia, B. Yang, J. Su and S. Song, Curr. Nanosci., 2016, 12, 260–265 CrossRef CAS.
- M. M. A. Elsayed and G. Cevc, Pharm. Res., 2011, 28, 2204–2222 CrossRef CAS PubMed.
- Y. Zhao, H. Yi, F. Jia, H. Li, C. Peng and S. Song, Powder Technol., 2016, 306, 74–79 CrossRef.
- R. Sengupta, S. Chakraborty, S. Bandyopadhyay, S. Dasgupta, R. Mukhopadhyay, K. Auddy and A. S. Deuri, Engineering, 2007, 47, 21–25 Search PubMed.
- T. Chen, Y. Zhao and S. Song, Colloids Surf., A, 2017, 525, 1–6 CrossRef CAS.
- S. Ali and R. Bandyopadhyay, Appl. Clay Sci., 2015, 114, 85–92 CrossRef CAS.
- L. J. Michot, I. Bihannic, F. Thomas, B. S. Lartiges, Y. Waldvogel, C. Caillet, J. Thieme, S. S. Funari and P. Levitz, Langmuir, 2013, 29, 3500–3510 CrossRef CAS PubMed.
- F. Rao, F. J. Ramirez-Acosta, R. J. Sanchez-Leija, S. Song and A. Lopez-Valdivieso, Appl. Clay Sci., 2011, 51, 38–42 CrossRef CAS.
| This journal is © The Royal Society of Chemistry 2018 |

