 Open Access Article
Synthesis and characterization of a single phase zeolite A using coal fly ash
Xiaoyu Ren,
Lifeng Xiao,
Ruiyang Qu,
Shaojun Liu*,
Dong Ye,
Hao Song,
Weihong Wu,
Chenghang Zheng,
Xuecheng Wu and
Xiang Gao *
*
State Key Laboratory of Clean Energy Utilization, Zhejiang University, Hangzhou 310027, China. E-mail: phoenix205@zju.edu.cn; xgao1@zju.edu.cn
First published on 18th December 2018
Abstract
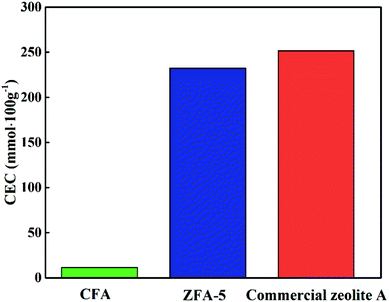
Zeolitization of coal fly ash (CFA) provides a potential alternative for creating high-added-value products from this hazardous solid waste. In this work, a single phase zeolite A with high crystallinity was successfully synthesized from CFA via the alkali fusion hydrothermal method. X-ray diffraction (XRD), scanning electron microscopy (SEM), X-ray fluorescence (XRF), Fourier transform infrared (FT-IR) spectroscopy, N2 physisorption, and solid-state MAS NMR spectra were applied to characterize as-synthesized zeolites. Results indicated that the type and purity of zeolite were closely related to the synthesis conditions and parameters. A well-defined cubic shape of zeolite A with a specific surface area of 43.7 m2 g−1 was obtained at a low temperature of 75 °C during hydrothermal treatment for 18 h. The ammonium cation exchange capacity (CEC) test showed an impressive value of 232.2 mmol 100 g−1 over prepared zeolite A, which was about 22 times that of the original CFA and close to commercial zeolite A. These results pave the way for the exploitation and utilization of the CFA.
1. Introduction
In the past few decades, prosperity in economy and human life has demanded huge energy consumption.1 Most energy derives from fossil fuel and other renewable sources, including solar, wind, hydropower and biomass. In China, it is assumed that 70% of the total energy is provided through coal combustion.2 During the coal utilization process, a great deal of coal fly ash (CFA) is generated, the worldwide amount of which has reached 160 million tons per year recently.3 However, only 20% of CFA is properly used in construction and the remaining is directly dumped into landfill, which does harm to water resources and human health.4 Therefore, it is extremely necessary and significant to explore efficient ways to reuse fly ash.Zeolites are important porous materials with open three-dimensional ordered skeleton structures. Zeolites has been widely used in various industrial fields because of their high specific surface area, excellent cationic exchange capacity, thermal stability, shape selection selectivity and other properties.5,6 Based on different applications, various zeolites have been successfully synthesized, such as X,7 Y,8 ZSM-5,9 MOR,10 and even pure silicon zeolite. Furthermore, for some specific reactions, zeolites has been modified and doped with the metals. Zhao et al. obtained a good catalytic performance in the selective oxidation of styrene by doping with vanadium or manganese on silicalite-1.11,12 Grand et al. synthesized silanol-free nanosized MFI-type zeolites via one-pot method as well as introducing tungsten. W-MFI exhibits an excellent catalytic epoxidation performance of styrene and high separation capacity of CO2 and NO2.13
Among hundreds of different types of zeolites, zeolite A is one of great importance because of the small aperture of about 4 Å, and high molar ratio of aluminum to silicon (∼1), which can provide a large number of sites for cation exchange.14,15 Thanks to the outstanding characteristics such as non-toxicity and high thermal stability,16 zeolite A has been extensively used for waste treatment,17–19 and product separation.20 However, the high cost resulting from the expensive precursors used mainly limits the wide applications of zeolite A. Recently, great efforts have been made to solve this problem.21–24
Considering that silicon and aluminum are the main components of CFA, it is reasonable to conceive the idea of prepare zeolite A from CFA.25 However, insoluble crystalline phases such as quartz and mullite introduced from CFA may reduce the cation exchange capacity (CEC) and limit the application of zeolites.26 To address this problem, the addition of alkali to fly ash during calcination could get rid of these crystalline phases, which would be beneficial for the formation of pure phase in zeolite products.27,28 Besides, impurities such as iron were also reported to negatively affect the synthesis of zeolites.29 As a result, acid treatment is favorable to remove iron and other heavy metals and further improve the CEC and crystallinity of zeolites.30
In this work, a single phase zeolite A was successfully synthesized based on CFA by the alkali fusion hydrothermal method. Key parameters such as the mass ratios NaOH to fly ash, NaOH melt temperatures, liquid–solid ratios, hydrothermal temperatures and time have been systematically investigated. In addition, the effect of acid treatment on iron removal were carefully discussed in this paper.
2. Experimental
2.1 Materials and reagents
The CFA was provided from Datang International Power Generation Co. Ltd. (Zhejiang Province, China). NaAlO2, NaOH, HCl and NH4Cl were purchased from Sinopharm Chemical Reagent Co. Ltd. Deionized water was used in all solution preparations.2.2 Preparation of zeolite A
2.3 Cation exchange capacity (CEC) test
CEC was evaluated by a straightforward principle of ion exchange, in which Na+ ions in the three-dimensional structure of zeolite are replaced by NH4+ ions of an ammonium-containing solution.31 The suspension, which was vibrated at 25 °C for 24 h, consisted of 0.5 g ZFA and 50 mL of 1000 mg L−1 NH4+ solution. The NH4+ concentration was measured with a UV spectrophotometry (HACH, DR 5000, America) at 395 nm by Nessler's reagent spectrophotometry.32 The functional relationship between absorbance and NH4+ content in solution was obtained according to Chinese standard HJ 535-2009. Then the value of CEC was calculated by the difference between the original reactive concentration and the equilibrium one. The experiments were repeated three times and the mean value was taken to reduce uncertainty.2.4 Characterizations
Crystal phase analysis of all substances were determined using X-ray diffraction spectroscopy (Rigaku, D/max-2200, Japan) with 2θ between 5° and 60° using Cu Kα radiation. The relative “% crystallinity” of product was counted based on eqn (1).33
 | (1) |
The surface morphology of all substances were identified by scanning electron microscope (SEM, FEI Quanta 400 FEG). The surface nature of the prepared samples were investigated using Fourier transform infrared spectroscopy (FTIR) in the range of 400–4000 cm−1 (Nicolet NEXUS 6700). The specific surface area, total pore volume and pore size distribution were measured by the way of BET technique (Quantachrome Autosorb-1 instrument). Before adsorption, the samples were degassed at 350 °C for 8 h. Solid-state NMR experiments were performed on a Bruker AVANCE III 400 WB spectrometer with the X channel of 104.27 MHz for 27Al and 79.50 MHz for 29Si. The standard of chemical shifts were referenced to the resonances of [Al(H2O)6]3+ (27Al) and 3-(trimethylsilyl)-1-propanesulfonic acid sodium salt (29Si), respectively.
3. Results and discussion
3.1 Coal fly ash characterization and iron removal
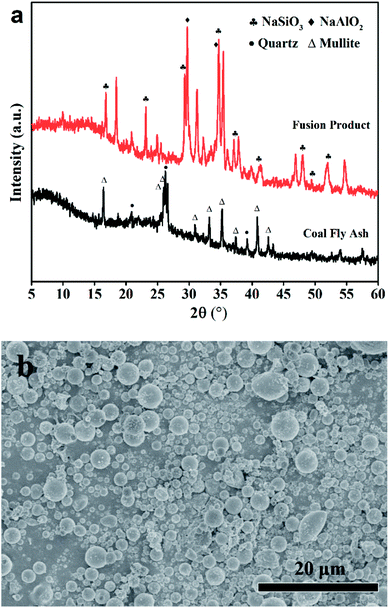
The chemical ingredients of CFA are shown in Table 1. The total content of SiO2 and Al2O3 was found to be high than 70%. The XRD pattern in Fig. 1(a) suggested that the CFA sample contained large amounts of quartz and mullite. The broad peak at 26° was classified as amorphous silicon-aluminum materials. SEM image in Fig. 1(b) shows that the CFA particles are spherical with the size smaller than 6 μm.| Ingredients | CFA | Acid-CFA | ZFA |
|---|---|---|---|
| SiO2 | 44.7 | 60.1 | 40.6 |
| Al2O3 | 26.2 | 24.8 | 33.2 |
| CaO | 10.4 | 2.41 | 0.88 |
| Fe2O3 | 8.97 | 5.11 | 1.62 |
| TiO2 | 2.41 | 2.35 | 0.82 |
| Na2O | 0.76 | 0.91 | 21.9 |
| Others | 6.56 | 4.32 | 0.88 |
| Si/Al | 1.44 | 2.06 | 1.04 |
A series of parameters were adjusted to seek the optimum method for iron removal, such as HCl concentration, liquid–solid ratios, reaction temperature and reaction time. As is given in Fig. 2, a maximum removal efficiency (43.1%) was obtained under the condition of 5 wt% of HCl and a liquid–solid ratio of 20 at 85 °C for 3 h.
 | ||
| Fig. 2 Iron-removal efficiency at different (a) HCl concentration; (b) liquid–solid ratios; (c) reaction temperature; (d) reaction time. | ||
3.2 Effect of mass ratios NaOH to fly-ash
The XRD patterns in Fig. 1(a) illustrate the transformation process of fly ash components during NaOH etching. Compared with the original CFA, a noticeable change has taken place. NaAlO2 and Na2SiO3 phases appeared at the cost of the diminishment of quartz and mullite phases, as explained in eqn (2):| NaOH + xAl2O3·ySiO2 → Na2SiO3 + NaAlO2 | (2) |
NaAlO2 and Na2SiO3 could dissolve easily in water and eventually make up the zeolite framework. ZFA zeolites in Fig. 3 were acquired with different mass ratios of NaOH to fly ash from 0.5 to 2.0. No peaks for zeolite A was found at the mass ratio of 0.5. When increasing the ratios, zeolite A (JCPDS card no. 39-0222) became the main crystalline phase and the intensity of diffraction peaks also increased. It was also observed that the peak intensity was the highest when the ratio reached 1.5. In contrast, the peaks of zeolite A decreased slightly at the ratio of 2.0. Fig. 10(a) shows that the variation of CEC values of ZFA is consistent with the XRD results. With low NaOH, the inert crystals were not completely transformed into soluble silico-aluminate, resulting in a low yield of zeolite A and low CEC value. However, with an excessively high amount of NaOH, parts of zeolite skeleton structures were eroded to collapse, and the CEC value was still low. Therefore, the optimal NaOH to fly ash ratio was 1.5 with the maximum CEC of 151.1 mmol 100 g−1.
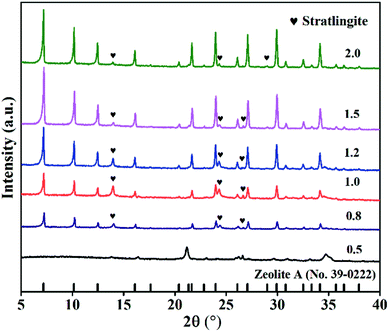 | ||
| Fig. 3 XRD spectra of products with different mass ratios of NaOH to fly ash (NaOH melt treatment: 650 °C, 2 h; hydrothermal treatment: 85 °C, 6 h, liquid/solid = 5, Si/Al = 1). | ||
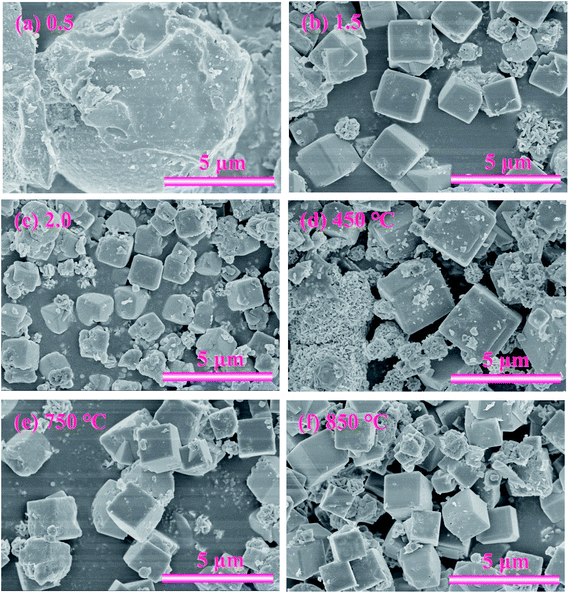
SEM was also used to study the morphology of the three samples, as exhibited in Fig. 5(a)–(c). When the ratio was 0.5, only irregular spherical particles appeared, indicating that no zeolite A was obtained. With the ratio increasing to 1.5, angular cubic crystal structure of the zeolite A particles can be clearly observed. However, when the ratio increased to 2.0, the crystals became coarser and most cubic structures were seriously destroyed. As a result, the mass ratio of 1.5 was considered to be an optimized value in the investigated range for the synthesis of zeolite A. The product under this condition was named ZFA-1.
3.3 Effects of NaOH melt temperatures
The XRD patterns of ZFA at different NaOH melt temperatures are displayed in Fig. 4. The products were predominantly ZFA phases. The apparent characteristics of ZFA with various NaOH melt temperatures are shown in Fig. 5(d)–(f). It can be clearly seen that when the fusion temperature was 450 °C, amorphous substance and incomplete cubic particles existed simultaneously, indicating that most silicon-aluminum compounds were free from the reaction. With NaOH melt temperature increasing, more complete cubic grains and larger particles were formed. In the meantime, lots of amorphous substances were significantly reduced. The effects of the NaOH melt temperatures on the CEC are indicated in Fig. 10(b). As the NaOH melt temperatures went up from 450 °C to 750 °C, CEC values increased appreciably. At 850 °C there was still a small increment. Considering the energy consumption, 750 °C was chosen to be the appropriate value under which the CEC of the product was 160.9 mmol 100 g−1. The product under this condition was named ZFA-2.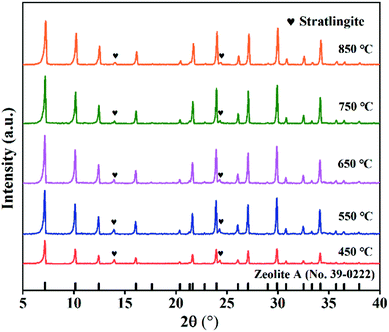 | ||
| Fig. 4 XRD patterns of products at different NaOH melt temperatures (NaOH melt treatment: NaOH/CFA = 1.5, 2 h; hydrothermal treatment: 85 °C, 6 h, liquid/solid = 5, Si/Al = 1). | ||
3.4 Effect of liquid–solid ratios
Fig. 6 illustrates the XRD profiles of the samples obtained at various ratios of liquid to solid (l/s ratio). It can be seen that no zeolite A formed at the l/s ratio of 1, while a new phase related to sodalite appeared. At the l/s ratio of 5, zeolite A began to appear with stratlingite impurity. With increasing the l/s ratios, the pure phase diffraction peaks belonging to zeolite A were generated. Based on the above observations, it is inferred that excessively low l/s ratio is adverse for the zeolite A conversion.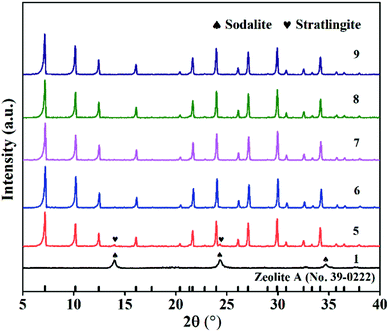 | ||
| Fig. 6 XRD spectra of samples at different ratios of liquid to solid (NaOH melt treatment: NaOH/CFA = 1.5, 750 °C, 2 h; hydrothermal treatment: 85 °C, 6 h, Si/Al = 1). | ||
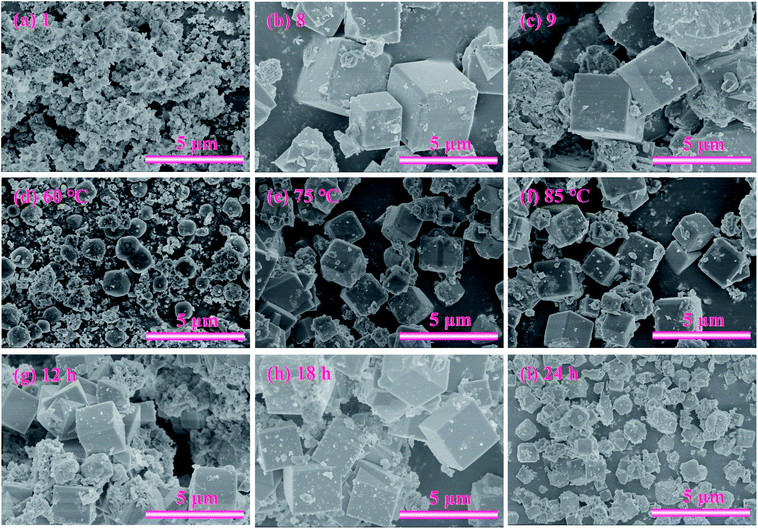
To further determine the optimal l/s ratio, the morphologies of the products with the l/s ratios ranging from 1 to 9 were studied by scanning electron microscope (SEM), which revealed the evolution process of zeolite A. As exhibited in Fig. 9(a), a lot of amorphous aluminosilicate and some imperfect spherical particles with surface corrosion aggregated together. As the l/s ratio increased, small spherical particles and amorphous aluminosilicate gradually grew into large cubic particles. Moreover, shapes of zeolite A particles became more complete and angular (Fig. 9(b) and (c)). Fig. 10(c) indicates the influence of l/s ratios on the CEC of ZFA. The CEC values rapidly increased with the l/s ratio ascending until the first plateau was reached (from 5 to 7). Then a second one could be observed in the range between 8 and 9. Accordingly, 8 of l/s ratio was taken as the optimum value and corresponding CEC was 210.4 mmol 100 g−1. The product under this condition was named ZFA-3.
3.5 Effect of hydrothermal temperatures
The XRD patterns of ZFA with different hydrothermal temperatures are displayed in Fig. 7. It is clearly seen that in the hydrothermal temperature ranging from 60 °C to 85 °C, the peak intensity increased and zeolite A was obtained. Furthering increasing the temperature to 95 °C, the peak intensity decreased and impurities appeared.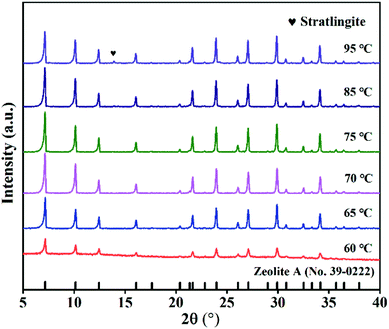 | ||
| Fig. 7 XRD spectra of samples at various hydrothermal temperatures (NaOH melt treatment: NaOH/CFA = 1.5, 750 °C, 2 h; hydrothermal treatment: 6 h, liquid/solid = 8, Si/Al = 1). | ||
Fig. 9(d)–(f) provide the apparent features of the products at different hydrothermal temperatures. A large number of amorphous morphologies and less irregular cubic structures of products at 60 °C for 6 h were observed. As the hydrothermal temperature increased, intact crystal plane with larger size were generated. The obtained results are consistent with XRD profiles in Fig. 6. It should be noted that the highest CEC value of 216.4 mmol 100 g−1 can be obtained at 75 °C in Fig. 10(d). Therefore, the appropriate hydrothermal temperature was 75 °C. The product under this condition was named ZFA-4.
3.6 Effect of hydrothermal time
In order to study the influence of hydrothermal time on the product structure, zeolite A was synthesized with different hydrothermal time. Fig. 8 shows XRD spectra of products obtained at 75 °C from 6 h up to 24 h. When the time rose from 6 h to 18 h, only high purity zeolite NaA was produced. However, further prolonging the hydrothermal time to 24 h, an impurity phase was detected in the products. This means that during the crystallization process, the as-synthesized zeolite A begins to transform into other crystalline phases.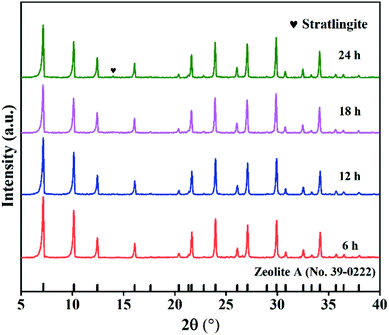 | ||
| Fig. 8 XRD spectra of samples after different hydrothermal time (NaOH melt treatment: NaOH/CFA = 1.5, 750 °C, 2 h; hydrothermal treatment: 75 °C, liquid/solid = 8, Si/Al = 1). | ||
Fig. 9 displays the SEM pictures of products obtained at various hydrothermal time. As seen in Fig. 9(g), it is easy to pick out that some cubic grains were covered by a large amount of amorphous substances under the hydrothermal time of 6 h, indicating that most aluminosilicate has not yet formed zeolite. The amorphous flocculent materials disappeared when the hydrothermal time reached 18 h. The grains obtained were more complete with a uniform size of about 1.24 μm (as depicted in Fig. 9(h)). However, when the time was extended to 24 h, the cubic structures began to collapse and the aggregation of particles became more serious (Fig. 9(i)). This indicates that optimum hydrothermal time is beneficial for the formation of zeolite A. CEC values of the zeolites synthesized at various hydrothermal time are indicated in Fig. 10(e). The best adsorption capacity (232.2 mmol 100 g−1) was achieved at the hydrothermal time of 18 h. Note that CEC of CFA was only 11.4 mmol 100 g−1 (Fig. 11), while CEC of zeolite A was about 22 times that of CFA and was notably higher than the standard requirements of QB/T1.1-2009 (≥130 mmol NH4+ 100 g−1), which was also close to the value of commercial zeolite A (251.6 mmol NH4+ 100 g−1) from expensive precursors. The product under this condition was named ZFA-5.
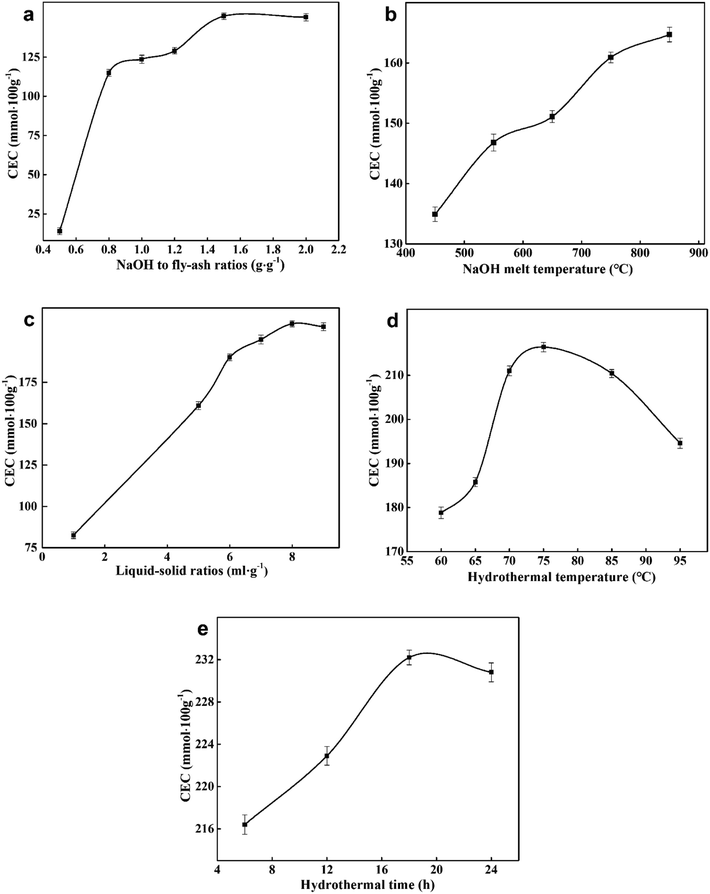 | ||
| Fig. 10 CEC of ZFA with various (a) NaOH to fly-ash ratios; (b) NaOH melt temperatures; (c) liquid–solid ratios; (d) hydrothermal temperatures; (e) hydrothermal time. | ||
3.7 Characterization of the prepared zeolite A
The significant improvement of CEC values could be discreetly correlated with pore structure changes. As can be seen from the Table 2, the BET surface areas and the total pore volume of all the zeolite A from ZFA-1 to ZFA-5 were much higher than that of CFA. The specific surface area and total pore volume obtained under the optimal conditions (sample ZFA-5) were 43.7 m2 g−1 and 0.0568 cm3 g−1 respectively. The broad aperture distribution ranged from 4.4 nm to 155.3 nm, and the equivalent size is 9.08 nm in the Fig. 12(d). In addition, the H3 hysteresis loop type represented the existence of slit-shaped mesoporous structure which mostly produced by the accumulation of particles.| Sample | SBET (m2 g−1) | Total pore volume (m3 g−1) | Mean pore size (nm) |
|---|---|---|---|
| CFA | 2.67 | 0.0068 | 11.9 |
| ZFA-1 | 11.8 | 0.0292 | 9.86 |
| ZFA-2 | 11.2 | 0.0256 | 8.22 |
| ZFA-4 | 34.4 | 0.0332 | 10.3 |
| ZFA-3 | 22.8 | 0.0558 | 9.60 |
| ZFA-5 | 43.7 | 0.0568 | 7.18 |
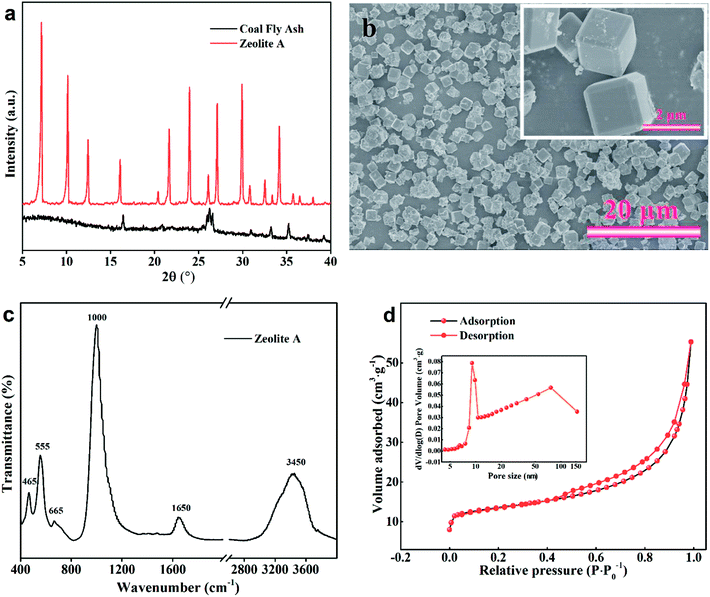 | ||
| Fig. 12 Zeolite A synthesized under optimized conditions (a) XRD spectra; (b) SEM images; (c) FT-IR spectra; (d) N2 sorption isotherms. | ||
In order to further investigate the physical and chemical properties of zeolite A prepared under the optimal conditions, further detections were executed by XRD SEM, FT-IR as well as 29Si and 27Al NMR. The amorphous aluminosilicate and the insoluble crystalline phases were completely transformed into zeolite A with high crystallization of 94% (Fig. 12(a)). The SEM photographs of the synthetic zeolite A powders are displayed in Fig. 12(b). It is obvious that defined cubic structure and intact crystal plane had been obtained. The size of crystal particles ranged from 1.0 to 2.5 μm.
As is known to all, the zeolite A framework is made up of β-cages formed by the interconnection of double 4-rings (D4R). Therefore, the arrangement of Si(Al) tetrahedron structural units can be analyzed by the FT-IR spectra. As can be clearly seen from Fig. 12(c), six distinct peaks were at about 3450, 1650, 1000, 665, 555 and 465 cm−1. Among them, the characteristic peaks at 465 cm−1, 555 cm−1, and 1000 cm−1 were assigned to the internal vibrations of T–O (T = Si or Al) bending, the double four-rings bending, and the internal vibration of TO4 asymmetric stretch, respectively. Furthermore, the peaks detected at 1650 and 3450 cm−1 was ascribed to the existence of the H2O and hydroxyls, respectively.34
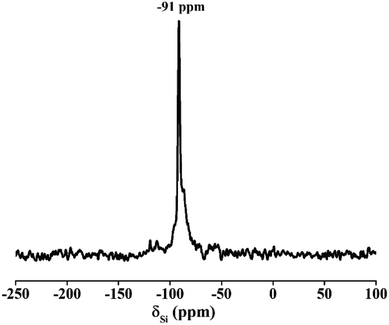
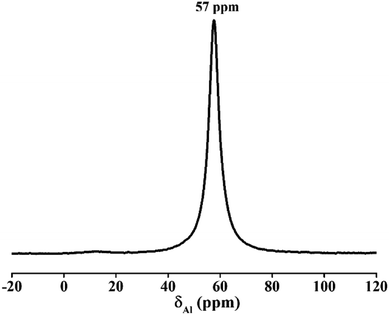
The 29Si NMR spectrum of zeolite A in Fig. 13 presents a unique peak at −91 ppm, which was belonged to (Si(4Al) tetrahedral structure) species.35 Only one high-intensity peak at 57 ppm was observed in Fig. 14. No spectral peak was found at 0–10 ppm, indicating that the Al is completely attributed to Al(O–Si)4 and there were no octahedral aluminum atomic groups.36,37 This result of 27Al NMR is in agreement with the previous result of 29Si NMR. Both imply that the silicon and aluminum species exist in the framework of molecular sieve and the product has a high degree of crystallinity.
4. Conclusions
The above experimental results showed a feasible way to convert abandoned CFA into high value-added zeolite A. Several key steps are listed below:(1) In order to remove undesired elements such as iron, acid treatment were conducive.
(2) NaOH fusion should be performed and the optimum conditions were NaOH to fly ash ratio of 1.5![[thin space (1/6-em)]](https://www.rsc.org/images/entities/char_2009.gif) :
:![[thin space (1/6-em)]](https://www.rsc.org/images/entities/char_2009.gif) 1, 750 °C calcination temperature for 2 h. In this way, quartz and mullite phases in the CFA could be converted into water-soluble salts.
1, 750 °C calcination temperature for 2 h. In this way, quartz and mullite phases in the CFA could be converted into water-soluble salts.
(3) Zeolite A could be successfully synthesized by adding NaAlO2 into CFA to adjust the Si/Al molar ratio to 1.04, which was consistent with the theoretical Si/Al molar ratio of zeolite A.
(4) The optimum hydrothermal conditions were liquid to solid ratio of 8![[thin space (1/6-em)]](https://www.rsc.org/images/entities/char_2009.gif) :
:![[thin space (1/6-em)]](https://www.rsc.org/images/entities/char_2009.gif) 1, 75 °C for 18 h.
1, 75 °C for 18 h.
Based on above steps, a single crystal phase zeolite A with high crystallinity could be obtained, which showed the CEC value of 232.2 mmol 100 g−1, close to that of the commercial one.
Conflicts of interest
There are no conflicts to declare.Acknowledgements
This work was financed by the National Key Research and Development Program of China (No. 2017YFC0210403), and National Science Foundation of China (No. U1609212 and No. 51621005).Notes and references
- A. Mandal and D. Sengupta, Environ. Geol., 2003, 44, 180–186 CrossRef.
- J. L. Chen and X. W. Lu, J. Mater. Cycles Waste Manage., 2018, 20, 489–495 CrossRef CAS.
- Z. T. Yao, X. S. Ji, P. K. Sarker, J. H. Tang, L. Q. Ge, M. S. Xia and Y. Q. Xi, Earth-Sci. Rev., 2015, 141, 105–121 CrossRef.
- M. Delkash, B. E. Bakhshayesh and H. Kazemian, Microporous Mesoporous Mater., 2015, 214, 224–241 CrossRef CAS.
- S. F. Mousavi, M. Jafari, M. Kazemimoghadam and T. Mohammadi, Ceram. Int., 2013, 39, 7149–7158 CrossRef CAS.
- F. Hasan, R. Singh, G. Li, D. Zhao and P. A. Webley, J. Colloid Interface Sci., 2012, 382, 1–12 CrossRef CAS PubMed.
- J. M. Gómez, E. Díez, A. Rodríguez and M. Calvo, Microporous Mesoporous Mater., 2018, 270, 220–226 CrossRef.
- T. F. Mastropietro, E. Driolia and T. Poerio, RSC Adv., 2014, 4, 21951–21957 RSC.
- S. M. Kwan, A. Y. L. Leung and K. L. Yeung, Sep. Purif. Technol., 2010, 73, 44–50 CrossRef CAS.
- S. Y. Wang, B. He, R. Tian, C. Sun, R. Dai, X. Li, X. Wu, X. An and X. M. Xie, J. Colloid Interface Sci., 2018, 527, 339–345 CrossRef CAS PubMed.
- J. Zhao, Y. F. Zhang, S. Q. Zhang, Q. S. Wang, M. Chen, T. Hu and C. G. Meng, Microporous Mesoporous Mater., 2018, 268, 16–24 CrossRef CAS.
- J. Zhao, Y. F. Zhang, F. P. Tian, Y. Zuo, Y. Mu and C. G. Meng, Dalton Trans., 2018, 47, 11375–11385 RSC.
- J. Grand, S. N. Talapaneni, A. Vicente, C. Fernandez, E. Dib, H. A. Aleksandrov, G. N. Vayssilov, R. Retoux, P. Boullay, J. P. Gilson, V. Valtchev and S. Mintova, Nat. Mater., 2017, 16, 1010–1015 CrossRef CAS PubMed.
- P. C. Lei, X. J. Shen, Y. Li, M. Guo and M. Zhang, Int. J. Miner., Metall. Mater., 2016, 23, 850–857 CrossRef CAS.
- C. Covarrubias, R. Arriagada, J. Yáñez, R. García, M. Angélica, S. D. Barros, P. Arroyo and E. F. Sousa-Aguiar, J. Chem. Technol. Biotechnol., 2005, 80, 899–908 CrossRef CAS.
- N. M. Musyoka, L. F. Petrik, E. Hums, A. Kuhnt and W. Schwieger, Res. Chem. Intermed., 2015, 41, 575–582 CrossRef CAS.
- N. Meller, K. Kyritsis and C. Hal, Cem. Concr. Res., 2009, 39, 45–53 CrossRef CAS.
- A. Shoumkova and V. Stoyanova, J. Porous Mater., 2013, 20, 249–255 CrossRef CAS.
- K. S. Hui and C. Y. Chao, J. Hazard. Mater., 2006, 137, 401–409 CrossRef CAS PubMed.
- H. Tanaka, S. Fujimoto, A. Fujii, R. Hino and T. Kawazoe, Ind. Eng. Chem. Res., 2008, 47, 226–230 CrossRef CAS.
- M. Mezni, A. Hamzaoui, N. Hamdi and E. Srasra, Appl. Clay Sci., 2011, 52, 209–218 CrossRef CAS.
- G. Garcia, W. Aguilar-Mamani, I. Carabante, S. Cabrera, J. Hedlund and J. Mouzon, J. Alloys Compd., 2015, 619, 771–777 CrossRef CAS.
- Y. N. Ma, C. J. Yan, A. Alshameri, X. M. Qiu, C. Y. Zhou and D. Li, Adv. Powder Technol., 2014, 25, 495–499 CrossRef CAS.
- A. Á. B. Maia, R. F. Neves, R. S. Angélica and H. Pöllmann, Appl. Clay Sci., 2015, 108, 55–60 CrossRef CAS.
- S. S. Bukhari, J. Behin, H. Kazemian and S. Rohani, Fuel, 2015, 140, 250–266 CrossRef CAS.
- T. V. Ojumu, P. P. Du and L. F. Petrik, Ultrason. Sonochem., 2016, 31, 342–349 CrossRef CAS PubMed.
- W. Franus, M. Wdowin and M. Franus, Environ. Monit. Assess., 2014, 186, 5721–5729 CrossRef CAS PubMed.
- A. M. Cardoso, A. Paprocki, L. S. Ferret, C. M. N. Azevedo and M. Pires, Fuel, 2015, 139, 59–67 CrossRef CAS.
- K. Ojha, N. C. Pradhan and A. N. Samanta, Bull. Mater. Sci., 2004, 27, 555–564 CrossRef CAS.
- J. L. X. Hong, T. Maneerung, S. N. Koh, S. Kawi and C. H. Wang, Ind. Eng. Chem. Res., 2017, 56, 11565–11574 CrossRef CAS.
- L. Zhu, R. Zhu, L. Xu and X. Ruan, Colloids Surf., A, 2007, 304, 41–48 CrossRef CAS.
- C. F. Wang, J. S. Li, L. J. Wang and X. Y. Sun, J. Hazard. Mater., 2008, 155, 58–64 CrossRef CAS PubMed.
- L. Ding, H. Yang, P. Rahimi, O. Omotoso, W. Friesen, C. Fairbridge, Y. Shi and S. Ng, Microporous Mesoporous Mater., 2010, 130, 303–308 CrossRef CAS.
- X. Zhang, D. Tang and G. Jiang, Adv. Powder Technol., 2013, 24, 689–696 CrossRef CAS.
- J. Tan, Z. Liu, X. Bao, X. Liu, X. Han, C. He and R. Zhai, Microporous Mesoporous Mater., 2002, 53, 97–108 CrossRef CAS.
- M. Choi, H. S. Cho, R. Srivastava, C. Venkatesan, D. H. Choi and R. Ryoo, Nat. Mater., 2006, 5, 718–723 CrossRef CAS PubMed.
- T. O. Do, A. Nossov, M. A. Springuelhuet, C. Schneider, J. L. Bretherton, C. A. Fyfe and S. Kaliaguine, J. Am. Chem. Soc., 2004, 126, 14324–143245 CrossRef CAS PubMed.
| This journal is © The Royal Society of Chemistry 2018 |

