 Open Access Article
Creative Commons Attribution 3.0 Unported Licence
High-throughput continuous hydrodeoxygenation of liquid phase pyrolysis oil
K.
Treusch
 ab,
N.
Schwaiger
*ab,
K.
Schlackl
a,
R.
Nagl
a,
A.
Rollett
a,
M.
Schadler
a,
B.
Hammerschlag
a,
J.
Ausserleitner
a,
A.
Huber
a,
P.
Pucher
b and
M.
Siebenhofer
a
aInstitute of Chemical Engineering and Environmental Technology, Graz University of Technology, Austria. E-mail: nikolaus.schwaiger@tugraz.at
bBDI – BioEnergy International GmbH, Austria
First published on 25th April 2018
Abstract
Hydrodeoxygenation (HDO) of liquid phase pyrolysis oil with high water content was performed continuously in a plug flow reactor on a sulfided CoMo/Al2O3 catalyst under a hydrogen pressure of 120 bar at 400 °C. The intention of this project was to achieve fuels of diesel, kerosene and gasoline quality from liquid phase pyrolysis oil (LPP oil). The liquid hourly space velocity (LHSV) was altered between 0.5 h−1 and 3 h−1. The LHSV was higher than those reported for state-of-the-art HDO processes. The LPP oil was derived from the bioCRACK pilot plant in the OMV refinery in Vienna/Schwechat, which was operated by BDI – BioEnergy International GmbH. After HDO, separation of the upgraded hydrocarbon fraction from the aqueous carrier was achieved. About 50% of the biogenous carbon was transferred into the liquid hydrocarbon product phase, and the residual amount was transferred into the gas phase. Comparably slow catalyst aging by coke formation was attributed to the high water content of LPP oil. During HDO, a fuel of almost gasoline and diesel quality was produced. The H/C ratio was between 1.7 and 2 with a residual oxygen content of 0.0 wt% to 1.2 wt%. The boiling range of the hydrocarbon product phase was between those of gasoline and diesel. In GC-MS analysis, mainly saturated alkanes were found.
Introduction
Transport and therefore fuel demands are continuously increasing, along with increasing CO2 emissions. According to the adoption of the Paris agreement in 2015,1 climate change is targeted to be kept significantly below 2 °C. It is therefore of high importance to find alternative ways for the production of fuels out of biogenous feedstock. Lignocellulosic biomass plays a key role in this process because of its availability and sustainability.Among others, such as indirect liquefaction via gasification2 or hydrolysis,3 pyrolysis is a promising technology for fuel production. During the pyrolysis of biomass, under ambient conditions liquid, solid and gaseous products are formed.4 Liquid phase pyrolysis5 is a basic pyrolysis technology. The liquid heat carrier provides good heat transfer, and additionally to the formation of pyrolysis oil, biochar and gas, a part of the biomass is directly dissolved in the heat carrier during pyrolysis.6 Liquid phase pyrolysis is applied in the bioCRACK process,7,8 a refinery integrated process, developed by BDI – Bioenergy International GmbH. The bioCRACK process uses the heat carrier vacuum gas oil (VGO), combining the cracking of VGO with the pyrolysis of biomass.
Due to its properties, pyrolysis oil is not suitable to be used as a fuel. It has a low pH value, a high water and oxygen content and therefore a low calorific value.9 An upgrading step is necessary. This may be done by hydrodeoxygenation. Hydrogen reacts with the oxygen of pyrolysis oil to form water. For sustainable and cost-efficient application, hydrogen would be produced via gasification of biomass.10–12 HDO is usually performed in batch reactors13–18 or continuously at low liquid hourly space velocities of 0.1–0.5 h−1 in two steps,19–22 a hydrotreating step for stabilization purposes and a hydrocracking step.23 In most cases, oxygen cannot be removed completely.24 A single step process at a LHSV of 0.35 h−1 was described by D. Elliott,20 resulting in a bio-oil containing 3.6 wt% to 5.9 wt% oxygen. Low LHSV for the pyrolysis oil upgrade is a great hindrance to industrial application. Standard hydrocracking is operated at liquid hourly space velocities of up to 2.0 h−1, whereas hydrotreating of gasoil can be performed at liquid hourly space velocities of up to 3.0 h−1.25 This results in the incompatibility of pyrolysis oil HDO as a co-process of petrol refinery hydrocracking and hydrotreating. To overcome this problem, single step hydrodeoxygenation of LPP oil was investigated in the liquid hourly space velocity range of 0.5 h−1 to 3 h−1. The temperature was held constant at 400 °C. A sulfided metal oxide catalyst was used. Experiments were carried out at a hydrogen pressure of 120 bar.
An overview of state-of-the-art continuous HDO processes at various space velocities is shown in Table 1. A summary of historical HDO development of pyrolysis oils until 2007 was provided by Douglas C. Elliott.20 In the literature, the usage of the term liquid hourly space velocity varies and may be based on the volume of the reactor or the volume of the catalyst, where it is not clearly defined whether the bulk volume or the actual volume of the catalyst is meant. Sometimes the weight hourly space velocity (WHSV) is used. In many publications, there is no space velocity given at all, but it has to be calculated out of the reactor volume and the liquid flow rate.21,26,32 This makes a comparison based on the space velocity difficult.
| Publication | Institution | Pyrolysis oil | Stage | LHSV [h−1] | Catalyst | T [°C] | P [bar] | C/H/O [wt%] hydrocarbon product phase |
|---|---|---|---|---|---|---|---|---|
| a Calculated out of flow and reactor volume. b Weight hourly space velocity (WHSV) [g(oil) per g(cat) h]. c [ml(oil) per ml(catalyst)]. d Techno-economic analysis. | ||||||||
| Elliott et al.23 2009 | PNNL | Fast pyrolysis oil | 1 | 0.18–1.12 (optimum: 0.28) | Pd/C | 310–375 | 137.9 | 75.5/9.4/12.3 |
| 2 | 0.2 | Conventional sulfide hydrocracking catalyst | 405 | 103.4 | 86.6/12.9/0.4 | |||
| Howe et al.26 2015 | PNNL/INL/NREL | Different fast pyrolysis oils | 1 | ∼0.6a | Ru/C | 220 | 107 | |
| 2 | CoMo/Al2O3 | 400 | 107 | 85.3–87.52/11.99–12.94/0.66–1.08 | ||||
| Schwaiger et al.27 2015 | Graz, University of Technology/PNNL/BDI – BioEnergy International GmbH | Liquid phase pyrolysis oil | 1 | 0.2 | CoMo/Al2O3 | 400 | 121 | 83.94–84.41/14.77–15.22/0.68–0.96 |
| Dewatered liquid phase pyrolysis oil | 1 | 0.2 | CoMo/Al2O3 | 400 | 121 | 85.04–85.41/13.24–13.86/1.08–1.21 | ||
| Meyer et al.22 2016d | PNNL/INL | Fast pyrolysis oil | 1 | 0.5 | Ru-based | 140–180 | 83 | n.a. |
| 2 | 0.15 | Ru-based | 180–250 | 108 | ||||
| 3 | Sulfided Mo-based | 350–425 | 108 | Less than 2 wt% oxygen | ||||
| Yin et al.28 2016 | University of Groningen/BTG | Fast pyrolysis oil | 1 | 0.2–0.3b | Ni–Cu/SiO2–ZrO2 | 60–90 | 200 | n.a. |
| 2 | 150–200 | 200 | ||||||
| 3 | 410 | 200 | 3.1–15.9 wt% water | |||||
| Neumann et al.29 2016 | Fraunhofer UMSICHT | Catalytic pyrolysis oil | 1 | 0.6 | NiMo/Al2O3 | 230–370 | 140 | 86.2/13.0/<0.8 |
| Carpenter et al.21 2016 | NREL/INL/PNNL | Fast pyrolysis oil and blends | 1 | n.a. | Ru/C | 220 | 107 | |
| 2 | CoMo/Al2O3 | 400 | 107 | 87.7/12.6/1.08 | ||||
| Olarte et al.19 2016 | PNNL | Fast pyrolysis oil | 1 | 0.5c | Sulfided Ru/C | 140 | 84 | 55.3/6.2–6.3/38.1–38.2 |
| 2 | 0.1c | Sulfided Ru/C | 170 | n.a. | n.a. | |||
| 3 | Sulfided commercial HDO/HC | 402 | ||||||
| G. Kim et al.30 2017 | Korea University, etc. | Ether extracted pyrolysis oil | 1 | 0.4 | Pd/C | 100–190 | 100 | |
| 2 | Ru/WZr | 300–390 | 100 | 67.7–85.0/11.2–14.0/0.7–18.0 | ||||
| Olarte et al.24 2017 | PNNL/NREL | Fast pyrolysis oil | 1 | 0.5c | Ru/C | 140 | 82 | 56.9/6.7/36.3 |
| 2a | 0.27c | Ru/C and Pd/C | 170–405 | 135 | 81.9/12.3/5.9 | |||
| 2b | 0.22c | Sulfided Ru/C and commercial HT catalyst | 170–400 | 123 | 84.9/13.3/1.8 | |||
| I. Kim et al.31 2017 | Korea Institute of Science and Technology/KIST School Korea, etc. | Ether extracted pyrolysis oil | 1 | 0.2–2.3 | Various supported noble metal catalysts | 300–350 | 100 | 83.3/10.2/6.1 after 10.9–13.1 h TOS for Ru/WZr |
| Routray et al.32 2017 | University of Massachusetts | n.a. | 1 | ∼0.15a | Ru/C | 130 | 137.9 | |
| 2 | Pt/ZrP | 300–400 | ||||||
Often a two-step process is applied21,23,26,30,32 for pyrolysis oil HDO; in many cases, a 2 zone catalyst bed is applied in the second step.19,22,24,28 As Olarte et al.19 showed, single-step hydroprocessing of fast pyrolysis oil is very troublesome. They observed plugging with non-pre-treated fast pyrolysis oil after 48 h TOS at a space velocity of 0.1 h−1. This was also observed by Kim et al.31 who performed HDO experiments with a preceding extraction step to remove particles and most likely lignin components from pyrolysis oil. Although they managed to produce a product with a low oxygen content of 1.5 wt% for a 3 wt% Ru/WZr catalyst with a high LHSV of 2.3 h−1 after about 3 h TOS, they observed coke formation which led to rapidly decreasing product quality (6.1 wt% oxygen after 13.1 h TOS) and finally to plugging. Experiments at a LHSV of 2.3 h−1 had to be stopped after 5.7 to 14.2 h TOS.
Meyer et al.22 performed a techno-economic analysis of the hydrodeoxygenation of pyrolysis oil. They mentioned the high potential of the LHSV to significantly reduce the size of HDO reactors. Doubling the LHSV of the stabilizer from 0.5 to 1 h−1 would reduce the minimum fuel selling price by 2%, and increasing the LHSV in the first hydrotreater from 0.15 h−1 to 0.5 h−1 would decrease the minimum fuel selling price by 4%. This shows the necessity of high liquid hourly space velocities for industrial application.
Liquid phase pyrolysis oil has been examined before at a low liquid hourly space velocity of 0.2 h−1. This is the first time that LPP oil was hydrotreated at high space velocities of up to 3 h−1. Higher space velocities have not been reported yet.
Experimental
The following materials, analytical methods and experimental setup were used.Experimental setup
The experiments were performed in a plug flow reactor with an inner diameter of 3/8 inches and a heated zone of 12 inches, specified for 200 bar at 550 °C, with a maximum working pressure of 180 bar from Parr Instrument Company. The reactor was heated using a single zone external electric heater. The temperature was detected using an internal thermowell with a thermocouple with three probe points. The temperature could be controlled at four points: the three probe points of the inner thermowell and the heater. The reactor was fed from the top with gaseous and liquid reactants. The gas flow was controlled using a mass flow controller (Bronkhorst High-Tech B.V.) with a bypass valve for flushing the reactor in the start-up phase of experiments. The liquid feed was pumped through the reactor with a HPLC pump (Fink Chem + Tec GmbH). The pressure was regulated with a pressure regulating valve (Swagelok). A scheme of the whole setup is shown in Fig. 1.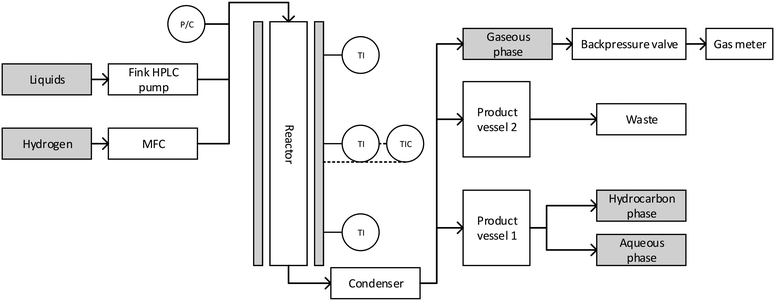 | ||
| Fig. 1 Scheme of the reactor setup: liquid and gaseous input, reactor, condenser and product vessels. | ||
Analytical methods
The ultimate analysis of all streams was performed using a vario MACRO CHN-analyzer from “Elementar Analysensysteme GmbH”. The water content of the aqueous product phase was determined using a gas-phase chromatograph, Agilent 7890A, with a TCD-detector and a HP-INNOWAX column, 30 m × 0.530 mm × 1 μm. To determine the water content, the GC was calibrated with high-purity water (type I) in THF in the range of 1 wt% to 8 wt% water. The boiling range of the hydrocarbon product phase was determined using a gas-phase chromatograph, Agilent 7890A, with a FID and a Restek-column MXT-2887, 10 m × 0.530 mm × 2.65 μm, according to ASTM Method D2887. The water content of the hydrocarbon product phase was determined by Karl-Fischer titration with a Schott TitroLine KF titrator and a Hydranal titration reagent. The carbon content of the aqueous phase was determined using a total organic carbon analyser, Shimadzu TOC-L. Density and viscosity were measured with a digital viscosimeter, SVM 3000, Anton Paar GmbH. The composition of the hydrocarbon product phase was determined by gas chromatography-MS with a quadrupole mass spectrometer (GC-MS), Shimadzu GCMS QP 2010 Plus, with a VF-1701 MS column, 60 m × 0.25 mm × 0.25 μm. The GC-MS was calibrated with a multi-component standard, consisting of pentane, 2-methylpentane, hexane, methylcyclohexane, ethylcyclopentane, octane, toluene, ethylcyclohexane, propylcyclohexane and decane, in the range of 100 ppmw to 3000 ppmw each.The composition of the gas phase was analysed using a micro gas-phase chromatograph, Agilent 3000A, with a TCD, a molecular sieve column and a plot u column. Additionally, a gas sample was analysed by ASG Analytik-Service Gesellschaft mbH according to DIN 5166.
Materials
HDO was performed with a sulfided CoMo/Al2O3 catalyst, details are shown in Table 2. This catalyst was chosen, as it is cheaper than noble metal catalysts, which are mostly used (Table 1), and not susceptible for catalyst poisoning by sulphur. For sulfidation, 35 wt% di-tert-butyldisulfide (DTBDS) in decane was used. Hydrogen 5.0 was provided in a 300 bar gas bomb from Air Liquide Austria GmbH.| Supplier | Alfa Aesar |
|---|---|
| Cobalt oxide [wt%] | 4.4 |
| Molybdenum oxide [wt%] | 11.9 |
| Surface area [m2 g−1] | 279 |
| Stock number | 45![[thin space (1/6-em)]](https://www.rsc.org/images/entities/char_2009.gif) 579 579 |
LPP oil from spruce wood pyrolysis at 375 °C was provided by the BDI – bioCRACK pilot plant. The LPP oil specification is shown in Table 3. The high water content of LPP oil is a huge advantage, as it lowers the reaction enthalpy and prohibits polymerization and coking reactions. It also allows the operation under refinery exercisable conditions.
| Property | Unit | LPP oil |
|---|---|---|
| Water content | [wt%] | 57.0 |
| Lower heating value | [MJ kg−1] | 7.4 |
| Density | [kg m−3] | 1092 |
| Viscosity | [mPa s] | 3.5 |
| Carbon content | [wt%] | 22.3 |
| Hydrogen content | [wt%] | 9.4 |
| Oxygen content (balance) | [wt%] | 67.8 |
| Nitrogen content | [wt%] | <1 |
Experimental procedure
For each experiment, the reactor was filled with the catalyst in an upside down position. The particle size in the heated zone was 200–600 μm. After installing the reactor, the whole reactor system was inerted with nitrogen and afterwards flushed with hydrogen, until reaching 120 bar. Then the reactor was filled with DTBDS in decane (35 wt%) at a flow rate of 3 ml min−1, and finally the flow rate was adjusted to 0.18 ml min−1. The temperature was increased with a heat ramp from 150 °C to 350 °C in 3 hours. When 400 °C was reached, the sulfidation of the catalyst started. After sulfidation, LPP oil was pumped into the reactor. HDO balance period began after 5 hours of lead time and experiments did then last 36 hours.The LHSV was varied between 0.5 h−1 and 3 h−1 with the following operating points: LHSV 0.5 h−1, 1 h−1, 2 h−1 and 3 h−1. HDO experiments at LHSVs between 0.5 h−1 to 2 h−1 were performed without irregularities, while at the LHSV of 3 h−1 an unstable operation mode was observed, indicated by pressure irregularities. Nevertheless, the HDO process could still be performed at the LHSV of 3 h−1.
Balancing
The experiment duration and mass balance period were 36 hours in steady state operation mode for LHSVs of 1 h−1, 2 h−1 and 3 h−1 and 60 hours for the LHSV of 0.5 h−1. Samples were taken every 12 hours. During the HDO of LPP oil, two liquid phases, a hydrocarbon and an aqueous phase, and a gas phase were formed.The lower heating value was determined using the Boie equation:33
| LHV(MJ kg−1) = 35·c + 94.3·h− 10.8·o + 10.4·s + 6.3·n − 2.44·w |
In this equation c, h, o, s, n and w represent carbon, hydrogen, oxygen, sulphur, nitrogen and water in wt%.
The oxygen content was assumed to be the difference to 100%:
| O[wt%] = 1 − C[wt%] − H[wt%] − N[wt%] |
Results
The impact of the LHSV on the experimental operation, product formation and product quality is discussed. In general, at higher LHSV the residence time is lowered.Temperature profile in the reactor
The LHSV had a major impact on the temperature profile in the reactor, as shown in Fig. 2. At LHSVs of 0.5 h−1 and 1 h−1, the temperature was adjusted to 400 °C at the middle probe point of the thermowell after 15 cm of the heated zone of the reactor. At LHSVs of 2 h−1 and 3 h−1, it wasn't possible to adjust the temperature to 400 °C at the middle probe point without exceeding 400 °C at the end of the reactor. Therefore the controlled probe point was the third one for those cases after 27 cm of the heated zone of the reactor.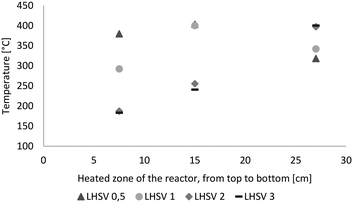 | ||
| Fig. 2 Temperature profile over the length of the heated zone of the reactor (from top to bottom) dependent on the LHSV [h−1]. | ||
Overall mass balance
The overall mass balance is shown in Table 4. Generally, there are no major differences in the mass balances between experiments with different throughputs. The yields of the hydrocarbon product phase and gaseous phase increased slightly with the throughput, whereas the amount of the aqueous phase fluctuated randomly in a small range. The balance inaccuracy was between 2.5 wt% and 5 wt%. 2.5 wt% was achieved at LHSVs of 2 h−1 and 3 h−1.| LHSV | 0.5 [h−1] | 1 [h−1] | 2 [h−1] | 3 [h−1] |
|---|---|---|---|---|
| LPP oil [wt%] | 79.6 | 78.3 | 78.8 | 78.3 |
| H2 [wt%] | 20.4 | 21.7 | 21.2 | 21.7 |
| Hydrocarbons [wt%] | 9.6 | 9.4 | 9.7 | 10.0 |
| Aqueous [wt%] | 57.6 | 56.5 | 58.5 | 57.9 |
| Gaseous [wt%] | 28.3 | 29.2 | 29.4 | 29.6 |
| Balance inaccuracy [wt%] | 4.5 | 5.0 | 2.5 | 2.5 |
Product characterization
The properties of the HDO product phase are very different compared with those of LPP oil. As shown in Table 5, they correlate well with those of diesel and gasoline. With increasing LHSV, the residence time decreases. This influences the chemical reaction. A lower residence time may result in an incomplete hydrodeoxygenation reaction and less cracking reactions. This is reflected in the H/C ratio and oxygen content of the product phase and the chain length of the cracked molecules. Products with a low H/C ratio and high oxygen content are less stable and have a lower heating value.| LPP oil | HDO LHSV 0.5 [h−1] | HDO LHSV 1 [h−1] | HDO LHSV 2 [h−1] | HDO LHSV 3 [h−1] | Diesel | Gasoline | ||
|---|---|---|---|---|---|---|---|---|
| a Diesel with HVO additives and gasoline without biogenous content. | ||||||||
| Water content | [wt%] | 57.0 | 0.03 | 0.01 | 0.11 | 0.16 | <0.02 (ref. 34) | n.a. |
| Lower heating value (Boie33) | [MJ kg−1] | 7.4 | 43.2 | 43.0 | 41.9 | 41.3 | 43.2 | 41.8 |
| Density | [kg m−3] | 1092 | 798 | 784 | 819 | 839 | 820–845 (ref. 34) | 720–775 (ref. 35) |
| Viscosity | [mPa s] | 3.5 | 1.0 | 0.9 | 1.3 | 1.6 | 2.0–4.5 (ref. 34) | n.a. |
| Carbon yield | [%] | — | 43.6 | 44.2 | 47.1 | 49.2 | — | — |
| H/C ratio | [—] | — | 1.89 | 1.92 | 1.80 | 1.72 | 1.89 | 1.53 |
| Carbon content | [wt%] | 22.3 | 86.5 | 85.6 | 85.5 | 85.1 | 86.3a | 88.7a |
| Hydrogen content | [wt%] | 9.4 | 13.7 | 13.8 | 12.9 | 12.3 | 13.7a | 11.4a |
| Balance (oxygen content) | [wt%] | 67.8 | 0.0 | 0.0 | 1.2 | 0.9 | 0.0a | 0.0a |
| Nitrogen content | [wt%] | <1 | <1 | <1 | <1 | <1 | <1a | <1a |
The water content of LPP oil was reduced from 57 wt% to below 0.2 wt% for all liquid hourly space velocities. According to the diesel standard, it has to be below 0.02 wt%. This was achieved by one-step HDO for the LHSV of 1 h−1 and almost for the LHSV of 0.5 h−1. The lower heating value of all products was increased from 7.4 MJ kg−1 (LPP oil) to beyond 40 MJ kg−1. The density of all products was between the standards for gasoline and diesel. It increased with the LHSV. This might be explained by the less cracking reaction occurring due to a lower residence time, resulting in a higher density. The viscosity was even below that of the diesel standard.
The carbon yield indicates the transfer of carbon from LPP oil into the hydrocarbon liquid phase. It was up to 50%. The carbon yield increased with the LHSV. This goes along with more impurities by oxygen-containing compounds, as the residence time was lower and HDO was not complete. In the hydrocarbon liquid phase, no oxygen could be found for LHSVs of 0.5 h−1 and 1 h−1.
Simulated distillation
Over a wide range, the boiling ranges of the hydrocarbon product phase were between those of diesel and gasoline, as shown in Fig. 3. Generally, the difference between products at different LHSVs was small. Except at the LHSV of 0.5 h−1, boiling ranges were shifted towards higher boiling points with increasing LHSV, and less cracking reactions seemed to occur.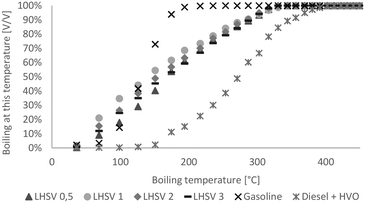 | ||
| Fig. 3 Boiling range of hydrocarbon product phases compared to diesel with HVO additives and gasoline without biogenous content. | ||
Rate of hydrodeoxygenation
The H/C ratio is used to characterize the rate of hydrogenation and the quality of fuel, provided that the O/C ratio is zero. As Table 5 shows, the H/C ratios of all HDO products were between 1.7 and 2 and therefore in the range of those of gasoline and diesel. Altogether, the H/C ratio was quite comparable to those at LHSVs of 0.5 h−1 to 2 h−1 for the first 36 hours; at LHSV 3 h−1 it was a bit lower with about 1.75. The highest H/C ratio was achieved at the LHSV of 1 h−1.The properties of the aqueous phase are used to characterize the effectiveness of hydrodeoxygenation. A low carbon content and therefore low loss of carbon are desirable. The carbon content of the aqueous phase increased with the LHSV and fluctuated over the experiment duration. For the LHSV of 3 h−1, the carbon content was about 1 wt% to 2 wt%, and at lower LHSVs the carbon content was below 1 wt%. In the experiment at the LHSV of 0.5 h−1, no carbon was detected at all. Different to the carbon content of the aqueous phase, the oxygen content of the hydrocarbon product phase shows the effectiveness of the deoxygenation step. Again, the oxygen content increased with the LHSV and fluctuated over the experiment duration. It correlated with the carbon content of the aqueous phase. For LHSVs of 0.5 h−1 and 1 h−1, no oxygen was detected. At LHSVs of 2 h−1 and 3 h−1, it fluctuated between 0.5 wt% and 1.5 wt%. The components in the HDO products were determined by GC-MS analysis. From GC-MS chromatograms, a shift towards lower boiling saturated molecules was observed. According to Fig. 4, the 10 most frequent components were mainly alkanes and cycloalkanes, amounting to about 10 wt% of the product phase. About 2.5 to 5 g kg−1 were allotted to toluene.
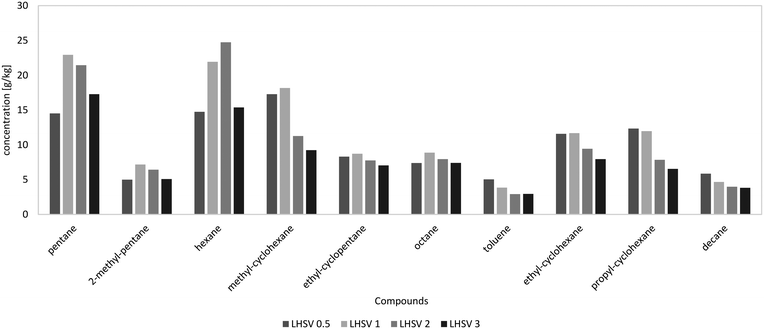 | ||
| Fig. 4 10 most frequent components in the hydrocarbon product phases dependent on LHSV [h−1] after 36 hours of experiment according to GC-MS analysis. | ||
GC-MS analysis also gives an insight into the reactions occurring during cracking and hydrogenation. Due to their structure, the reference molecules can be assigned to the 3 principal constituents lignin, cellulose and hemicellulose. In pyrolysis oil, the main components were: levoglucosan, 1-(4-hydroxy-3-methoxyphenyl)-2-propanone, 2-hydroxy-3-methyl-2-cyclopentenone, 1-hydroxy-2-butanone, 1-hydroxypropanone, acetic acid and methyl acetate. Cyclohexanes, such as methylcyclohexane, ethylcyclohexane and propylcyclohexane, are most likely to be derived from lignin derivatives, fractionated from the phenols–alcohols of lignin. Hexane can either be a hydrogenated lignin (phenols) or cellulose (glucose) derivative. pentane is a characteristic hemicellulose fragment, referring to the high amount of pentoses present in hemicellulose. 1-(4-Hydroxy-3-methoxyphenyl)-2-propanone might be the precursor for propyl cyclohexane, and guaiacol for cyclohexane. 2-Hydroxy-3-methyl-2-cyclopentenone and levoglucosan may seemingly convert to hexane. Alkanes of molar mass less than that of pentane were transferred into the gas phase (Fig. 5 and 6). Methane, ethane and carbon dioxide from decarboxylation reactions were partly generated by HDO of methyl acetate and acetic acid. 1-Hydroxypropanone and 1-hydroxy-2-butanone are likely to be converted into propane and butane, respectively.36–38
Despite these transfer routes, the fragments can be derived from higher molecular structures in wood, fractionated by cracking reactions during liquid phase pyrolysis. This also leads to the formation of C–C bonds during pyrolysis and molecules larger than the basic molecules present in wood.
Gas phase analysis
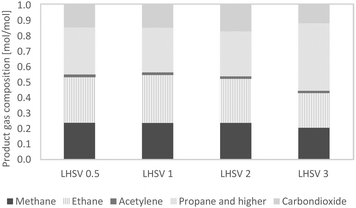
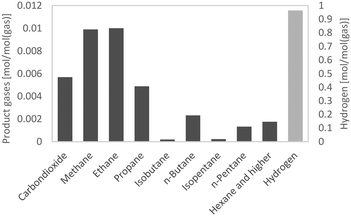
The gaseous products mainly contained the alkanes methane ethane, and higher alkanes. A small amount of acetylene was detected, and after 36 hours of experiment, the acetylene amount was close to zero. Up to 20% of the gas phase consisted of carbon dioxide, caused by decarboxylation reactions. Between LHSVs of 0.5 h−1 and 2 h−1, there is evidence of a trend towards less alkanes and more carbon dioxide, and at the LHSV of 3 h−1 less low-molecular mass alkanes (methane and ethane) and more alkanes, higher than ethane, were present. This indicates less cracking reactions.Due to the high excess of hydrogen, the gaseous phase was composed of about 95% hydrogen and 5% product gas. Through external analysis by ASG Analytik-Service GmbH, alkanes higher than ethane could be detected. These were mainly propane and n-butane, but the amount of each was much less than that of the smaller alkanes, as shown in Fig. 6. It was therefore assumed that the undefined residues of the gas phase are from the alkane fraction of propane and higher alkanes. The results of the two measurement modes didn't differ. The produced gas can be fed into cracking furnaces in petroleum refineries for the production of ethylene, e.g. with the PyroCrack®39 technology by Selas-Linde AG.
Product properties depending on catalyst stability over time
As already mentioned, the experiments were subdivided into 3 periods of 12 h for LHSVs of 1 h−1, 2 h−1 and 3 h−1 and 5 periods of 12 h for the LHSV of 0.5 h−1, as the sampling interval was 12 hours. Hence, trends over the experiment duration could be observed.In Fig. 7, the carbon yield over the experiment duration is shown. At the LHSV of 0.5 h−1, the carbon yield fluctuated slightly, whereas it increased at the LHSV of 1 h−1 and seemed to reach a plateau at LHSVs of 2 h−1 and 3 h−1 after 24 hours of experiment. This indicates a stable operation state.
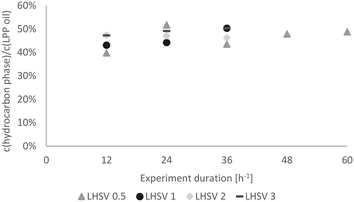 | ||
| Fig. 7 Carbon yield in the hydrocarbon product phase over the experiment duration dependent on the LHSV [h−1]. | ||
The same trend was observed concerning density (Fig. 8). While it increased at LHSVs of 0.5 h−1 and 1 h−1, a kind of plateau state was reached at higher LHSVs after 24 hours of experiment. Overall, the density was between the density of the gasoline and diesel standards.
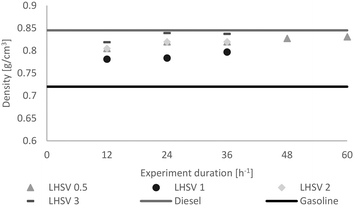 | ||
| Fig. 8 Distribution of the density of the hydrocarbon product phase dependent on the LHSV [h−1] compared to the minimum of gasoline and the maximum of diesel, according to EN228 (ref. 35) and EN590.34 | ||
In Fig. 9, the components of the product phase over the experiment duration at the LHSV of 1 h−1 are shown. It can be seen that the experiment duration had no influence on product distribution. A similar product distribution over time led to the conclusion that catalyst deactivation was negligible in the observed time span. A very stable operation mode was achieved.
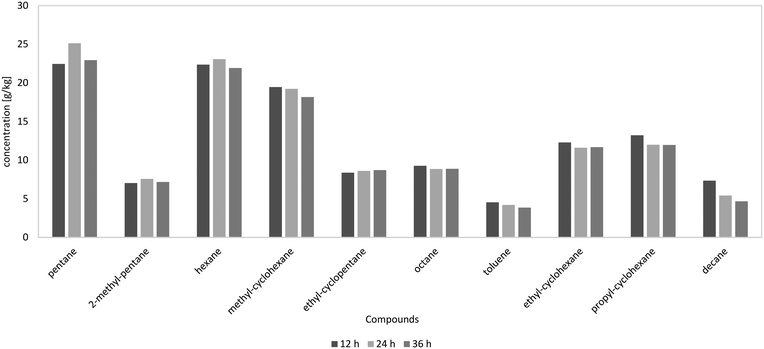 | ||
| Fig. 9 10 most frequent components in the HDO products depending on the experiment duration at the LHSV of 1 h−1, according to GC-MS analysis. | ||
The slow catalyst aging, only detectable as start-up effects at low liquid hourly space velocities, may be described by the LPP oil itself. In comparison with fast pyrolysis oils, usually used for hydrodeoxygenation processes,19–24,28,40 LPP oil has a very high water content, as many non-polar components were already extracted by VGO during the LPP step. As HDO is highly exothermic, the water may buffer the heat of reaction and inhibit catalyst overheating. Oh et al. investigated mild HDO of fast pyrolysis oil from Miscanthus sinensis with ethanol as a solvent in a stirred tank reactor at 250 °C to 350 °C. In experiments without ethanol, they observed a one phase product with a tar-like deposit on the catalyst. In experiments with ethanol, it served as a co-reactant, converting the acid in bio-oil into esters and enhancing acidity and stability.41 Feng et al. investigated the influence of different solvents such as water, alcohols, acetone, ethyl acetate, and tetrahydrofuran and hexane as a hydrocarbon representative on the hydrodeoxygenation of phenol. One interesting result was the high conversion of phenol into cyclohexanol of even 100% at 250 °C in water or hexane. They assumed a few positive effects of water on the HDO. Water may affect the absorption of phenol on the catalyst surface. Phenol itself is soluble in water, but the intermediate product cyclohexanone is not, so it cannot be easily dissolved in the solvent but is further hydrogenated to cyclohexanol, which is finally soluble in water. They also suggest that the binding energy between phenol and the metal surface is decreased due to the formation of hydrogen bonds between phenol and water.42 After the reaction to cyclohexanol, dissorption may occur. From these results, one can assume that coke formation is supressed in high water diluted HDO reaction systems, which leads to the fact that higher liquid hourly space velocities are feasible process parameters for LPP oil HDO.
Summary
HDO of LPP oil was operated continuously on a lab scale with liquid hourly space velocities of up to 3 h−1. The carbon yield was up to 50%. The rate of HDO was the highest at LHSVs of 0.5 h−1 and 1 h−1, resulting in an oxygen content of 0.0 wt% and a high H/C ratio close to 2. Diesel and gasoline qualities were achieved. All products correspond in terms of quality to a mixture of gasoline and diesel, concerning the density, which is between 720 kg m−3 (lower limit of gasoline) and 845 kg m−3 (upper limit of diesel), and boiling ranges. The hydrocarbon liquid products have high lower heating values of 41 MJ kg−1 to 43 MJ kg−1. At LHSVs of 2 h−1 and 3 h−1, a plateau of the H/C ratio was reached after 24 h of experiment. A steady state operation mode was achieved specifically at higher liquid hourly space velocities than reported in state-of-the-art HDO processes quoted in Table 1. At the LHSV of 3 h−1, unstable operation was observed, indicated by pressure irregularities. The higher the LHSV, the less cracking reactions occur, resulting in “long-chain” alkanes in the gas phase and higher boiling ranges. The GC-MS analysis showed a stable product yield which is dependent on the LHSV. Catalyst deactivation was very low, visible in almost constant product properties and composition. Thus, a positive influence of water in LPP oil on the coke deposition was stated.Conflicts of interest
There are no conflicts to declare.Acknowledgements
This work was funded by the Austrian Research Promotion Agency (FFG) under the scope of the Austrian Climate and Energy Fund. We want to acknowledge Thomas Pichler, Manuel Tandl, Anna Mauerhofer, Manuel Menapace, Dominik Heinrich, Elisabeth Dirninger, Thomas Sterniczky and Martin Dalvai Ragnoli for their outstanding work in our labs.Notes and references
- UNFCCC, Adoption of the Paris Agreement: Proposal by the President to the United Nations Framwork Convention on Climate Change, 2015, 21932, pp. 1–32 Search PubMed.
- P. L. Spath and D. C. Dayton, Preliminary Screening – Technical and Economic Assessment of Synthesis Gas to Fuels and Chemicals with Emphasis on the Potential for Biomass-Derived Syngas, Natl. Renew. Energy Lab., 2003, pp. 1–160 Search PubMed.
- S. Brethauer and C. E. Wyman, Bioresour. Technol., 2010, 101, 4862–4874 CrossRef CAS PubMed.
- M. Kaltschmitt and W. Streicher, Energie aus Biomasse, 2009 Search PubMed.
- N. Schwaiger, V. Witek, R. Feiner, H. Pucher, K. Zahel, A. Pieber, P. Pucher, E. Ahn, B. Chernev, H. Schroettner, P. Wilhelm and M. Siebenhofer, Bioresour. Technol., 2012, 124, 90–94 CrossRef CAS PubMed.
- N. Schwaiger, R. Feiner, K. Zahel, A. Pieber, V. Witek, P. Pucher, E. Ahn, P. Wilhelm, B. Chernev, H. Schröttner and M. Siebenhofer, BioEnergy Res., 2011, 4, 294–302 CrossRef.
- K. Treusch, J. Ritzberger, N. Schwaiger, P. Pucher and M. Siebenhofer, R. Soc. Open Sci., 2017, 4(11) DOI:10.1098/rsos.171122.
- J. Ritzberger, P. Pucher and N. Schwaiger, Chem. Eng. Trans., 2014, 39, 1189–1194 Search PubMed.
- Q. Zhang, J. Chang, T. Wang and Y. Xu, Energy Convers. Manage., 2007, 48, 87–92 CrossRef CAS.
- S. Müller, M. Stidl, T. Pröll, R. Rauch and H. Hofbauer, Biomass Convers. Biorefin., 2011, 55–61 CrossRef.
- R. Toonssen, N. Woudstra and A. H. M. Verkooijen, Int. J. Hydrogen Energy, 2008, 33(15), 4074–4082 CrossRef CAS.
- Y. Kalinci, A. Hepbasli and I. Dincer, Int. J. Hydrogen Energy, 2012, 37(19), 14026–14039 CrossRef CAS.
- S. Oh, H. S. Choi, I.-G. Choi and J. W. Choi, RSC Adv., 2017, 7, 15116–15126 RSC.
- S. Cheng, L. Wei, J. Julson, K. Muthukumarappan, P. R. Kharel and E. Boakye, Fuel Process. Technol., 2017, 162, 78–86 CrossRef CAS.
- F. De Miguel Mercader, P. J. J. Koehorst, H. J. Heeres, S. R. A. Kersten and J. A. Hogendoorn, AIChE J., 2011, 57, 3160–3170 CrossRef CAS.
- C. Boscagli, C. Yang, A. Welle, W. Wang, S. Behrens, K. Raffelt and J. D. Grunwaldt, Appl. Catal., A, 2017, 544, 161–172 CrossRef CAS.
- C. Boscagli, K. Raffelt and J. D. Grunwaldt, Biomass Bioenergy, 2017, 106, 63–73 CrossRef CAS.
- S. Cheng, L. Wei, J. Julson and M. Rabnawaz, Energy Convers. Manage., 2017, 150, 331–342 CrossRef CAS.
- M. V. Olarte, A. H. Zacher, A. B. Padmaperuma, S. D. Burton, H. M. Job, T. L. Lemmon, M. S. Swita, L. J. Rotness, G. N. Neuenschwander, J. G. Frye and D. C. Elliott, Top. Catal., 2016, 59, 55–64 CrossRef CAS.
- D. C. Elliott, Energy Fuels, 2007, 21, 1792–1815 CrossRef CAS.
- D. Carpenter, T. Westover, D. Howe, S. Deutch, A. Starace, R. Emerson, S. Hernandez, D. Santosa, C. Lukins and I. Kutnyakov, Biomass Bioenergy, 2016, 96, 142–151 CrossRef.
- P. A. Meyer, L. J. Snowden-Swan, K. G. Rappé, S. B. Jones, T. L. Westover and K. G. Cafferty, Energy Fuels, 2016, 30, 9427–9439 CrossRef CAS.
- D. C. Elliott, T. R. Hart, G. G. Neuenschwander, L. J. Rotness and A. H. Zacher, Environ. Prog. Sustainable Energy, 2009, 28, 441–449 CrossRef CAS.
- M. V. Olarte, A. B. Padmaperuma, J. R. Ferrell, E. D. Christensen, R. T. Hallen, R. B. Lucke, S. D. Burton, T. L. Lemmon, M. S. Swita, G. Fioroni, D. C. Elliott and C. Drennan, Fuel, 2017, 620–630 CrossRef CAS.
- M. A. Fahim, T. A. Alsahhaf and A. Elkilani, in Fundamentals of Petroleum Refining, 2010, pp. 153–198 Search PubMed.
- D. Howe, T. Westover, D. Carpenter, D. Santosa, R. Emerson, S. Deutch, A. Starace, I. Kutnyakov and C. Lukins, Energy Fuels, 2015, 29, 3188–3197 CrossRef CAS.
- N. Schwaiger, D. C. Elliott, J. Ritzberger, H. Wang, P. Pucher and M. Siebenhofer, Green Chem., 2015, 17, 2487–2494 RSC.
- W. Yin, A. Kloekhorst, R. H. Venderbosch, M. V. Bykova, S. A. Khromova, V. A. Yakovlev and H. J. Heeres, Catal. Sci. Technol., 2016, 6, 5899–5915 CAS.
- J. Neumann, N. Jäger, A. Apfelbacher, R. Daschner, S. Binder and A. Hornung, Biomass Bioenergy, 2016, 89, 91–97 CrossRef CAS.
- G. Kim, J. Seo, J. W. Choi, J. Jae, J. M. Ha, D. J. Suh, K. Y. Lee, J. K. Jeon and J. K. Kim, Catal. Today, 2017, 0–1 Search PubMed.
- I. Kim, A. A. Dwiatmoko, J. W. Choi, D. J. Suh, J. Jae, J. M. Ha and J. K. Kim, J. Ind. Eng. Chem., 2017, 56, 74–81 CrossRef CAS.
- K. Routray, K. J. Barnett and G. W. Huber, Energy Technol., 2017, 5, 80–93 CrossRef CAS.
- K.-H. Grote and J. Feldhusen, Dubbel Taschenbuch für Maschinenbau, Springer, 22nd edn, 2007 Search PubMed.
- EN590, 2004 Search PubMed.
- EN228, 2004 Search PubMed.
- F. X. Collard and J. Blin, Renewable Sustainable Energy Rev., 2014, 38, 594–608 CrossRef CAS.
- T. Lin, E. Goos and U. Riedel, Fuel Process. Technol., 2013, 115, 246–253 CrossRef CAS.
- Y. Le, L. Jia, S. Cissé, G. Mauviel, N. Brosse and A. Dufour, J. Anal. Appl. Pyrolysis, 2016, 117, 334–346 CrossRef.
- http://www.linde-engineering.com/en/process_plants/furnaces_fired_heaters_incinerators_and_t-thermal/cracking_furnaces_for_ethylene_production/index.html, 2017.
- D. C. Elliott and E. G. Baker, Process for upgrading Biomass pyrolyzates, U.S. Pat., 4795841, 1989, p. 7 Search PubMed.
- S. Oh, H. Hwang, H. S. Choi and J. W. Choi, Fuel, 2015, 153, 535–543 CrossRef CAS.
- G. Feng, Z. Liu, P. Chen and H. Lou, RSC Adv., 2014, 4, 49924–49929 RSC.
| This journal is © The Royal Society of Chemistry 2018 |

