 Open Access Article
From batch to continuous: Au-catalysed oxidation of D-galacturonic acid in a packed bed plug flow reactor under alkaline conditions†
F.
van der Klis
ab,
L.
Gootjes
b,
J.
van Haveren
b,
D. S.
van Es
 *b and
J. H.
Bitter
 *a
*a
aWageningen University Biobased Chemistry and Technology, Bornse Weilanden 9, 6708 WG Wageningen, The Netherlands. E-mail: harry.bitter@wur.nl; Tel: +31 317 480 303
bWageningen Food & Biobased Research, Bornse Weilanden 9, 6708 WG Wageningen, The Netherlands. E-mail: daan.vanes@wur.nl; Tel: +31 317 481 160
First published on 18th June 2018
Abstract
Currently biomass based conversions are often performed in batch reactors. From an operational and economic point of view the use of a continuous plug flow reactor is preferred. Here we make a back to back comparison of the use of a batch and plug flow reactor for the oxidation of (sodium)-galacturonate to (disodium)-galactarate using a heterogeneous Au-catalyst. We will show that the use of a three phase plug flow reactor results in enhanced O2 mass transfer which resulted in a 10–40 fold increase in productivity (up to 2.2 ton m−3 h−1). However, the product selectivity slightly dropped from >99 mol% in batch (controlled pH) to 94 mol% in packed bed (uncontrolled pH). Both reactors suffer from the low solubility of the reaction product. We will show that this solubility is the most significant challenge for performing this oxidation on industrial scale.
1 Introduction
Carbohydrates are an abundantly available feedstock for the production of a plethora of renewable chemicals.1 One of the most promising groups of chemicals can be obtained by the oxidation of aldoses to their corresponding sugar (di)acids, which are useful sequestering agents, corrosion inhibitors, chelation agents, pH-regulators, and polymer building blocks.2–5 In recent years, the commercial production of these biobased sugar acids, including glucaric acid (Rivertop Renewables) and gluconic acid (Fuso Chemical Co., Ltd) has increased, showing the relevance of these materials for many applications.6,7The oxidation of carbohydrates can, among other methods, be performed selectively by using supported gold-catalysts.8 These Au-catalysts are highly stable, and operate under mild conditions (low temperatures and pressures), in aqueous environment, using molecular oxygen or air as the sole green oxidant. These green oxidations are most often performed in batch reactors.9 For a recent overview on the catalytic oxidation of carbohydrates, the review by Zhang & Huber is recommended for further reading.10
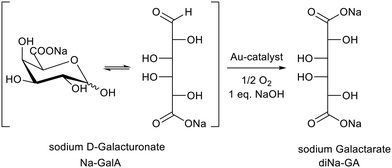
We also investigated batch reactions for the oxidation of carbohydrate feedstocks like sugar beet pulp derived D-galacturonic acid (GalA) to galactaric acid (GA), by using supported Au-catalysts (Scheme 1).11,12 Although the conversion of this 2nd generation feedstock proceeds selectively, the oxidation to GA has some additional challenges compared to more “simple” aldose sugars such as D-glucose: GA is barely soluble in cold water,13,14 and has a limited solubility in its Na-form (see this investigation). This results in cumbersome product/catalyst separations in batch mode at higher product concentrations (≳0.2 M). Furthermore, the productivity (space time yield) has not been optimized, limiting the commercial scale-up potential of the process.
Therefore, to bring the oxidation to an industrial level, the key reaction parameters that influence the oxidation efficiency need to be investigated in more depth for the batch system, but there is also an aim to develop a continuous process, which might overcome the technical challenges encountered in batch mode.
For continuous oxidation processes, various reactor designs can be considered. So far, others explored the continuous (noble–metal) catalysed oxidation of carbohydrates in the following setups: the oxidation of glucose over Au/Al2O3 was studied in a CSTR (slurry reactor).15,16 Carbon- and alumina-supported platinum group metal catalysts (pellets),17 as well as Au/Al2O3-monoliths,18 were used for glucose oxidations in counter current trickle columns. Pt–Au/C, Pt–Bi/C and Pt/C electrodes were compared for direct glucose electrochemical oxidation in a fuel cell set-up, both in batch and in continuous flow.19 For Au-catalysed reactions, the only plug flow packed bed oxidation reported is the oxidative esterification of methacrolein to methyl methacrylate in methanol.20 To the best of our knowledge, the plug flow packed bed oxidation of carbohydrates has not been reported for gold catalysts.
The general benefits of plug flow packed bed reactors are low operational costs, high selectivity, possibility to reach full conversion, low catalyst consumption, high productivity, and the possibility of working at high product concentration.21,22 These benefits make this reactor type an attractive option to reach an industrial viable oxidation process. However, theory also teaches that acid/base consumption, the formation of insoluble products, and the consumption of gas (three phase system) are in principle undesired for PFR reactors.21,22
All of the above mentioned concerns for plug flow reactors apply to the oxidation of GalA to GA: the first concern is that the oxidation produces an acid, which needs to be neutralized. The reaction rate of the Au-catalysed oxidation is known to be pH-dependent, so, the uncontrolled and thus changing pH along the reactor is expected to affect the rate (and potentially the selectivity).23 As previously stated, the low solubility of the desired GA (both in acid form and as the di-sodium salt), is a second concern which might result in clogging of the reactor system. The third concern is the consumption of oxygen gas during the reaction, which is not ideal to operate in three phase plug flow (oxygen availability will vary depending on position in column). However, gas – liquid reactions are known to be successfully applied in plug flow packed bed reactors under reductive atmosphere (hydrogen): e.g. the hydrogenolysis of glucose to glycols,24 and the reduction of glucose to sugar alcohols.25
To summarize, there are various potential concerns to choosing a plug flow fixed bed reactor for this reaction. However, if these issues can be solved, this reactor type might also bring additional benefits, such as increased space time yields. Therefore, the aim of this research is to identify whether a packed bed plug flow reactor could be a suitable setup for the Au-catalysed continuous oxidation of D-galacturonic acid, and to compare this option with a batch process. Special attention in this comparison is paid to the pH control, solubility/clogging, and oxygen supply, since these are expected to be the most crucial parameters.
2 Results and discussion
2.1 Batch reactions
The aim in this part of the investigation, focussing on batch reactions, is not only to study the influence of the individual reaction parameters, but also to obtain the necessary input needed for the plug flow fixed bed reactor. The influence of combined pH/temperature effects on conversion and selectivity is easier to study in batch, but provides valuable information for the fixed bed reactor as well (temperature settings and amount of base to be added). The solubility of the (diNa)-GA has not yet been reported, but this information is critical for both types of reactors: in batch it might lead to difficulties in product/catalyst separations, and in the plug flow fixed bed reactor it might lead to blockage of the system.| Entry | pH | Temp (°C) | Selective conv. (>99%) | Included in kinetic calculation | k (mol L−1 h−1) |
|---|---|---|---|---|---|
| 1 | 9 | 24 | Yes | Yes | 1.42 |
| 2 | 9 | 40 | Yes | Yes | 3.82 |
| 3 | 9 | 50 | Yes | Yes | 6.04 |
| 4 | 10 | 23 | Yes | Yes | 3.48 |
| 5 | 10 | 39 | Yes | Yes | 6.98 |
| 6 | 10 | 50 | Yes | Yes | 11.34 |
| 7 | 10 | 60 | No | No | — |
| 8 | 12 | 20 | Yes | No | — |
| 9 | 12 | 40 | No | No | — |
| 10 | 12 | 50 | No | No | — |
Since the pH has a profound effect on the rate and selectivity of the reaction, further improvement of the batch reaction is anticipated under controlled pH. It was therefore decided to perform a (limited) kinetic study on the oxidation of Na-GalA to diNa-GA under pH-stat conditions. The obtained information in these batch experiments will also provide the necessary initial input for the consecutive planned fixed bed experiments with regard to temperature, pH and contact time.
Prior to the kinetic study, the experimental set-up was optimized (see ESI† for a detailed description). Next, experiments were performed using the optimized experimental setup (O2-flow 300 mL min−1, mechanical stirring at 650 rpm). The pH and temperature were varied, and the reaction rates were determined. An overview of the experiments performed is shown in Table 1. To make sure the activities observed are solely attributed to the desired reaction, the total base consumption was monitored, and consecutive HPLC measurements were performed to confirm the selectivity of the reactions. The selectivity is also reported in Table 1.
For the calculation, only selective reactions were included to calculate the apparent activation energies. For pH 9 and pH 10, three reaction temperatures resulted in selective conversions (Table 1, entries 1–6), so these data could be used to calculate the Arrhenius plots. However, at pH 12 only one temperature gave a selective conversion, so the Arrhenius plot for pH 12 could not be constructed. The results are visualized in Fig. 1.
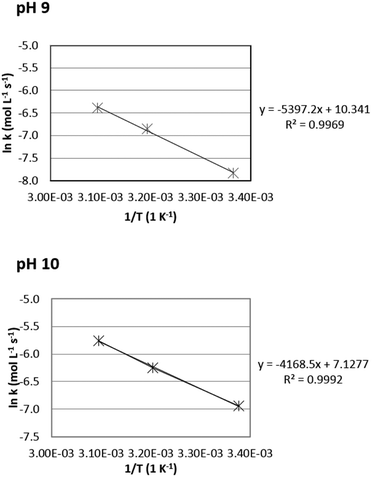 | ||
| Fig. 1 Arrhenius plots for the oxidation of Na-GalA to diNa-GA over 1 wt% Au/TiO2 (top = pH 9, bottom = pH 10). | ||
Based on the Arrhenius plots, the apparent activation energies were found to be 44.8 kJ mol−1 at pH 9, and 34.6 kJ mol−1 at pH 10, which is slightly higher compared to previously reported activation energies for glucuronic acid oxidation to glucaric acid over Au/Al2O3: 45.3 kJ mol−1 at pH 8, 26.5 kJ mol−1 at pH 9, and 24.6 kJ mol−1 at pH 10.27 [Note: the observed apparent activation energies are likely to be underestimated due to mass transfer limitations].28
This part of the investigation in batch mode teaches that the pH has a profound influence on the activation energy and selectivity of the reaction. Therefore, the clear advantage of working in batch mode, is that pH and temperature can be controlled to assure high productivity and selectivity throughout the course of the reaction. In a packed bed reactor, the pH cannot be easily controlled at every position in the column, and as a result the pH will change due to the formation of the acid that is formed during oxidation. Therefore the activation energy (activity and selectivity), will be different (and less optimized) depending on the position of the substrate in the catalyst bed.
First, a saturated suspension of GA (free acid) was stirred at 23 °C for 20 h, followed by filtration, dilution, and determining the dissolved GA concentration by HPLC. As expected, the solubility of the free acid was very low: 2.3 mM ≙ 0.48 g L−1.
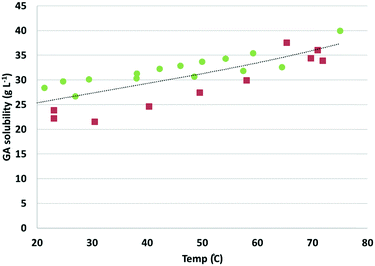
Next, a suspension of GA in water was adjusted to pH 7 using sodium hydroxide (2 M), and the resulting suspension was slowly heated from room RT to 75 °C (in approximately 1 h). Note: the choice for pH 7 is based on the expected pH value after complete oxidation of Na-GalA to diNa-GA in the presence of 1 eq. base. Higher excess of base might (positively) influence the solubility, but is undesired with respect to salt formation. Samples were taken at different temperatures during heat-up, followed by quick filtration and dilution, prior to HPLC measurements to determine the concentration of dissolved sodium-galactarate. Next, the suspension was allowed to slowly cool to room temperature, and again samples were taken at various temperatures. Fig. 2 shows the dissolved sodium-galactarate concentration as a function of temperature.
As can be observed in Fig. 2, the solubility of sodium-galactarate increased as a function of temperature from about 25 g L−1 at 25 °C to about 33 g L−1 at 60 °C. However, there was quite a large difference between the solubility measured during heat up (red squares in Fig. 2, lower solubility), and cool down (green dots in Fig. 2, higher solubility). This indicates that the dissolution and/or crystallisation might be slow processes. If this process is indeed slow, it might imply that reactions can be performed above the solubility limit, without clogging of the system.
A second experiment was therefore executed in which a fresh suspension of GA was neutralized to pH 7, at a constant temperature of 40 °C, and the concentration of dissolved sodium-galactarate was now followed as a function of time while keeping the temperature constant. The results are visualized in Fig. 3.
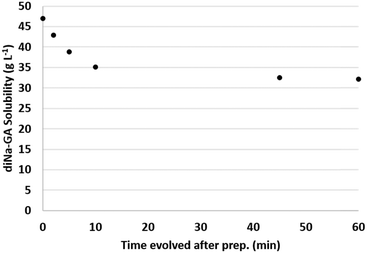 | ||
| Fig. 3 Solubility of diNa-GA (pH 7, 40 °C) as a function of time after preparation of the fresh suspension. | ||
The initial concentration of dissolved sodium-galactarate was 47 g L−1 directly after preparation of the suspension, and dropped to 35 g L−1 after 10 min. After 45–60 min the solubility stabilized to about 32 g L−1. These results confirm that indeed the crystallization is a slow process, which explains the previously observed differences in measurements during heat-up and cool down (Fig. 2).
The results on the (diNa)-GA solubility have various implications for both the batch and the continuous reactor set-up. First of all, galactaric acid has a very low solubility in acid form, which can be increased by converting it into the sodium salt. So, to keep the product in solution, increased pH has a clear benefit compared to working under acidic pH. As a consequence, working at elevated pH, acid/base consumption leads to salt production (cost/waste).
The second thing we can learn from these experiments, is that the maximum concentration that can be achieved in batch (assuming hot filtration at 60 °C) is about 33 g L−1, without product precipitation. Since it was found that crystallisation is a slow process, this might imply that a slightly higher concentration can be reached in a continuous system, if the product can be flushed out of the reactor, before crystallization can take place.
First, the experimental set-up was optimized (see ESI†), followed by in situ measurements of the dissolved oxygen concentration during the oxidation of GalA using two different supported Au-catalysts (1 wt% Au/TiO2 and 1 wt% Au/C) under identical conditions. The experiment was performed according to the standard reaction protocol described in the ESI.† The choice to include 1 wt% Au/C next to the commercial 1 wt% Au/TiO2 is based on the excellent performance of Au/C in our previous work.26
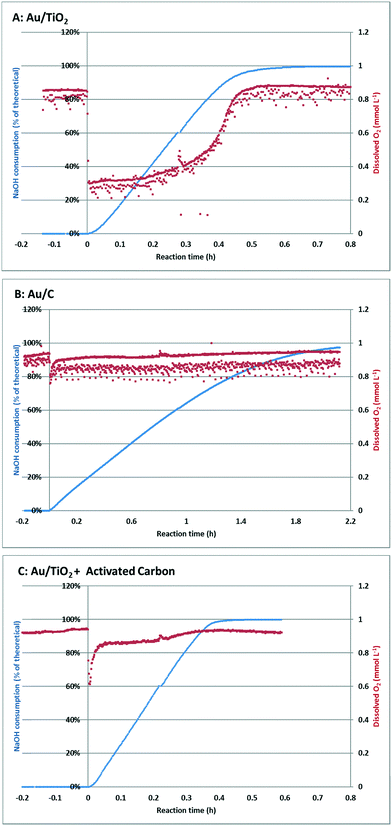
Fig. 4 shows an overview of the online measurements that were performed. The blue lines represent the consumption of sodium hydroxide, which at full selectivity is directly proportional to the conversion of the substrate (left axis). This full selectivity was confirmed after reaction by ex situ HPLC measurements. On the right axis, the red lines represent the dissolved oxygen concentrations.
Introduction of the Au/TiO2 catalyst to the pre-heated, stirred, and oxygen saturated Na-GalA solution, marks the starting time of the reaction (Fig. 4A, t = 0 h). This introduction of the catalyst resulted in an instantaneous and steep decrease of the dissolved oxygen concentration from the saturated value (0.9 mmol L−1 at t < 0 h) to approximately 0.3 mmol L−1. At the same time NaOH consumption started, indicating the conversion of substrate. The dissolved oxygen concentration remained low throughout the linear part of the conversion curve (up to about 80% conversion), after which the dissolved oxygen started to recover, and finally reached the saturation value after the reaction was almost complete.
Although the reaction mixture was thoroughly mixed (500 rpm overhead stirrer) and aerated using a fine diffusor at high oxygen flow (300 mL min−1), apparently the oxygen supply from the gas phase to the liquid phase was insufficient to replenish the oxygen consumed. Previous calculations23 proved that glucose oxidations become oxygen mass transfer limited when the dissolved oxygen drops below 50% of the saturation value. Since the dissolved oxygen level dropped to ∼30%, the Au/TiO2 oxidation of Na-GalA is likely to be oxygen mass transfer limited under the applied conditions.
Next, an identical experiment was performed, this time using a Au/C catalyst. Again, the catalyst was introduced to the pre-heated, stirred, and oxygen saturated Na-GalA solution, which marks the starting time of the reaction (Fig. 4B, t = 0 h). Introduction of the catalyst resulted in an instantaneous but less steep decrease of the dissolved oxygen concentration from the saturated value (0.9 mmol L−1 at t < 0 h) to approximately 0.8 mmol L−1. At the same time NaOH consumption started, indicating the conversion of substrate. In contrast to the reactions with Au/TiO2 (Fig. 4A), the dissolved oxygen concentration almost instantly recovered to the initial saturation level, and remained constant throughout the whole reaction. Since the level of dissolved oxygen remained well above 50% of the initial saturation level, it can be concluded that the Au/C oxidation of Na-GalA is most likely not oxygen mass transfer limited under the applied conditions.
The differences in the drop in dissolved oxygen between the Au/TiO2 and the Au/C can be explained in two ways: first, since the reaction with Au/C proceeds slower, the oxygen demand per time unit is lower (mmol O2 min−1). Therefore, there might be enough time to replenish the used dissolved oxygen, resulting in a lower drop. Second, the support of the catalyst might play a role in bringing the oxygen from the gas phase to the aqueous phase. This second explanation is actually supported by literature: Alper et al.31 postulated that “a simple transport mechanism, in which a solid particle may move right into the concentration boundary, adsorb gas for some time there, and then may go back into the depths of liquid to desorb gas. In this way, the transfer of gas will be facilitated”. This effect was later confirmed by others,32–34 and is mostly influenced by the particle size and surface area of the suspended particles, which is in line with the observed difference for Au/TiO2 (low BET surface area ∼40 m2 g−1) and Au/C (high BET surface area ∼1000 m2 g−1).35
The potential effect of increased gas–liquid transfer by carbon was investigated in a third experiment, in which the Au/TiO2 catalysed oxidation was repeated, but with the addition of the same amount of activated carbon. The results of this experiment are shown in Fig. 4C.
At t = 0 h, the Au/TiO2 catalyst and activated carbon were simultaneously introduced to the reactor. This time the drop in oxygen was less steep compared to Au/TiO2 alone (from 0.9 mmol L−1 at t = 0 to 0.6 mmol L−1 for Au/TiO2 + activated carbon; compared to a drop from 0.9 mmol L−1 to 0.3 mmol L−1, for Au/TiO2 alone). Furthermore, the dissolved oxygen concentration recovered much faster, and reached a higher level (0.85 mmol L−1) in the linear part of the conversion curve.
These results indicate that addition of activated carbon can keep the oxidation of Na-GalA using Au/TiO2 outside of the regime in which the reaction becomes oxygen limited. This is also indicated by the increased reaction rate (time to reach 99% conversion = 0.59 h for Au/TiO2; Au/TiO2 + activated carbon = 0.41 h). A summary comparing the performances for the three catalysts used in a batch reactor can be found in Table 2: the highest catalytic activity (mmol min−1 g−1 Au) was found for Au/TiO2 in the presence of activated carbon (207 mmol min−1 g−1 Au), compared to 163 mmol min−1 g−1 Au for Au/TiO2 without activated carbon. This also results in the highest space time yield obtained in the batch reactor: 4.6 mmol min−1 L−1versus 3.6 mmol min−1 L−1 for Au/TiO2 alone.
| Reactor | Catalyst | Conditions Na-GalA conc. (M) | Temp. (°C) | Oxygen (mL min−1) | Pressure (bar) | pH control/base | Performance catalyst activity (mmol min−1 g−1 Au) | Space time yield (mmol min−1 L−1) |
|---|---|---|---|---|---|---|---|---|
| a Reactor intake 250 mL. b Flow rate 10 mL min−1. c Calculated for reaction rate at 50% conversion. d Continuous operation was only possible for short reaction time, since the reactor started to block due to the formation of insoluble material. | ||||||||
| Batch | Au/TiO2 | 0.1a | 50 | 300 | 1 | pH 9 | 163c | 3.6 |
| Batch | Au/C | 0.1a | 50 | 300 | 1 | pH 9 | 50c | 1.1 |
| Batch | Au/TiO2 + AC | 0.1a | 50 | 300 | 1 | pH 9 | 207c | 4.6 |
| Cont. | Au/TiO2 | 0.1b | 60 | 50 | 10 | Eq. (pH 13) | 13 | 36 |
| Cont.d | Au/TiO2 | 0.5b | 60 | 50 | 10 | 2 eq. (pH 13.5) | 61 | 175 |
Although the performance of our home-made Au/C catalyst is lower compared to the commercial Au/TiO2, (catalyst activity 50 mmol min−1 g−1 Au, and a space time yield of 1.1 mmol min−1 L−1), more active Au/C catalysts could be developed (this lies outside the scope of the current manuscript). Therefore, in selecting a suitable catalyst for the batch oxidation of carbohydrates, Au/C should certainly be considered, and might be preferred over (low surface area) metal oxide supports. Working in a pressurized system is also advised, to increase the driving force for gas diffusion.
2.2 Continuous plug flow reactions
In batch mode, the two catalyst types investigated (Au/TiO2 and Au/C) were both studied in powder form (slurry). In coming part of the investigation, we are moving from a batch reactor to a plug flow set-up, for which powders are unsuitable (i.e. due to the large pressure drop) and larger particles are required. Since from the two catalysts studied only the Au/TiO2 is commercially available in granular form, we limited ourselves in this part of the investigation to this catalyst for the plug flow set-up.In laboratory scale plug flow fixed bed reactions, on column pH control is not easy, so direct addition of an equimolar amount of base is required. This implies that the initial pH of the reaction mixture at the start of the column can be highly alkaline, and directly depends on the concentration of substrate intake: for example a 0.1 M Na-GalA solution needs 0.1 M excess of NaOH, which results in a solution of pH ∼13. However, the contact time in plug flow fixed bed reactions is much shorter compared to batch reactions (under our conditions approximately 1.3 min., see ESI† for calculations), and the pH will drop as soon as the acidic product starts to form.
The initial investigation (over Au/TiO2) was started by preparing a 0.2 M solution of GalA, and a separate solution of 0.4 M NaOH. Both solutions were fed to the reactor at the same liquid flow rates (5 mL min−1). So, the mixed feed entering the top of the reactor had a flow rate of 10 mL min−1, and a concentration of 0.1 M Na-GalA and 1 equivalent excess NaOH to compensate for the production of the acid functionality in the diNa-GA product at 100% conversion.
The substrate flow rate entering the reactor was 1 mmol min−1, the reaction temperature was set at 60 °C, the oxygen flow rate at 50 mL min−1 ≙ 2.2 mmol O2 min−1, and the total system pressure was set at 10 bar. The oxygen flow rate was limited to 50 mL min−1, while for the batch experiments the optimal flow rate was 300 mL min−1. However, a flow rate of 50 mL min−1 under 10 bar pressure, already results in 5 mL min−1 gas phase (compared to the liquid flow rate of 10 mL min−1). If the same gas flow rate would have been used as in the batch experiments, this would increase from 5 to 30 mL min−1, which would significantly reduce the contact time. The temperature of 60 °C was chosen based on the best results in batch (although at controlled pH).
When the mixture was fed to the reactor, it was noticed that the temperature initially increased from 60 °C to about 80 °C, indicating an exothermic reaction. Based on literature calculations, the estimated energy for the exothermic Na-GalA oxidation is expected to be in the order of ∼1.3 kJ g−1, not taking into account the energy for the formation of the sodium carboxylate(s).36 The reactor was therefore allowed to stabilize (adjust heating input), and sample collection was started after the reactor reached a stable temperature of 60 °C for 50 min. In the next 50 min, 5 × 100 mL samples were collected for analysis by HPLC. All samples were clear (almost colourless) solutions, which were still alkaline.
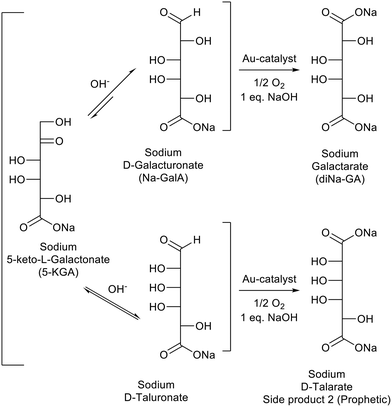
Fig. 5 shows a representative HPLC chromatogram (UV-210 detector). The largest peak is the desired diNa-GA (80 mol% yield, based on calibration), at almost full conversion (remaining Na-GalA ≪1%). Next to the desired product, two main side products can be observed. Since the exact nature of the compounds is unknown, quantification is not possible. However a comparison can be made based on area: side product 1 has an area of ∼5% in UV (only 1% area in RI), and side product 2 has an area of 10% in UV (8% area in RI). Based on our previous work,12 side product 1 is expected to be a chain scission product (over oxidation). Side product 2 might result from the alkaline isomerisation of GalA to 5-keto-L-galactonic acid (5-KGA, present in trace amount, as confirmed by comparison with an authentic sample),37 followed by isomerizing to D-taluronic acid,38 and subsequent oxidation to D-talaric acid (also known as D-altraric acid or D-talomucic acid, not commercially available for identification).39 The proposed reaction cascade towards this prophetic side product is shown in Scheme 2.
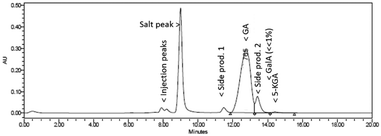 | ||
| Fig. 5 Representative HPLC chromatogram (UV-210) of the oxidation of 0.1 M Na-GalA to diNa-GA over Au/TiO2 by mixing NaOH and GalA solutions with two separate pumps. | ||
It was expected that the exothermic reaction, due to the acid–base reaction at the top of the column, was significantly contributing to the proposed isomerisation, and subsequent formation of side product 2. [Although identification falls outside the scope of the current investigation, some more background information & experiments directed to the identification of talaric acid are provided in the ESI†]. Therefore, in a separate experiment, a pre-mixed solution of 0.1 M Na-GalA and 1 eq. excess NaOH was prepared at room temperature (pH 13). This solution was fed to the reactor at a feeding rate of 10 mL min−1 (thus 1 mmol min−1), the other settings were identical to the previous experiment.
During this experiment, when the carbohydrate solution was fed to the reactor, only a slight increase of the temperature from 60 °C to about 65 °C was observed. This indicates that most of the heat released in the previous experiment was indeed due to the acid–base reaction. Again, the reactor was allowed to stabilize, and HPLC samples were collected after the reactor reached a stable temperature of 60 °C for 50 min. All samples were clear (almost colourless) solutions, this time with a close to neutral pH.
HPLC analysis (Fig. 6) revealed that the conversion of Na-GalA was again almost complete (>97%, based on calibration), but this time the reaction was more selective towards diNa-GA (found 91 mol% diNa-GA, selectivity to diNa-GA = 94%). Again, next to starting material and desired product, three side products (including 5-KGA) were present, but at much lower concentrations.
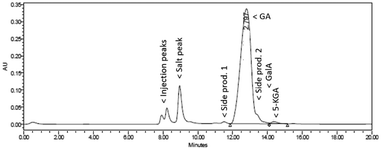 | ||
| Fig. 6 Representative HPLC chromatogram (UV-210) of the oxidation of 0.1 M Na-GalA to diNa-GA over Au/TiO2 by feeding a pre-mixed 0.1 M Na-GalA solution with 1 eq. excess NaOH. | ||
These results indicate that the combination of high temperatures and high pH should be avoided, as was already observed during batch experiments. However, even at the relatively short contact times (1.3 min.) in the fixed bed reactor, isomerisation seems to play a significant role, indicating that this reaction is a fast process. Therefore, to achieve a selective reaction in plug flow, the oxidation reaction should proceed fast, thereby lowering the pH and time for the undesired isomerisation.
When the reactor was switched from demineralized water to the 0.5 M Na-GalA solution, an increase of the reactor temperature from 60 to 72 °C was observed. This is higher compared to the reactions at 0.1 M Na-GalA concentration, indicating a higher conversion rate. The reactor was allowed to stabilize to 60 °C, and within the 50 min stabilization time, no significant changes in pressure build up were noticed, which could be attributed to potential clogging of the reactor system. However, after the first samples for HPLC analysis were collected (1 h reaction time), the reactor started to block, as was noticed by pressure build-up. The reaction was therefore stopped by switching to demineralized water again, after which the reactor unclogged.
Based on HPLC analysis (Fig. 7), the conversion was 94%, with a slightly reduced selectivity for the 0.5 M Na-GalA solution compared to the 0.1 M solution. However, the productivity of the reaction significantly increased: the catalytic activity increased from 13 mmol min−1 g−1 Au for 0.1 M Na-GalA to 61 mmol min−1 g−1 Au for 0.5 M Na-GalA (Table 2). The increase in activity can be explained by the higher substrate concentration in the bulk, leading to a higher driving force for substrate to diffuse to the catalyst surface. The increased catalytic activity also has a tremendous effect on the space time yield, which increased from 36 mmol min−1 L−1 for 0.1 M to 175 mmol min−1 L−1 for 0.5 M.
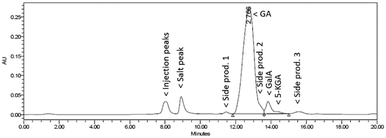 | ||
| Fig. 7 Representative HPLC chromatogram (UV-210) of the oxidation of 0.5 M Na-GalA to diNa-GA over Au/TiO2 by feeding a pre-mixed 0.5 M Na-GalA solution with 1 eq. excess NaOH. | ||
It was noticed that large amounts of solid material (sodium-galactarate) had deposited in the collected liquid samples. Therefore, the samples were combined, and acidic work-up gave 62.4 g GA (free acid) as a white solid (85% of theory, see experimental section for procedure). The purity of the collected GA (free acid) was >99%, as was confirmed by NMR, HPLC, FTIR and elemental analysis (see ESI†).
![[thin space (1/6-em)]](https://www.rsc.org/images/entities/char_2009.gif) :
:![[thin space (1/6-em)]](https://www.rsc.org/images/entities/char_2009.gif) 2.2 molar ratio of Na-GalA
2.2 molar ratio of Na-GalA![[thin space (1/6-em)]](https://www.rsc.org/images/entities/char_2009.gif) :
:![[thin space (1/6-em)]](https://www.rsc.org/images/entities/char_2009.gif) O2 was fed into the reactor. When the reactor was running on pure demineralized water (no expected oxygen consumption), the expel of oxygen gas was indeed close to the feed rate (∼50 mL min−1). When 1 mmol min−1 Na-GalA was fed to the reactor, indeed the oxygen venting was reduced to <40 mL min−1, corresponding to the expected ∼0.5 mmol min−1 consumption/1 mmol min−1 Na-GalA, needed for complete oxidation.
O2 was fed into the reactor. When the reactor was running on pure demineralized water (no expected oxygen consumption), the expel of oxygen gas was indeed close to the feed rate (∼50 mL min−1). When 1 mmol min−1 Na-GalA was fed to the reactor, indeed the oxygen venting was reduced to <40 mL min−1, corresponding to the expected ∼0.5 mmol min−1 consumption/1 mmol min−1 Na-GalA, needed for complete oxidation.
Although oxygen transfer limitations might occur in the fixed bed reactor, the system has the advantage of working under increased system pressure (10 bar), and consequently higher oxygen solubility, leading to an increased driving force for gas–liquid mass transfer. This is a benefit compared to a non-pressurized batch reactor, for which we proved that the reaction was limited in oxygen supply.
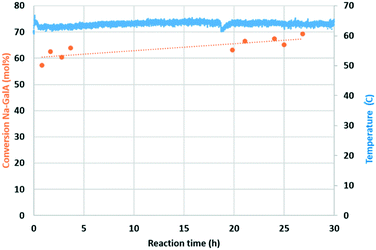
Over the course of the reaction (27 h), an average conversion of 64% was achieved. There were no signs of catalyst deactivation, on the contrary, a slight (but gradual) increase in conversion was observed. In the 27 h of monitored reaction time, a total amount of 1.037 mol Na-GalA was converted over 1.015 × 10⁻⁴ mol bulk Au, resulting in a turn over number (TONbulk Au) of 10![[thin space (1/6-em)]](https://www.rsc.org/images/entities/char_2009.gif) 213 without any signs of catalyst deactivation. The gold loading of the spent catalyst was analysed by elemental analysis, and a small loss in Au-loading was observed (fresh: 1.14% Au; spent 1.00% Au, see ESI†). The gold loss can be used to calculate the catalyst consumption: 72
213 without any signs of catalyst deactivation. The gold loading of the spent catalyst was analysed by elemental analysis, and a small loss in Au-loading was observed (fresh: 1.14% Au; spent 1.00% Au, see ESI†). The gold loss can be used to calculate the catalyst consumption: 72![[thin space (1/6-em)]](https://www.rsc.org/images/entities/char_2009.gif) 950 moles of product were produced per mol of leached/consumed gold. These results indicate the excellent performance and stability of the Au/TiO2 catalyst under the applied conditions, although longer term stability tests are required.
950 moles of product were produced per mol of leached/consumed gold. These results indicate the excellent performance and stability of the Au/TiO2 catalyst under the applied conditions, although longer term stability tests are required.
2.3 Comparison of batch vs. continuous plug flow reactions
Although both the batch and fixed bed plug flow reactions might be further optimized, a first comparison can now be made to identify the bottle necks of each set-up. Lange published a perspective article in which a set of performance criteria are described which are critical for viable industrial operation.40 These performance criteria are: 1) selectivity (related to feed stock price/product loss/ purification cost); 2) productivity (or activity, related to catalyst activity/conversion/feed rates); 3) catalyst consumption (related to catalyst activity and lifetime); and 4) product concentration (related to heat exchange/process cost).Table 3 shows an overview of these performance criteria, and the “industrial performance window” which should be met to reach industrial operation. For the batch process and the continuous fixed bed plug flow reactor, preliminary calculations were performed to determine the current industrial viability, and identify the bottle necks for each system.
| Performance criteria | Industrial performance window | Batch reactor | Cont. packed bed reactor |
|---|---|---|---|
| a Consumption of active metal, estimation based on literature.16 b Consumption of active metal, based on measurement of gold loading spent catalyst. | |||
| Selectivity | 70–100 wt% | >99% | >80–94% |
| Productivity | 0.1–10 tprod. m−3 h−1 | 0.06 | 0.5–2.2 |
| Cat. consumption | 1–100 tprod. kgcat−1 | 4200a | ∼78b |
| Prod. conc. | 3–100 wt% | ∼2–3.3 | ∼2–<10 |
With respect to the first performance criterion, “selectivity”, both set-ups display selectivity's exceeding the min. 70 wt% industrial performance window, with the highest selectivity (>99%) achieved in batch under controlled pH. It is expected that a further increase in selectivity for the fixed bed reactor can be reached with further optimisation (e.g. by finding an optimum in the base concentration and temperature). Alternatively, to keep the base concentration constant along the reactor, gradual feeding of base along the reactor can be considered.
The next performance criterion is “productivity”, which is currently below the industrial operation window for the batch reactor, but already in the right range for the fix bed reactor. The relatively low productivity in batch is mainly related to the low catalyst concentration in the reactor (compared to fixed bed), and the mass transfer limitations (gas–liquid) already observed at these currently low catalyst concentrations. Therefore further increase of the catalyst concentration will not solve the main issue, which is bringing oxygen from the gas phase to the liquid phase. Hence, for the batch system, emphasis should be put on further research in optimizing the gas–liquid transfer, which might allow higher catalyst concentrations and thus higher productivity. Working in a pressurized system might also be preferred to increase the gas diffusion, and the benefits of working with high surface area supports like activated carbon should be considered.
The third performance criterion “catalyst consumption”, was briefly investigated by running a stable reaction for 27 h without any signs of catalyst deactivation. Nevertheless some Au-leaching has been observed. The observed current catalyst consumption (mol product/mol leached gold) of 72![[thin space (1/6-em)]](https://www.rsc.org/images/entities/char_2009.gif) 950 corresponding to 78 ton product/kg leached gold. At this stage it is unclear if the leaching is just the initial loss of loosely bound gold particles, or a gradual loss. Others already investigated the Au-leaching and catalyst stability in CSTR mode, and calculated that the catalyst consumption during glucose oxidation was as low as 1 mg Au/4.2 kg of product.16 It can therefore be assumed that the catalyst consumption is not a critical factor for viable industrial operation.
950 corresponding to 78 ton product/kg leached gold. At this stage it is unclear if the leaching is just the initial loss of loosely bound gold particles, or a gradual loss. Others already investigated the Au-leaching and catalyst stability in CSTR mode, and calculated that the catalyst consumption during glucose oxidation was as low as 1 mg Au/4.2 kg of product.16 It can therefore be assumed that the catalyst consumption is not a critical factor for viable industrial operation.
The fourth and last performance criterion is “product concentration”. For both systems this seems to be by far the most challenging issue. The low solubility of Na-galactarate causes precipitation of product in batch mode, leading to potential catalyst deactivation by blocking of active sides, and it also leads to difficulties in catalyst/product separations. In fixed bed plug flow operation, at combined high feed concentrations and conversions, product deposition above the solubility limits has shown to lead to blocking of the system. The focus of future research should therefore be on finding potential solutions to this problem.
To summarize, compared to the batch reactor, the performance criteria for the fixed bed plug flow reactor are in the better range for viable industrial operation. Especially when taking into account that galactaric acid has to be considered as a specialty chemical, which allows for higher production costs compared to bulk chemicals. The batch reactor shows a significantly lower reactor productivity, but on the other hand displays the highest selectivity to galactaric acid.
3 Experimental
The experimental set-ups, experimental procedures, and all analyses can be found in the ESI.†4 Conclusions
The Au-catalysed oxidation of D-galacturonic acid to galactaric acid under alkaline conditions was investigated in a batch and in a plug flow packed bed reactor. Both systems were evaluated to investigate their industrial viability.The batch system displayed the highest selectivity (>99%) and catalyst activity (207 mmol min−1 g−1 Au) at controlled pH (optimal selectivity/activity around pH 9–10). However, as a result of the lower catalyst concentration in batch, and observed mass transfer limitations (mainly gas–liquid), the productivity of the reactor (0.06 tprod. m−3 h−1) is currently below the desired industrial operation window. Future research on the batch oxidation should therefore focus on increasing the gas - liquid transfer, for which we found that the use of high surface area catalyst supports might play an important role. The use of a pressurized system should also be considered.
A fixed bed plug flow reactor was used for the first time in the Au-catalysed carbohydrate oxidation under alkaline conditions. Despite common belief, the system displayed a relatively high selectivity (94%) under the uncontrolled pH, indicating that plug flow reactors could be viable set-ups for oxidations in which acidic products are formed. The maximum observed catalyst activity (61 mmol min−1 g−1 Au) is lower compared to the batch system, but due to the higher catalyst loading inside the reactor, the productivity of the system (0.5–2.2 tprod. m−3 h−1) meets the required industrial window of operation.
The main challenge, for both batch and fixed bed plug flow reactions, is the low solubility of the (sodium) galactarate product, leading to dilute feed/product streams, currently below the desired window for industrial operation. Future research is therefore needed to find practical solutions to avoid undesired product precipitation.
Conflicts of interest
There are no conflicts to declare.Acknowledgements
This research is part of a project that has received funding from the Bio Based Industries Joint Undertaking under the European Union's Horizon 2020 research and innovation programme under grant agreement No 669105. This research was also co-financed by TKI-funding from the Topconsortia for Knowledge & Innovation (TKI's) of the Ministry of Economic Affairs in The Netherlands, and the companies Royal Cosun, RefrescoGerber, Arkema, and North Seaweed. The authors would like to thank Amelia Palacios Martinez for her contribution to the batch experiments, David Franciolus for assisting with the HPLC analysis, Guus Frissen for NMR measurements, Royal Cosun for supplying galacturonic acid, and Johnson Matthey for fruitful discussions on the use of Au-catalysts in the plug flow reactor.References
- T. Werpy and G. Petersen, Top Value Added Chemicals from Biomass: Volume I - Results of Screening for Potential Candidates from Sugars and Synthesis Gas, U.S. Department of Energy, 2004 Search PubMed.
- S. N. Bolotin, V. Y. Frolov, A. I. Shestavin, A. I. Oflidi, D. V. Kolechko and V. T. Panyushkin, Russ. J. Inorg. Chem., 2007, 52, 1211–1214 CrossRef.
- T. Mehtiö, M. Toivari, M. G. Wiebe, A. Harlin, M. Penttilä and A. Koivula, Crit. Rev. Biotechnol., 2016, 36, 904–916 CrossRef PubMed.
- M. Saladini, E. Ferrari and L. Menabue, J. Inorg. Biochem., 2002, 92, 121–127 CrossRef PubMed.
- M. Saladini, L. Menabue and E. Ferrari, Carbohydr. Res., 2001, 336, 55–61 CrossRef PubMed.
- Rivertop Renewables, http://www.rivertop.com/, Accessed 2018-01-22, 2018 Search PubMed.
- Fuso Chemical Co., Ltd., http://www.fusokk.co.jp/eng/index.html, Accessed 2018-01-22 Search PubMed.
- C. Della Pina and E. Falletta, Catal. Sci. Technol., 2011, 1, 1564–1571 RSC.
- N. Thielecke and U. Prüße, Chem. Ing. Tech., 2007, 79, 1456–1457 CrossRef.
- Z. Zhang and G. W. Huber, Chem. Soc. Rev., 2018, 47, 1351–1390 RSC.
- R. K. Pazhavelikkakath Purushothaman, F. van der Klis, A. E. Frissen, J. van Haveren, A. Mayoral, A. van der Bent and D. S. van Es, Green Chem., 2018 10.1039/C8GC00103K.
- F. van der Klis, A. E. Frissen, J. van Haveren and D. S. van Es, ChemSusChem, 2013, 6, 1640–1645 CrossRef PubMed.
- G. A. Jeffrey and R. A. Wood, Carbohydr. Res., 1982, 108, 205–211 CrossRef.
- W. H. Kent and B. Tollens, Justus Liebigs Ann. Chem., 1885, 227, 221–232 CrossRef.
- N. Thielecke, M. Aytemir and U. Prüße, Catal. Today, 2007, 121, 115–120 CrossRef.
- N. Thielecke, K.-D. Vorlop and U. Prüße, Catal. Today, 2007, 122, 266–269 CrossRef.
- G. J. K. Acres and A. E. R. Budd, Catalytic oxidation of glucose, GB1208101, 1970 Search PubMed.
- B. Gaweł, K. Gaweł, T. C. Hobæk, M. Yasuda and G. Øye, Mater. Chem. Phys., 2012, 137, 414–420 CrossRef.
- D. Basu, S. Sood and S. Basu, Chem. Eng. J., 2013, 228, 867–870 CrossRef.
- S. Krill, A. Lygin, T. Balduf, R. Burghardt, A. Tepperis and M. Groemping, Method for producing unsaturated esters from aldehydes by direct oxidative esterification, 2015, WO2015091018 Search PubMed.
- R. J. Davis, in Catalysis for the Conversion of Biomass and its Derivatives, ed. M. Behrens and A. K. Datye, Max Planck Research Library for the History and Development of Knowledge, Berlin, 2013, pp. 255–291 Search PubMed.
- J. M. Woodley and M. D. Lilly, in Applied Biocatalysis, ed. A. J. J. Straathof and P. Adlercreutz, Harwood, Amsterdam, Neth., 2nd edn, 2000, pp. 371–394 Search PubMed.
- U. Prüße, S. Heidinger and C. Baatz, Landbauforschung - vTI Agriculture and Forestry Research, 2011, 3, 261–272 Search PubMed.
- D. E. Holcomb, Catalyst and method for production of polyols by hydrogenolysis of carbohydrates, US20070293665, 2007 Search PubMed.
- G. M. Lari, O. G. Gröninger, Q. Li, C. Mondelli, N. López and J. Pérez-Ramírez, ChemSusChem, 2016, 9, 3407–3418 CrossRef PubMed.
- R. K. Pazhavelikkakath Purushothaman, F. van der Klis, A. E. Frissen, J. van Haveren, A. Mayoral, A. van der Bent and D. S. van Es, Green Chem., 2018 10.1039/C8GC00103K.
- S. Rautiainen, P. Lehtinen, J. Chen, M. Vehkamaki, K. Niemela, M. Leskela and T. Repo, RSC Adv., 2015, 5, 19502–19507 RSC.
- H. S. Fogler, in Prentice Hall PTR international series in the physical and chemical engineering sciences, Prentice Hall PTR, Upper Saddle River, NJ, 2006, pp. 833–842 Search PubMed.
- U. Prüße, K. Heidkamp, N. Decker, M. Herrmann and K. D. Vorlop, Chem. Ing. Tech., 2010, 82, 1231–1237 CrossRef.
- U. Prüße, M. Herrmann, C. Baatz and N. Decker, Appl. Catal., A, 2011, 406, 89–93 CrossRef.
- E. Alper, B. Wichtendahl and W. D. Deckwer, Chem. Eng. Sci., 1980, 35, 217–222 CrossRef.
- J. B. Lefers, W. T. Koetsier and W. P. M. Van Swaaij, Chem. Eng. J., 1978, 15, 111–120 CrossRef.
- J. V. Littlejohns and A. J. Daugulis, Chem. Eng. J., 2007, 129, 67–74 CrossRef.
- J. T. Tinge and A. A. H. Drinkenburg, Chem. Eng. Sci., 1995, 50, 937–942 CrossRef.
- Z. Li, D. Wu, Y. Liang, F. Xu and R. Fu, Nanoscale, 2013, 5, 10824–10828 RSC.
- M. Vasiliu, K. Guynn and D. A. Dixon, J. Phys. Chem. C, 2011, 115, 15686–15702 CrossRef.
- F. van der Klis, J. van Haveren, D. S. van Es and J. H. Bitter, ChemSusChem, 2017, 10, 1460–1468 CrossRef PubMed.
- I. R. Siddiqui and C. B. Purves, Can. J. Chem., 1963, 41, 382–386 CrossRef.
- M. Takenaka, X. Yan, H. Ono, M. Yoshida, T. Nagata and T. Nakanishi, J. Agric. Food Chem., 2003, 51, 793–796 CrossRef PubMed.
- J.-P. Lange, Catal. Sci. Technol., 2016, 4759–4767 RSC.
Footnote |
| † Electronic supplementary information (ESI) available. See DOI: 10.1039/c8re00047f |
| This journal is © The Royal Society of Chemistry 2018 |

