 Open Access Article
Effect of ion migration in electro-generated chemiluminescence depending on the luminophore types and operating conditions†
Sangbaie
Shin
a,
Yun Sung
Park
 b,
Sunghwan
Cho
c,
Insang
You
a,
In Seok
Kang
b,
Hong Chul
Moon
b,
Sunghwan
Cho
c,
Insang
You
a,
In Seok
Kang
b,
Hong Chul
Moon
 *d and
Unyong
Jeong
 *a
*a
aDepartment of Materials Science and Engineering, Pohang University of Science, Pohang 37673, Korea. E-mail: ujeong@postech.ac.kr
bDepartment of Chemical Engineering, Pohang University of Science, Pohang 37673, Korea
cDepartment of Materials Science Engineering, Yonsei University, Seoul, 03722, Korea
dDepartment of Chemical Engineering, University of Seoul, Seoul 02504, Korea. E-mail: hcmoon@uos.ac.kr
First published on 26th January 2018
Abstract
Electro-generated chemiluminescence (ECL) has attracted increasing attention as a new platform for light-emitting devices; in particular, the use of mechanically stretchable ECL gels opens up the opportunity to achieve deformable displays. The movements of radical ions under an external electric field include short-range diffusion near the electrodes and long-distance migration between the electrodes. So far, only the diffusion of radical ions has been considered as the operating principle behind ECL. In this study, electrochemical and optical analysis was performed systematically to investigate the role of ion migration in ECL devices. This study reveals that long-distance migration of radical ions can be a key variable in ECL at low frequencies and that this effect depends on the type of ion species and the operating conditions (e.g. voltage and frequency). We also report that the emissions from the two electrodes are not identical, and the emission behaviors are different in the optimal operating conditions for the red, green, and blue ECL emissions.
Introduction
Electro-generated chemiluminescence (ECL) refers to light emission via electrochemical reactions of a luminophore (A) near an electrode surface.1–7 Upon the application of alternating current (AC), oxidized and reduced radical ions are generated at the electrodes. When the concentration profiles of these two species encounter each other, thermodynamically spontaneous electron transfer reactions occur, resulting in the production of excited-state luminophores (A*). This ECL process corresponds to the annihilation pathway. A remarkable feature of an ECL display is its simple device structure, which is composed of only a light-emitting layer between the top and bottom electrodes without the electron and hole transporting layers. Furthermore, ECL displays do not require careful adjustment of the work function between the light-emitting layer and the electrodes.8 They are less sensitive to moisture compared to organic light-emitting diodes.9 Several variants of ECL displays have been demonstrated. Solid-type ECL devices have a long response time due to the relatively slow ion mobility.10–13 Solution-type ECL devices face issues such as solvent evaporation and material leakage.14–18 On the other hand, gel-type ECL devices address such problems and have additional advantages such as mechanical flexibility and stretchability.8,19–22 Therefore, gel-type ECL displays have been of great interest as simple deformable next-generation displays.The conventional concept of diffusion-dominant electrochemistry makes a lot of electrolyte systems tractable – particularly when aspects of the reactivity of the ECL luminophores are under study. However, this simplified concept sometimes fails to clearly explain experimental observations. In the absence of convective flow, the mass transport of an ion species can arise because of an electrochemical potential gradient formed over a given distance. The concentration gradient of the ion typically causes short-distance diffusion and the electrochemical potential gradient induces long-distance movement (electro-migration).23 The conventional concept behind ECL devices assumes that the long-distance movement of the electro-active ion can be neglected in the presence of excess supporting electrolytes. This assumption is based on the calculation stating that the number of long-distance migrating ions contributing to the current is negligible compared to the number of diffusive active ions contributing to the current.3 However, the concept decoupling the diffusion current from the migration current is not scientifically reasonable because each ion is influenced by a combined electrochemical potential caused by the concentration gradient and the electric potential gradient. The electric field may enhance the directional linear diffusion, which would then increase the linear velocity of the ions.
In addition, the dynamic electric field (i.e., AC voltage) induces unsteady-state mass transfer, which is different from the steady-state assumption in the conventional calculation of the current contribution. Moreover, when the ion concentration is very high (such as in solvent-free electrolyte systems), the potential gradient in the bulk electrolyte is not zero. The remaining electric potential remains in the system even after the EDLs are formed. Therefore, the effect of an external electric field should be taken into consideration in the principle of ECL devices, especially when the concentrations of the radical ions are high and the thickness of the emission layer is very small, which is typical in ECL displays.
In this paper, we systematically investigated the mass transport of electro-active species in gel electrolytes and the related emission mechanisms using experiments and simulations. The dependence of the device performance on the applied voltage and frequency was also examined. Because practical displays require the emission of red (R), green (G), and blue (B) light, we determined the optimal conditions of RGB emissions on the basis of the working mechanisms.
Results and discussion
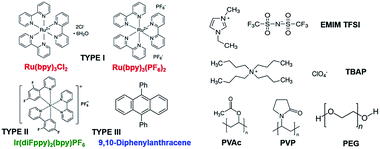
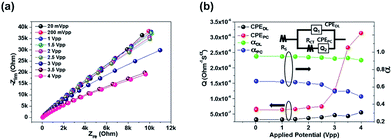
The chemical structures of the materials used in this study are shown in Fig. 1. We categorized the luminophores into three types according to the radical ion formed by the redox reactions: generating A˙3+ and A˙+ from A2+ (Ru(bpy)3Cl2 and Ru(bpy)3(PF6)2, type I), A˙2+ and A˙ from A1+ (Ir(diFppy)2(bpy)PF6, type II), and A˙+ and A˙− from A0 (DPA, type III). Each type shows different long-distance movement behavior of the radical ions: all ions move toward the same direction (type I), oxidized and initial ions move toward the same direction, but the reduced ions are not affected (type II), and the radical ions move toward opposite directions but the initial molecules are not affected (type III). Thus, the emission behaviors should be understood according to the type of luminophore.The impact of the long-distance migration in the ECL device under an electric field was investigated using electrochemical impedance spectroscopy (EIS) and light emission decay of the ECL devices. Fig. 2a presents Nyquist plots for the ECL gel, including Ru(bpy)3Cl2. The other Nyquist plots for the Ru(bpy)3(PF6)2, Ir(diFppy)2(bpy)PF6, and DPA gels are provided in the ESI (Fig. S1a–c†). The gels were sandwiched between two indium-tin-oxide (ITO)-coated glasses with a 60 μm-thick spacer. An imperfect capacitance model with equivalent circuits containing constant phase elements (CPEs) can be used to characterize the behaviors.24,25
The equivalent circuit model is depicted in the inset of Fig. 2b. The model includes CPEs in parallel for the interface between the electrode and electrolyte (constant phase element of the double layer CPEDL = QDL(iω)αDL) and that between the electrode and the redox species (pseudocapacitance element, CPEPC = QPC(iω)αPC). The model is expressed as:
 | (1) |
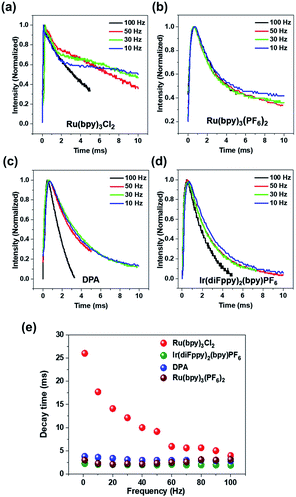
Fig. 3a–d shows the transient emission profiles in a top–bottom electrode setup. The Ru(bpy)3Cl2 gel (Fig. 3a) was sandwiched between two identical ITO electrodes and an operating voltage of 5.0 Vpp was applied. The light intensity profiles from the Ru(bpy)3Cl2 gel at low frequencies (50 Hz) had a shoulder at ∼2.0 ms after a potential was applied. The shoulder became more prominent at a lower frequency (30 Hz). Fig. 3b compares the transient emission profiles of the Ru(bpy)3(PF6)2 gel under identical conditions. In contrast to the Ru(bpy)3Cl2 gel, the emission profile of the Ru(bpy)3(PF6)2 gel did not have a shoulder at 30 Hz and a small shoulder peak appeared at 10 Hz. The transient emission profiles of the Ir(diFppy)2(bpy)PF6 and DPA gels did not show any shoulder even at lower frequencies (Fig. 3c and d). Fig. 3e summarizes the frequency dependence of decay times. The Ru(bpy)3Cl2 gel showed a continuous increase in decay time (2 ms at 100 Hz to 25 ms at 1 Hz) as the frequency decreased, but the decay time of the other gels remained constant as the frequency decreased.
The relatively longer decay time of the Ru(bpy)3Cl2 gel at low frequencies suggests that the annihilation process occurs not only due to the ECL luminophores being located near the electrode but also due to the luminophores moving a long distance. In contrast, the decay times of the gels containing the other luminophores were frequency-independent, which implies that the long-distance movement is not effective and light emission takes place mainly among the radical ions near the electrodes. Note that the frequency-independence of the light decay does not exclude the possibility of the long-distance movement. The contribution of the long-distance movement may increase with a higher ion velocity under a stronger electric field. Because the Ru(bpy)3Cl2 and Ru(bpy)3(PF6)2 gels have identical compositions and cations, the differences in the decay times and EIS results may originate from the mobility difference. The heavier counter ions (PF6−) in Ru(bpy)3(PF6)2 decrease the mobility of the cations,10 so light emission takes place mainly in the diffusive region under operational conditions. The appearance of the shoulder peak at 10 Hz for the Ru(bpy)3(PF6)2 gel implies that the long-distance movement becomes effective due to the longer time available for movement.
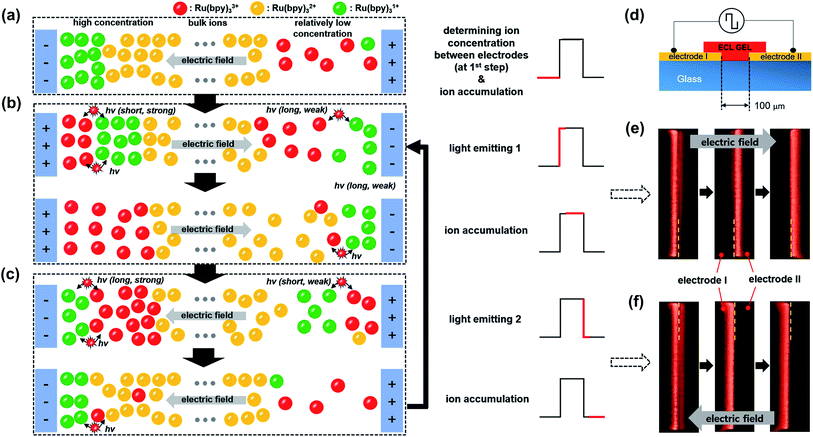
Fig. 4a–c illustrates the effect of the long-distance movement in the Ru(bpy)3Cl2 gel on the annihilation process. Ru(bpy)32+ should be uniformly distributed in the gel before the application of an external voltage. When the applied potential is high enough to generate a large amount of radical ions, the Ru(bpy)32+ ions are converted to Ru(bpy)3˙1+ at the negative electrode (cathode) and to Ru(bpy)3˙3+ at the positive electrode (anode) (Fig. 4a). The cationic Ru(bpy)32+ accumulates at the cathode, resulting in a higher concentration of Ru(bpy)3˙1+ than Ru(bpy)3˙3+ at the anode. When the voltage direction is switched (Fig. 4b), a large amount of Ru(bpy)3˙3+ is generated at the anode and quickly reacts with the pre-formed Ru(bpy)3˙1+, from which strong but short-term luminescence is observed. On the other hand, the remaining excess Ru(bpy)3˙3+ ions are distributed toward the bulk because of the electric field and the electrostatic repulsion from the anode. Although a lower concentration of Ru(bpy)3˙1+ ions is produced at the cathode, the conversion from the approaching Ru(bpy)32+ to Ru(bpy)3˙1+ proceeds continuously. Accordingly, the emission at the cathode is weak, but remains longer, as long as the Ru(bpy)3˙3+ ions are fed from the bulk. When the voltage direction is switched again (Fig. 4c), the Ru(bpy)3˙1+ ions are generated again at the cathode and react with Ru(bpy)3˙3+, producing a strong emission. The emission continues because the pre-formed Ru(bpy)3˙3+ ions migrate to the cathode. At the anode, the emission is weak and short-lived, since the emission reaction takes place only at the electrode without the supplement of Ru(bpy)3˙3+. The effect of the long-distance migration on light emission is further supported by an experimental setup with horizontally patterned ITO electrodes (Fig. 4d). The purpose of this experiment is the visual observation of whether the emission occurs sequentially or simultaneously in the electrodes. For clearer detection, we designed an electrode gap of ∼100 μm, which is slightly thicker than the spacer (∼60 μm) used in a top–bottom configuration. Fig. 4e and f show the temporal changes in emission during a cycle of potential switching. The emission at the anode is strong, but dims quickly; in contrast, the emission at the cathode is weak but maintained for a longer time (see Movie S1†). After switching the voltage direction (Fig. 4f), the emission at the cathode is intense and long, whereas that at the anode is weak and short. These results are in good consistency with the schematic illustrations in Fig. 4b and c.
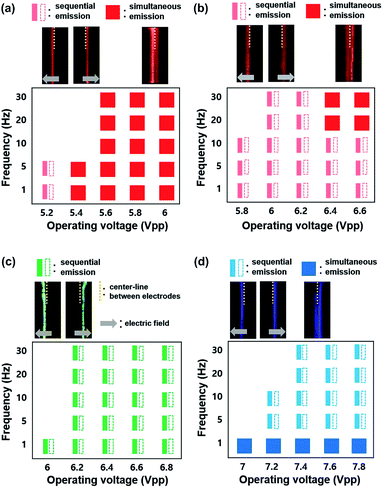
Fig. 5a–d exhibits the ECL emissions from the Ru(bpy)3Cl2 gel (a), the Ru(bpy)3(PF6)2 gel (b), the Ir(diFppy)2(bpy)PF6 gel (c), and the DPA gel (d) in the horizontal ITO-electrode setup at wider ranges of frequency (≤30 Hz) and voltage. For the Ru(bpy)3Cl2 gel, sequential emission was observed at low frequencies (≤10 Hz) and low voltages (≤5.2 Vpp) (Movie S1†), whereas simultaneous emission was observed at higher frequencies and voltages. The sequential and simultaneous emissions are denoted as  and
and  , respectively. Their snapshots are captured in Fig. 5a. The sequential emission at low Vpp for the Ru(bpy)3Cl2 gel is attributed to the low concentration of radical ions. When the migration period of Ru(bpy)3˙3+ is short at high frequencies or when the voltage is large enough to generate a large amount of radical ions, the emissions at the electrodes follow the schematic illustrations in Fig. 4b and c. On the other hand, if the concentration of Ru(bpy)3˙3+ is low due to a small applied voltage, Ru(bpy)3˙3+ ions are depleted near the anode, resulting in sequential emission. In the case of the Ru(bpy)3(PF6)2 gel, because of the relatively short migration distance compared to that of the Ru(bpy)3Cl2 gel, the simultaneous emission occurred at higher frequencies and voltages (Fig. 5b and Movie S2†). For the Ir(diFppy)2(bpy)PF6 gel, sequential emission was observed regardless of the frequency (≤30 Hz) and voltage (Fig. 5c). As the voltage is applied, the positively charged Ir(diFppy)2(bpy)˙+ accumulates. Since the neutral Ir(diFppy)2(bpy)˙0 reduced at the cathode does not respond to the electric field, the emission takes place only at the anode after switching the voltage. The emission was strong and short, and completely sequential with the same emission profile. Images of the sequential emission are provided in Fig. 5c and a Movie in the ESI (Movie S3†). The light emission of the device containing DPA also showed only sequential emission except at very low frequencies (≤1 Hz) (Fig. 5d and Movie S4†). Sequential emission for the DPA gel is likely due to the short lifetime of the anion radical in the NMP solvent.26 The annihilation takes place only at the cathode where new DPA anion radicals are generated.
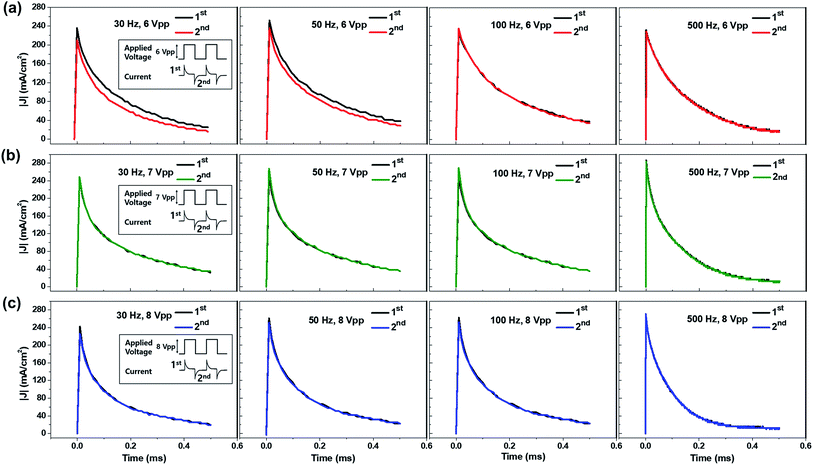
While the horizontal electrode setup made visual observation of the emission process possible, the analysis of ECL behavior at higher frequencies was not available due to limited camera performance. Therefore, we used a top–bottom configuration with larger active areas and thus higher currents, because these short and long emission behaviors originating from ion migration of the luminophores can also be characterized by transient current profiles. Fig. 6a–c displays the transient current profiles of the ECL devices at various operating frequencies (30, 50, 100, and 500 Hz). The operating voltages were 6 Vpp for the red current profile (a), 7 Vpp for the green current profile (b), and 8 Vpp for the blue current profile (c). These voltages were chosen because they should be sufficient to turn on the light but were not too high, so that the devices could maintain the same emission intensity for more than 5 min. Fig. 6a–c shows the 1st and the 2nd current profiles in each emission cycle, denoted in the insets of the left column figures (30 Hz). The 2nd current profile was inverted so that it could be compared with the first one. The current profiles at lower voltages are shown in Fig. S4–S6.† Asymmetric current profiles were recorded from the gel containing Ru(bpy)3Cl2 at low operating frequencies (30 and 50 Hz) as described in Fig. 4. The asymmetric behavior disappeared at high frequencies because the fast alternating electric field reduces the migration distance of the ions. The current profiles in type II (green, Ir(diFppy)2(bpy)PF6) and type III (blue, DPA) showed symmetric profiles regardless of the operating frequencies, which supports the idea that the migration of the ions does not affect ECL behavior.
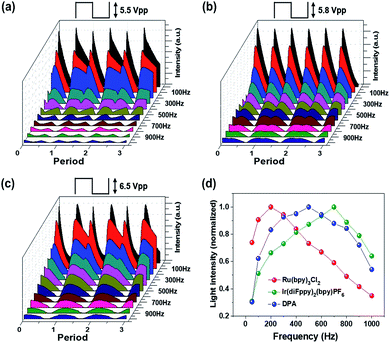
Fig. 7a–c shows the transient emission profiles of the Ru(bpy)3Cl2 gel (a), the Ir(diFppy)2(bpy)PF6 gel (b), and the DPA gel (c). The operating voltages were 5.5 Vpp for the red emission, 5.8 Vpp for the green emission, and 6.5 Vpp for the blue emission. The frequency was in the range of 50–1000 Hz. The Ru(bpy)3Cl2 gel and the DPA gel exhibited asymmetric light emission profiles in each period at all frequencies, whereas the Ir(diFppy)2(bpy)PF6 gel maintained symmetric emission profiles at all frequencies. Fig. 7d summarizes the frequency-dependence with normalized light intensities. The optimal operating frequencies were 200 Hz, 600–700 Hz, and 400–500 Hz for the red, green, and blue ECL gels, respectively. The light intensity per unit time was calculated by integrating the area under the curves and multiplying it by the operating frequency. The calculated intensities are in good agreement with the measured values, as shown in Fig. S3.†
For an electrolyte system, the changes in the ion concentrations and the potential difference are often described by the modified Poisson–Nernst–Planck (mPNP) equation. Since the electrolyte system in this study is a solvent-free pure electrolyte, we used a more generalized mPNP equation (eqn (2)) proposed by Lee et al.27 The equation predicts the decrease of the ion mobility matrix in a concentrated ionic system compared to a dilute ionic system. Eqn (2) was solved with Poisson’s equation (eqn (3)) to obtain the potential change of the electrolyte system.
 | (2) |
 | (3) |
The ECL system in this study contains two chemical reactions: (1) the redox reactions at the electrodes (the formation of Ru(bpy)3˙1+ and Ru(bpy)3˙3+), and (2) the recombination of the redox radicals. In order to clearly understand the ion distributions under external potentials and the chemical reactions, we first solved the equations under DC conditions where the redox reactions take place but the recombinations do not happen. Then, we solved the equations under AC conditions where the recombination reaction was also included.
COMSOL Multiphysics 5.3 (COMSOL, Inc.) was used for the simulation. One dimensional ionic motions were assumed in the calculations, which is usual in tracking the motions driven by external electric fields. In addition, to simplify the calculations, the size of all ions is considered to be the same. With the consideration of the molecular volume of [EMIM][TFSI], the size of 0.55 nm was used for each ion.28 The initial weight fraction of Ru(bpy)3Cl2 was 5.0 wt% in the [EMIM][TFSI] electrolyte, which corresponds to 3.12 mol% of Ru(bpy)32+ in the total cation concentration. The initial concentrations of ions and the maximum concentration that all ions can reach are given in Table S5 (ESI†), in which the maximum ion concentration (9.981 M) was calculated on the basis of the size of the ions.29 In general, the maximum concentration of cations or anions near the electrode is considered as less than twice of the total ion concentration in the bulk ionic liquid,30 so the suggested maximum ion concentration is acceptable. The thickness of the electrolyte layer was 100 μm, and the anode (right electrode) voltage was 3 V higher than the cathode (left electrode) voltage. We assumed that the redox reactions exclusively take place when the electric field is higher than 3 V/100 μm and only within the electric double layer (EDL) near the electrodes, and they are first order reactions (namely, k1[Ru(bpy)32+]) with k1 = 2.23 × 10⁵ s−1 for both reduction and oxidation reactions. Note that the reaction constant was calculated empirically (considering 30% conversion in 1.0 μs). The recombination reaction was considered as a second order reaction, k2[Ru(bpy)3˙1+][Ru(bpy)3˙3+], with a recombination reaction constant k2 of 1010 M−1 s−1. The k2 value was obtained from a reported annihilation reaction constant of Ru(bpy)32+.31
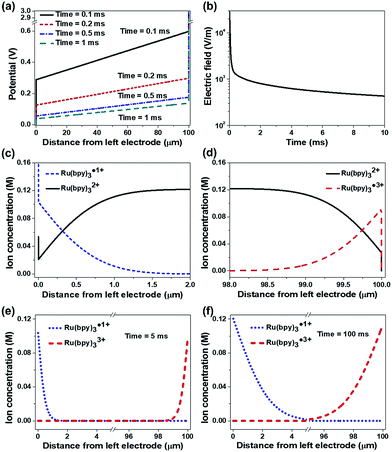
Fig. 8 shows the simulation results under DC conditions including only the redox reactions without recombination. Temporal changes of the potential across the two electrodes are represented in Fig. 8a. Upon the application of an electric potential between the electrodes, EDLs were formed at the electrodes and induced abrupt potential changes (see the vertical lines in Fig. 8a). The linear potential gradients across the bulk ion gel were estimated, in which the slope decreased with time. In general, the formation of an EDL is completed in the order of microseconds,27,29,32–34 so that the potential in the bulk electrolyte is negligible in a time scale of milliseconds after applying an electric field. However, the simulation results indicate that the EDL formation is slow and the electric field along the gel gradually decreases but does not fully disappear as shown in Fig. 8b (43.3 mV/100 μm after 10 ms), when the concentrated ionic system involves redox reactions. It is a notable result different from the conventional concept in dilute electrolyte systems. This remaining electric field may lead to the long distance migration of ions along the ion gel, supporting the long tail in the current of the ECL gel (ESI Fig. S7†). Another important point is that the potential drops at the electrodes by the EDLs are not symmetric. An electrolyte containing cations with a larger valence number induces a smaller potential drop at the cathode than at the anode even without redox reactions (ESI Fig. S8†). This asymmetric potential drop becomes more considerable when the electrolyte undergoes a redox reaction. Fig. 8c and d exhibit the concentration distributions of the reactive ions near the electrodes in 10 ms after the potential is applied. The ion distribution indicates abrupt concentration changes within the EDL (∼1 nm apart from the electrodes). Fig. 8e and f compare the distributions of Ru(bpy)3˙1+ and Ru(bpy)3˙3+ near the electrodes after 5 ms (Fig. 8e) and 100 ms (Fig. 8f). The amount of Ru(bpy)3˙1+ ions was greater than that of Ru(bpy)3˙3+ ions, and the difference became greater as the duration of the voltage application increased.
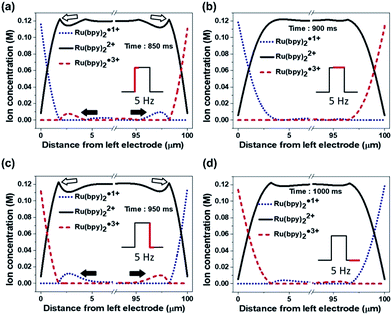
Fig. 9 shows the dynamic ion concentration distributions under AC conditions in which the recombination reaction is added. We applied the electric field obtained in Fig. 8a to eqn (2), and tracked the ion flux during alternate potential switches. We compare the results in the 5th cycle at a low frequency (5 Hz). Fig. 9a and b exhibit the first half period and Fig. 9c and d represent the next half period. At the beginning of the periods, the concentrations of both Ru(bpy)3˙1+ and Ru(bpy)3˙3+ decreased and spanned a relatively wide range (∼1.9 μm) from the cathode and anode, respectively, and the profiles also showed satellite hills (indicated with solid arrows) near the opposite electrode (see Fig. 9a and c). The concentration profiles and the hills are the sources of the recombination reaction. The concentration of the recombination product (namely, unexcited Ru(bpy)32+) peaked near where the concentration profile of Ru(bpy)3˙1+ and the hill of Ru(bpy)3˙3+ met, and vice versa (see empty arrows in Fig. 9a and c). In comparison with the profiles in Fig. 9b, the hills in Fig. 9d were maintained for longer, which implies longer light emission in the second half period. The results in the 5th cycle at a higher frequency (50 Hz) are also provided (see Fig. S9†). The concentration profiles at higher frequency had ion distributions within smaller distances (<1 μm) and smaller hills. They also exhibited an asymmetric distribution of hills in the first and second half periods, but the difference was smaller. Overall, the light emission at a low frequency is longer and more asymmetric than that at a high frequency.
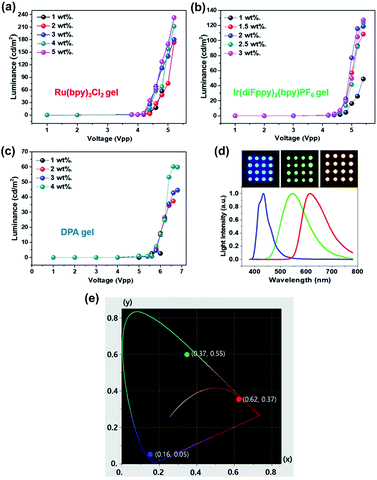
Fig. 10a–c shows luminance versus applied voltage with various luminophore concentrations. The luminance of the ECL devices became larger as the luminophore concentration increased. The selected concentrations of the ECL luminophores for the devices were the saturation values without precipitation for several days. The ECL devices were fabricated using a nozzle printer on a Pt/Si substrate then covered with ITO/glass as a top electrode. The maximum luminance properties for the red, green, and blue ECL devices are 232.4 Cd m−2 at 5.2 Vpp, 123.5 Cd m−2 at 5.4 Vpp, and 60.2 Cd m−2 at 6.4 Vpp, respectively. The camera images and emission spectra of the fabricated ECL devices are given in Fig. 10d. The CIE coordinates of red, green and blue were (x, y) = (0.62, 0.37), (0.37, 0.55) and (0.16, 0.05), respectively (Fig. 10e). The dot arrays (diameter = 2 mm) were prepared using a nozzle printer on the ITO/glass substrate as a top electrode. The wavelengths at the maximum intensity are 615, 545, and 430 nm for the red, green, and blue colors, respectively.
Conclusion
This study reveals that the radical ions generated by redox reactions at the electrodes of an ECL device can move a long distance, which is different from the conventional concept that neglects the long-distance migration of electro-active ion species. The experimental results are consistent with theoretical simulations. In a highly concentrated electrolyte system with redox reactions, the potential drops through the EDLs, but the potential gradient in the bulk electrolyte is not zero and has a long-lasting remaining potential. This remaining potential results in long-distance migration of ECL luminophores. Several factors such as the type of radical ion and counter ion, operating frequency, and applied voltage determine the movement distance of the radical ions. Using a parallel electrode setup, we found that simultaneous emission on both electrodes is observed when the ions move toward the same direction (type I), while sequential emission is detected when the ions are weakly affected by the electric field (type II) or move to opposite directions under an AC electric field (type III). The effect of long-distance migration is valid at low frequencies (<50 Hz) but not at high frequencies. Understanding the ion movements in ECL gel systems helped determine the optimal operating conditions (e.g. voltage and frequency) for RGB colors.Author contributions
S. S. and U. J. designed the research. S. S. performed the experiments. Y. P. and I. K. performed computational simulations. S. C. and I. Y. participated in the sample preparation. S. S., Y. P., H. C. M. and U. J. analysed the experimental data, discussed the results, and wrote the manuscript. S. S. and Y. P. contributed equally to this study.Conflicts of interest
There are no conflicts to declare.Acknowledgements
This work was supported by the Samsung Research Funding Center of Samsung Electronics under Project Number SRFC-MA1301-07.References
- S. W. Feldberg, J. Am. Chem. Soc., 1966, 88, 390 CrossRef CAS.
- J. Maloy and A. J. Bard, J. Am. Chem. Soc., 1971, 93, 5968 CrossRef CAS.
- A. J. Bard, Electrogenerated chemiluminescence, Marcel Dekker, New York, 2004 Search PubMed.
- M. M. Richter, Chem. Rev., 2004, 104, 3003 CrossRef CAS PubMed.
- R. Pyati and M. M. Richter, Annu. Rep. Prog. Chem., Sect. C: Phys. Chem., 2007, 103, 12 RSC.
- R. J. Forster, P. Bertoncello and T. E. Keyes, Annu. Rev. Anal. Chem., 2009, 2, 359 CrossRef CAS PubMed.
- Z. Liu, W. Qi and G. Xu, Chem. Soc. Rev., 2015, 44, 3117 RSC.
- N. Itoh, Materials, 2010, 3, 3729 CrossRef CAS.
- P. Burrows, V. Bulovic, S. Forrest, L. S. Sapochak, D. McCarty and M. Thompson, Appl. Phys. Lett., 1994, 65, 2922 CrossRef CAS.
- M. Buda, G. Kalyuzhny and A. J. Bard, J. Am. Chem. Soc., 2002, 124, 6090 CrossRef CAS PubMed.
- G. Kalyuzhny, M. Buda, J. McNeill, P. Barbara and A. J. Bard, J. Am. Chem. Soc., 2003, 125, 6272 CrossRef CAS PubMed.
- E. S. Handy, A. J. Pal and M. F. Rubner, J. Am. Chem. Soc., 1999, 121, 3525 CrossRef CAS.
- H. C. Moon, T. P. Lodge and C. D. Frisbie, Chem. Mater., 2014, 26, 5358 CrossRef CAS.
- K. Nishimura, Y. Hamada, T. Tsujioka, S. Matsuta, K. Shibata and T. Fuyuki, Jpn. J. Appl. Phys., 2001, 40, L1323 CAS.
- T. Nobeshima, T. Morimoto, K. Nakamura and N. Kobayashi, J. Mater. Chem., 2010, 20, 10630 RSC.
- T. Daimon and E. Nihei, Materials, 2013, 6, 1704 CrossRef CAS PubMed.
- T. Nobeshima, M. Nakakomi, K. Nakamura and N. Kobayashi, Adv. Opt. Mater., 2013, 1, 144 CrossRef.
- E. Kerr, E. H. Doeven, G. J. Barbante, C. F. Hogan, D. J. Bower, P. S. Donnelly, T. U. Connell and P. S. Francis, Chem. Sci., 2015, 6, 472 RSC.
- H. L. Filiatrault, G. C. Porteous, R. S. Carmichael, G. J. Davidson and T. B. Carmichael, Adv. Mater., 2012, 24, 2673 CrossRef CAS PubMed.
- H. C. Moon, T. P. Lodge and C. D. Frisbie, J. Am. Chem. Soc., 2014, 136, 3705 CrossRef CAS PubMed.
- H. C. Moon, T. P. Lodge and C. D. Frisbie, J. Mater. Chem. C, 2016, 4, 8448 RSC.
- K. Hong, Y. K. Kwon, J. Ryu, J. Y. Lee, S. H. Kim and K. H. Lee, Sci. Rep., 2016, 6, 29805 CrossRef CAS PubMed.
- L. Pilon, H. Wang and A. d’Entremont, J. Electrochem. Soc., 2015, 162, A5158 CrossRef CAS.
- G. Brug, A. Van Den Eeden, M. Sluyters-Rehbach and J. Sluyters, J. Electroanal. Chem., 1984, 176, 275 CrossRef CAS.
- E. Barsoukov and J. R. Macdonald, Impedance spectroscopy: theory, experiment, and applications, Wiley-Interscience, Hoboken, NJ, 2005 Search PubMed.
- S. A. Cruser and A. J. Bard, J. Am. Chem. Soc., 1969, 91, 267 CrossRef CAS.
- A. A. Lee, S. Kondrat, D. Vella and A. Goriely, Phys. Rev. Lett., 2015, 115, 106101 CrossRef PubMed.
- A. Elbourne, S. McDonald, K. Voichovsky, F. Endres, G. G. Warr and R. Atkin, ACS Nano, 2015, 9, 7608 CrossRef CAS PubMed.
- L. Pilon, H. Wang and A. d’Entremont, J. Electrochem. Soc., 2015, 162, A5158 CrossRef CAS.
- M. V. Fedorov and A. A. Kornyshev, Chem. Rev., 2014, 114, 2978 CrossRef CAS PubMed.
- M. M. Collinson, R. M. Wightman and P. Pastore, J. Phys. Chem., 1994, 98, 11942 CrossRef CAS.
- M. van Soestbergen, Electrochim. Acta, 2010, 55, 1848 CrossRef CAS.
- X. Jiang, J. Huang, H. Zhao, B. G. Sumpter and R. Qiao, J. Phys.: Condens. Matter, 2014, 26, 284109 CrossRef PubMed.
- R. Morrow, D. R. McKenzie and M. M. M. Bilek, J. Phys. D: Appl. Phys., 2006, 39, 937 CrossRef CAS.
Footnote |
| † Electronic supplementary information (ESI) available. See DOI: 10.1039/c7sc03996d |
| This journal is © The Royal Society of Chemistry 2018 |

