 Open Access Article
FAD roles in glucose catalytic oxidation studied by multiphase flow of extractive electrospray ionization (MF-EESI) mass spectrometry†
Yan
Wang
 ,
Min
Sun
,
Jinping
Qiao
,
Jin
Ouyang
,
Min
Sun
,
Jinping
Qiao
,
Jin
Ouyang
 and
Na
Na
 *
*
Key Laboratory of Theoretical and Computational Photochemistry, College of Chemistry, Beijing Normal University, Beijing 100875, China. E-mail: nana@bnu.edu.cn
First published on 27th October 2017
Abstract
The role of the coenzyme flavin adenine dinucleotide (FAD) in the catalytic oxidation of glucose was elucidated by MS using a new extraction and ionization method. By a multiphase flow of liquid–gas, extractive electrospray ionization was achieved, and this technique (MF-EESI) decreased the salt-matrix interference effectively, avoided salt crystallizations at the capillary tip and increased ionization efficiency by a concentric-sprayed solvent. Notably, two intermediate complexes of FAD–glucose have been observed and differentiated for the first time using this MF-EESI technique. These intermediate complexes were demonstrated to be responsible for the hydride abstraction from glucose, as well as the cyclic coenzyme conversion of FAD during glucose oxidation. Online monitoring was also employed in MF-EESI, thereby providing a potential and informative tool to scrutinize enzymatic catalytic reactions.
Introduction
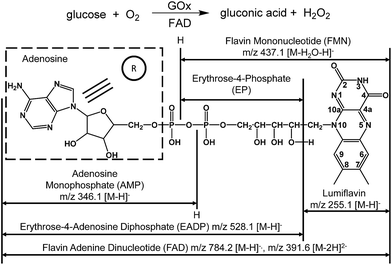
Flavin adenine dinucleotide (FAD) is a noncovalently bonded coenzyme (Scheme 1) that is present in each subunit of glucose oxidase (GOx) and acts as a redox carrier in catalysis.1 GOx is a flavoprotein derived from Aspergillus niger that catalyzes the oxidation of β-D-glucose into gluconic acid (Scheme 1).2,3 During glucose oxidation, FAD acts as an electron acceptor,4–6 in a manner similar to molecular oxygen and ferricyanides.1,2,7 This process involves the transfer of protons and electrons from the substrate to the flavin moiety.2,4 In addition, the binding of glucose to free FAD has been predicted in conjunction with hydride and proton transfer from glucose to FAD.1,8 Because of the complicated mechanism of GOx-catalyzed oxidation, directly observing the formation of FAD–glucose complex remains elusive, and the roles of FAD in GOx-catalyzed oxidation require further experimental studies.Several efforts have been made to examine the roles of FAD during GOx-catalyzed oxidation using techniques such as electrochemistry approaches, infrared and NMR spectroscopies and X-ray diffraction in addition to theoretical calculations.5,9 However, a definitive observation of changes in the molecular structure of the participating species, such as cleavage of the reactants, product formation and the transient presence of reactive intermediates, remains challenging. As a result, the details of the mechanism remain vague and are largely based on the limited information derived from indirect evidence. Therefore, it is worthwhile to seek a more effective approach to obtain accurate molecular-level information directly, rapidly and reliably.
Mass spectrometry (MS) is a powerful technique to obtain molecular information and it can be used to characterize intermediates10–13 due to the advent of soft ionization methods such as electrospray ionization (ESI).14–16 Ambient MS techniques have emerged for quick data acquisition without sample pre-treatment,17,18 thereby facilitating reaction monitoring and mechanistic examinations.19–25 For example, desorption electrospray ionization (DESI) was used to monitor reactions through an online mixer recently,26 and was applied to identify electrochemically generated intermediates by direct sampling from the surface of a waterwheel working electrode.27–29 In addition, extractive electrospray ionization (EESI)30 and Venturi easy ambient sonic-spray ionization (V-EASI)31,32 have made it possible to continuously extract samples from the liquid phase into the MS inlet continuously with assistance from a sonic stream of gases. Even though the sensitivity and stability of actual reaction systems using these techniques need to be enhanced, the salt-matrix still obscures the observation of short-lived intermediates, and can even interrupt signals via salt crystallization taking place at the capillary tip. In addition, a sonic-spray without high voltage usually requires a high gas flow rate, resulting in the over-consumption of samples, which makes it difficult to achieve real-time monitoring of reactions with a finite volume. An improvement in ambient MS techniques is therefore desirable to monitor intermediates in liquid reaction systems accurately.
Here, in order to elucidate the role of FAD in the catalytic oxidation of glucose by GOx clearly, a new extraction and ionization technique was developed.
Experimental
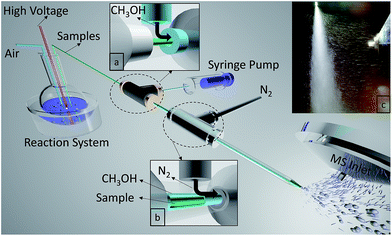
A multiphase flow extractive electrospray ionization (MF-EESI) system was constructed based on extractive electrospray ionization achieved via a multiphase flow of liquid–gas from three layered concentric capillaries. As shown in Fig. 1, a self-pumping effect from the liquid reaction system was generated by passing a high-velocity (sonic) nebulizing stream of N2 gas through an external capillary (i.d. 1.0 mm, o.d. 1.3 mm). Simultaneously, the ionization solvent (i.e. methanol) spray was also generated by using this sonic gas and was delivered at 50 μL min−1 through an interlayer capillary (i.d. 530 μm, o.d. 690 μm). The innermost capillary (i.d. 250 μm, o.d. 365 μm) was inserted directly into the liquid reaction system, which was connected to a high voltage. The flows of methanol and N2 were sequentially introduced to the sample flow by three concentric capillaries fixed by two 1/16-inch T-shaped connectors. In addition, the tip of an external capillary was necked-in to increase the linear velocity of the gas to enhance the self-pumping effect.33All chemicals were of analytical grade. HPLC grade methanol was purchased from Fisher Chemical (USA) while gluconic acid, glucose oxidase, and glucose were obtained from Sigma-Aldrich (USA). Phosphate buffered saline (PBS) (0.01 M, pH = 7.2–7.4) was purchased from Solarbio (Beijing Solarbio Science & Technology Co., Ltd.). Deionized water (Mill-Q, Millipore, 18.2 MΩ resistivity) was used in all experiments.
All reagents were freshly prepared. For the catalytic reaction, 220 μL of GOx solution (1000 U mL−1) was added into 10 mL of PBS buffer containing 20 mM glucose. The interaction between glucose and FAD was examined with the addition of 7 μg mL−1 FAD into the solutions mentioned above.
Experiments were performed on a 5600 Triple-ToF mass spectrometer (AB Sciex, Framingham, MA) using a home-made ionization source for MF-EESI. An LTQ Orbitrap XL (Thermo Fisher Scientific, San Jose, CA, USA) instrument was used for the identification of ions by tandem mass spectrometry (MS/MS) using collision induced dissociation (CID). The nanoelectrospray ionization (nano-ESI) of glucose and the enzyme in the presence of a coenzyme was initiated through a 6 μm-borosilicate tip by applying a potential of ∼1.5 kV. The operational parameters were as follows: full-scan negative (−) ion spectra were obtained over an m/z range from 50 to 2000; the capillary temperature was 250 °C; the capillary voltage and tube lens voltage were set to −18 V and −120 V, respectively. The ion maximum injection time of the linear ion trap was 100 ms. All the MS results were obtained and processed using Xcalibur or Microcal Origin (version 8.0) software.
Fluorescence spectra were collected on a FS5 fluorescence spectrophotometer (Edinburgh Instruments, UK). The slit widths were 5 nm for excitation and 2.5 nm for emission. The photomultiplier voltage was 800 V. UV-vis absorption data were obtained on a UV2600 spectrophotometer (Shimadzu, Japan) with a slit of 0.5 nm.
Results and discussion
Extraction and ionization of samples from a liquid system
The liquid sample was extracted from the reaction system by a self-pumping effect, and the electrospray was generated at the tip of an internal capillary. Concomitantly, the sample spray was treated by the methanol spray out of the concentric interlayer capillary and the spray flow became larger. As shown in Fig. 1c, the mixed-spray was perpendicular to the MS inlet and that made large droplets with higher kinetic energies and most of the neutral entities including most of the solvent, matrix, and the crystallized salt excluded from the MS inlet. However, only some charged species with relatively lower kinetic energies entered the MS under electric and vacuum forces, which would be in favor of decreasing background signals. However, for the extracted sample spray, few charged plumes are observed to propel the sample to the MS under electric and vacuum forces, owing to the quite low ionization efficiency (Fig. S1-A, see ESI†). Furthermore, no charged methanol spray was propelled to the MS without applying high voltage (Fig. S1-B†), while when introducing the methanol spray into the extracted sample spray at the capillary tip through the concentric capillaries, we recorded more remarkable ion propulsion to the MS (Fig. S1-C†). This might be generated from the enhancement of ionization efficiency through interaction between methanol droplets and charged sample particles.During MF-EESI, on-line droplet–droplet extraction would occur when the sample spray intersects with the methanol spray, which would exclude salts from the analyte molecules for continuous analysis of the analytes.30,34 Furthermore, the formation of an orthogonal orientation-spray by MF-EESI would help to produce much smaller droplets that have a lower salt![[thin space (1/6-em)]](https://www.rsc.org/images/entities/char_2009.gif) :
:![[thin space (1/6-em)]](https://www.rsc.org/images/entities/char_2009.gif) analyte ratio.35 As the droplet size decreases by solvent evaporation, this ratio would continue to decrease, and the majority of the salts would be contained in droplets without analyte.35 Therefore, analyte ions and salt ions tend to form from separated droplets which avoids the salt interference, and protonated forms and salt clusters could be excluded from the MS inlet by the orthogonal orientation-spray. It should be noted that although orthogonal sprays have already been adopted in commercial instruments, they are still uncommon in ambient MS techniques due to their relatively low ionization efficiency or sensitivity without sample pretreatment.17,21 Fortunately, spraying the solvent in a concentric fashion in MF-EESI can compensate for the orthogonal spray’s decrease in ionization efficiency, which could obtain the relatively higher sensitivity in the following mechanism examinations.
analyte ratio.35 As the droplet size decreases by solvent evaporation, this ratio would continue to decrease, and the majority of the salts would be contained in droplets without analyte.35 Therefore, analyte ions and salt ions tend to form from separated droplets which avoids the salt interference, and protonated forms and salt clusters could be excluded from the MS inlet by the orthogonal orientation-spray. It should be noted that although orthogonal sprays have already been adopted in commercial instruments, they are still uncommon in ambient MS techniques due to their relatively low ionization efficiency or sensitivity without sample pretreatment.17,21 Fortunately, spraying the solvent in a concentric fashion in MF-EESI can compensate for the orthogonal spray’s decrease in ionization efficiency, which could obtain the relatively higher sensitivity in the following mechanism examinations.
Optimizations and advantages for reaction studies in a liquid system
On the basis of optimization tests for MF-EESI MS (Fig. S2†), the following experimental conditions were determined: 0.30 MPa of N2 gas, 50 μL min−1 of methanol, i.d. 250 μm of the innermost capillary, and 2.2 kV for the high voltage. Compared with traditional ESI MS, we obtained higher signal intensities at different spray voltages by MF-EESI MS, and its optimized high voltage was much lower than that of ESI MS (Fig. S2-B†). This result indicates that this technique is likely to have a higher ionization efficiency than ESI MS, and show enhanced signals with the soft ionization process. Thus, MF-EESI MS would yield even more ion signals than traditional ESI MS, which is clearly important in mechanistic studies.The MF-EESI MS system has several advantages in terms of its ability to examine reactions in a complicated salt system under ambient conditions: (1) it decreases background signals by removing neutral particles and large droplets of catalysts/salt matrices with higher kinetic energies. (2) It avoids signal interruption caused by salt crystallization at the capillary tip. (3) The ionization efficiency increases owing to the use of the concentric-sprayed solvent, which enhances the signal intensity. (4) A direct extraction of the samples from liquid media takes place and ions of complexes or intermediates could be obtained by soft ionization.
Comparison between MF-EESI and traditional electrospray methods
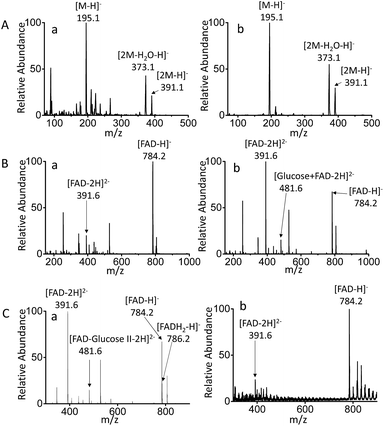
MF-EESI and traditional electrospray (ESI) methods were compared to establish the advantages of the former for extraction and ionization. By traditional ESI MS, the ions of [M − H]− at m/z 195.0, [2M − H2O–H]− at m/z 373.1 and [2M − H]− at m/z 391.1 were obtained for gluconic acid in PBS buffer, while the obvious background ions lowered the signal-to-noise ratio to some extent (Fig. 2A-a). However, an increased ion signal with a higher signal-to-noise ratio was obtained by MF-EESI MS (Fig. 2A-b). A mixture of FAD and glucose was then examined and, apart from the ions of [FAD − 2H]2− (m/z 391.6) and [FAD − H]− (m/z 784.2) that could also be recorded by ESI MS (Fig. 2B-a), an additional complex ion of [FAD–glucose I − 2H]2− at m/z 481.6 was observed by MF-EESI MS (Fig. 2B-b). The identification of this signal was significant in the mechanistic study of the catalytic oxidation of glucose.Furthermore, when GOx was present in the mixture, except for the same ion at m/z 784.2 as observed without GOx (demonstrated by tandem mass spectrometry (MS/MS) using CID in Fig. S3-A and S4-B†), an additional ion at m/z 786.2 was observed in the presence of GOx (Fig. 2C-a). Fragments of [AMP–H]− at m/z 346.1 and [FMNH2-H2O–H]− at m/z 439.1 were observed by MS2 CID of m/z 786.2 (Fig. S4-C†), which further confirmed the formation of FADH2 in the presence of GOx. However, although nano-ESI was reported to be more tolerant towards salt contamination than ESI,36,37 it still presented relatively weaker signals with a lower signal to noise ratio, which failed to record the important ion at m/z 481.6 (Fig. 2C-b). Therefore, MF-EESI MS can be used to obtain enhanced ion signals with a higher signal-to-noise ratio in salt solutions. Furthermore, it is a soft technique, useful for recording complex or intermediate ions for complicated mechanistic studies of catalytic reactions.
Examinations on the FAD–glucose complex
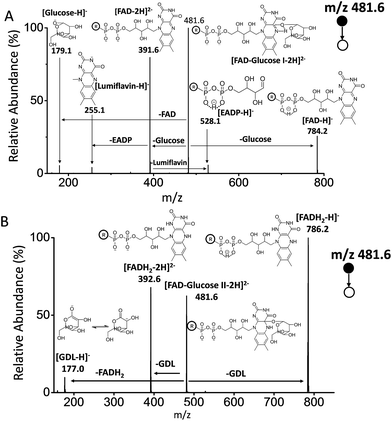
As reported, the enzyme-FAD complex formed during the catalytic oxidation of glucose.1,5,38 Although we could not record the GOx–FAD complex by the present technique, we observed the complex of FAD–glucose in the catalytic environment. Subsequently, the complex ion of [FAD–glucose I − 2H]2− at m/z 481.6 from the mixture of glucose and FAD was examined by MSn CID. In addition to the molecular ion of [glucose − H]− at m/z 179.1, FAD-related ions were also observed by MS2 CID of m/z 481.6, including [lumiflavin − H]− at m/z 255.1, [EADP–H]− at m/z 528.1, [FAD − 2H]2− at m/z 391.6 and [FAD − H]− at m/z 784.2 (Fig. 3A) (the full names of the corresponding structures are shown in Scheme 1). The structures and possible fragmentation schemes of [FAD − 2H]2− (m/z 391.6) and [FAD − H]− (m/z 784.2) were determined by MSn CID (Fig. S3, Scheme S1†). On this basis, the corresponding fragmentation mechanism of [FAD–glucose I − 2H]2− at m/z 481.6 was derived, as shown in Scheme S2-A.† It should be noted that the energy applied for MS2 CID at m/z 481.6 was 3–4 times lower than usual, suggesting that the complex ion of [FAD–glucose I − 2H]2− might be an encounter complex39 in which non-covalent interactions exist between glucose and hydroxyl-aromatic nitrogen of FAD (such as hydrogen bonding or self-association motifs1,40).The ion of [FAD–glucose II − 2H]2− at m/z 481.6 obtained with the addition of GOx was further examined by MSn CID. The different MS2 CID spectra of m/z 481.6 showed fragments related to the loss of gluconic acid-δ-lactone (GDL). These fragments included [GDL–H]− at m/z 177.0, [FADH2 − 2H]2− at m/z 392.6 and [FADH2 − H]− at m/z 786.2 (Fig. 3B). The distinct structure of m/z 481.6 was generated by the formation of a glucosidic link between glucose and FAD, followed by an enzyme-base-catalyzed deprotonation from the C1 hydrogen of glucose together with a concerted transfer of two electrons from it to FAD. This mechanism is consistent with that reported in the literature.3 The fragmentation pattern of [FAD–glucose II − 2H]2− at m/z 481.6 is shown in Scheme S2-B.†
It is noteworthy that although the encounter complex of FAD–glucose has been predicted for several decades,39 this is the first evidence of the formation of complex ions of FAD–glucose determined by MS. Furthermore, the two kinds of complex, with and without GOx, were distinguishable even though they have identical m/z values. In contrast, the formation of the complex could not be demonstrated by fluorescence (FL) spectra obtained under the same conditions (Fig. S5-A†). Although a difference in the UV-vis absorbance can be observed in the mixture of FAD and glucose in the presence of GOx, it is nevertheless difficult to confirm the formation of the FAD–glucose complex directly (Fig. S5-B†).
Possible role of FAD for catalytic oxidation of glucose
It can be deduced that in the mixture of FAD (Scheme 2-a) and glucose, a hydride is transferred from glucose to FAD (Scheme 2-b) to form the intermediate FAD–glucose-I (Scheme 2-c). With the addition of GOx, an acidic enzyme residue and a basic group on GOx helped to accomplish the proton and electron transfer between three molecules of FAD, GOx and glucose (Scheme 2-d). This included a nucleophilic attack by electrons on the lumiflavin nucleus of FAD, which was followed by a deprotonation from glucose and an electronic rearrangement that is a hydride transfer from glucose to flavin,31 which resulted in the FAD–glucose-II intermediate (Scheme 2-d). Subsequently, the reduced FAD of FADH2 (Scheme 2-g) and another oxidized intermediate of GDL (Scheme 2-e) is generated following cleavage of FAD–glucose-II. This process has been further confirmed by an isotope labelling experiment using a deuterated reagent, D-glucose-1-d, to replace the common glucose in the catalytic reaction. It demonstrates that C1–H of glucose is not involved in the formation of FAD–glucose, but plays roles in the hydride abstraction from the reactive carbon of glucose for the subsequent FAD reduction and glucose oxidation (Fig. S6†). Finally, the oxidized product of gluconic acid (Scheme 2-f) is formed by the hydrolyzation of GDL. It should be noted that the acidic enzyme residue of H–A (pK2 > 10) could be recovered easily in the system for the next catalytic cycle.39 In addition, it is reported that this is a second order kinetic process between a tight enzyme–FAD complex and free glucose.1 Therefore, the formation of FAD–glucose through weak affinity could introduce glucose into the reactive site of GOx, and FAD reduction and glucose oxidation are employed subsequently with the help of the His residues of GOx.1,5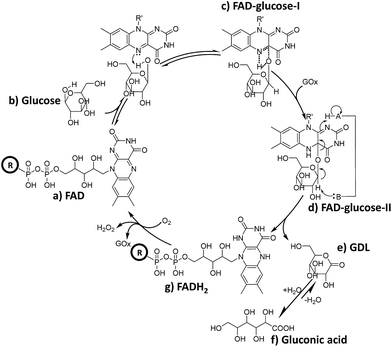 | ||
| Scheme 2 Schematic diagram of the possible role of FAD during the catalytic oxidation of glucose, where H–A in GOx represents an acidic enzyme residue with pKa > 10.39 | ||
Furthermore, reduced FADH2 could be re-oxidized to FAD with O2 in conjunction with the release of H2O2, thereby completing the catalytic cycle (Scheme 2g to a). This cyclical conversion from FAD to FADH2 and back to FAD has been confirmed by MF-EESI MS based on the transformation of [FAD − H]− at m/z 784.2 to [FADH2 − H]− at m/z 786.2 with the addition of GOx, followed by the conversion from [FADH2 − H]− back to [FAD − H]− by introducing O2 into the system (Fig. S7†).
Real-time monitoring of the reaction
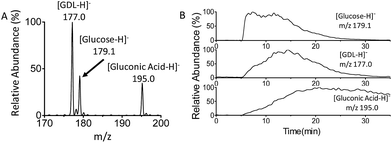
Finally, real-time monitoring of the catalytic oxidation of glucose by GOx has been performed using MF-EESI MS. During this process, the signals of the reactant [glucose − H]− at m/z 179.1, product [gluconic acid−H]− at m/z 195.0, and intermediate [GDL–H]− at m/z 177.0 were closely monitored (Fig. 4A). The reaction began after GOx was uniformly dispersed in PBS buffer at 37 °C, and lasted for ∼30 min. As shown in Fig. 4B, the intensity of the [glucose − H]− ion at m/z 179.1 increased immediately after the injection of glucose at 5 min, and then decreased gradually to almost zero at ∼30 min. The intensity of the intermediate ion [GDL–H]− at m/z 177.0 increased from zero to its highest value at ∼15 min, and decreased subsequently with time. This is just in accordance with the transient presence of the GDL intermediate during the catalytic oxidation: GDL is obtained by the cleavage of FAD–glucose-II (Scheme 2-d), and subsequently converts into gluconic acid (Scheme 2-f) by hydrolyzation. Furthermore, the intensity of the ion [gluconic acid−H]− at m/z 195.0 corresponding to the product increased gradually and reached a relatively stable amount after 20 min. These observations confirm the feasibility of applying MF-EESI MS to the real-time monitoring of this reaction in a complicated solution without any signal interruption.Conclusions
In conclusion, MF-EESI is convenient for reaction studies due to it decreasing background signals by effectively preventing most neutral entities and large droplets with higher kinetic energies entering the MS inlet. It also helps to avoid salt crystallization at the capillary tip and enhances the ionization efficiency by spraying solvent in a concentric manner. Using this technique, the suggested intermediates of FAD–glucose complexes have been successfully identified, thus clarifying the actual role of FAD in glucose oxidation. Furthermore, reaction monitoring could be achieved directly by extracting samples from the bulk reaction systems without any interruption. Overall, this technique sets a precedent for examining complicated reactions, and is expected to expand the applicability of ambient MS to mechanistic studies or process monitoring.Conflicts of interest
There are no conflicts to declare.Acknowledgements
N. Na, Y. Wang, and J. Qiao gratefully acknowledge financial support provided by the National Natural Science Foundation of China (21422503 and 21675015), and the Fundamental Research Funds for the Central Universities. J. Ouyang is grateful for financial support provided by the National Natural Science Foundation of China (21475011 and 21675014).References
- V. Leskovac, S. Trivic, G. Wohlfahrt, J. Kandrac and D. Pericin, Int. J. Biochem. Cell Biol., 2005, 37, 731–750 CrossRef CAS PubMed.
- A. Haouz, C. Twist, C. Zentz, P. Tauc and B. Alpert, Eur. Biophys. J., 1998, 27, 19–25 CrossRef CAS PubMed.
- R. Wilson and A. P. F. Turner, Biosens. Bioelectron., 1992, 7, 165–185 CrossRef CAS.
- J. P. Roth and J. P. Klinman, Proc. Natl. Acad. Sci. U. S. A., 2003, 100, 62–67 CrossRef CAS PubMed.
- H. Yoshida, G. Sakai, K. Mori, K. Kojima, S. Kamitori and K. Sode, Sci. Rep., 2015, 5, 13498 CrossRef CAS PubMed.
- M. Shiota, T. Yamazaki, K. Yoshimatsu, K. Kojima, W. Tsugawa, S. Ferri and K. Sode, Bioelectrochemistry, 2016, 112, 178–183 CrossRef CAS PubMed.
- G. Wohlfahrt, S. Trivic, J. Zeremski, D. Pericin and V. Leskovac, Mol. Cell. Biochem., 2004, 260, 69–83 CrossRef CAS PubMed.
- M. Meyer, G. Wohlfahrt, J. Knablein and D. Schomburg, J. Comput.–Aided Mol. Des., 1998, 12, 425–440 CrossRef CAS PubMed.
- Q. Wang, W. Xu, P. Wu, H. Zhang, C. Cai and B. Zhao, J. Phys. Chem. B, 2010, 114, 12754–12764 CrossRef CAS PubMed.
- X.-F. Jiang, H. Huang, Y.-F. Chai, T. L. Lohr, S.-Y. Yu, W. Lai, Y.-J. Pan, M. Delferro and T. J. Marks, Nat. Chem., 2017, 9, 188–193 CrossRef CAS PubMed.
- R. S. Xu, J. P. Wan, H. Mao and Y. J. Pan, J. Am. Chem. Soc., 2010, 132, 15531–15533 CrossRef CAS PubMed.
- C. Iacobucci, S. Reale, J. F. Gal and F. De Angelis, Angew. Chem., Int. Ed., 2015, 54, 3065–3068 CrossRef CAS PubMed.
- C. Iacobucci, S. Reale and F. De Angelis, Angew. Chem., Int. Ed., 2016, 55, 2980–2993 CrossRef CAS PubMed.
- K. L. Vikse and P. Chen, Organometallics, 2015, 34, 1294–1300 CrossRef CAS.
- L. Batiste and P. Chen, J. Am. Chem. Soc., 2014, 136, 9296–9307 CrossRef CAS PubMed.
- C. Adlhart, C. Hinderling, H. Baumann and P. Chen, J. Am. Chem. Soc., 2000, 122, 8204–8214 CrossRef CAS.
- A. Venter, M. Nefliu and R. Graham Cooks, TrAC, Trends Anal. Chem., 2008, 27, 284–290 CrossRef CAS.
- F. Han, Y. Yang, J. Ouyang and N. Na, Analyst, 2015, 140, 710–715 RSC.
- Y. Yang, F. Han, J. Ouyang, Y. Zhao, J. Han and N. Na, Anal. Chim. Acta, 2016, 902, 135–141 CrossRef CAS PubMed.
- N. Na, Y. Xia, Z. Zhu, X. Zhang and R. G. Cooks, Angew. Chem., Int. Ed., 2009, 48, 2017–2019 CrossRef CAS PubMed.
- X. Yan, R. M. Bain and R. G. Cooks, Angew. Chem., Int. Ed., 2016, 55, 12960–12972 CrossRef CAS PubMed.
- X. Yan, E. Sokol, X. Li, G. Li, S. Xu and R. G. Cooks, Angew. Chem., Int. Ed., 2014, 53, 5931–5935 CrossRef CAS PubMed.
- T. A. Brown, N. Hosseini-Nassab, H. Chen and R. N. Zare, Chem. Sci., 2016, 7, 329–332 RSC.
- R. M. Bain, C. J. Pulliam, S. A. Raab and R. G. Cooks, J. Chem. Educ., 2015, 92, 2146–2151 CrossRef CAS.
- A. J. Ingram, C. L. Boeser and R. N. Zare, Chem. Sci., 2016, 7, 39–55 RSC.
- S. Cheng, Q. Wu, H. Xiao and H. Chen, Anal. Chem., 2017, 89, 2338–2344 CrossRef CAS PubMed.
- Q. Zheng, Y. Liu, Q. Chen, M. Hu, R. Helmy, E. C. Sherer, C. J. Welch and H. Chen, J. Am. Chem. Soc., 2015, 137, 14035–14038 CrossRef CAS PubMed.
- T. A. Brown, H. Chen and R. N. Zare, J. Am. Chem. Soc., 2015, 137, 7274–7277 CrossRef CAS PubMed.
- T. A. Brown, H. Chen and R. N. Zare, Angew. Chem., Int. Ed., 2015, 54, 11183–11185 CrossRef CAS PubMed.
- X. Li, B. Hu, J. Ding and H. Chen, Nat. Protoc., 2011, 6, 1010–1025 CrossRef CAS PubMed.
- V. G. Santos, T. Regiani, F. F. Dias, W. Romao, J. L. Jara, C. F. Klitzke, F. Coelho and M. N. Eberlin, Anal. Chem., 2011, 83, 1375–1380 CrossRef CAS PubMed.
- N. Na, R. Shi, Z. Long, X. Lu, F. Jiang and J. Ouyang, Talanta, 2014, 128, 366–372 CrossRef CAS PubMed.
- S. Geromanos, G. Freckleton and P. Tempst, Anal. Chem., 2000, 72, 777–790 CrossRef CAS PubMed.
- H. W. Chen, A. Venter and R. G. Cooks, Chem. Commun., 2006, 2042–2044 RSC.
- A. C. Susa, Z. Xia and E. R. Williams, Anal. Chem., 2017, 89, 3116–3122 CrossRef CAS PubMed.
- A. Schmidt, M. Karas and T. Dulcks, J. Am. Soc. Mass Spectrom., 2003, 14, 492–500 CrossRef CAS PubMed.
- M. Wilm and M. Mann, Anal. Chem., 1996, 68, 1–8 CrossRef CAS PubMed.
- H. J. Hecht, H. M. Kalisz, J. Hendle, R. D. Schmid and D. Schomburg, J. Mol. Biol., 1993, 229, 153–172 CrossRef CAS PubMed.
- M. K. Weibel and H. J. Bright, J. Biol. Chem., 1971, 246, 2734–2744 CAS.
- T. R. Shattock, K. K. Arora, P. Vishweshwar and M. J. Zaworotko, Cryst. Growth Des., 2008, 8, 4533–4545 CAS.
Footnote |
| † Electronic supplementary information (ESI) available: Pictures of ionization, optimizations, MS/MS data for structure confirmation and fragmentation mechanisms of FAD-complexes, FL and UV-vis spectra, isotope labelling experiment and mass spectra confirmation for cyclic conversion of FAD. See DOI: 10.1039/c7sc04259k |
| This journal is © The Royal Society of Chemistry 2018 |

