 Open Access Article
Imaging multiple microRNAs in living cells using ATP self-powered strand-displacement cascade amplification†
Xiangdan
Meng
ab,
Wenhao
Dai
ab,
Kai
Zhang
ab,
Haifeng
Dong
 *ab and
Xueji
Zhang
*ab
aResearch Center for Bioengineering and Sensing Technology, School of Chemistry and Bioengineering, University of Science & Technology Beijing, Beijing 100083, P. R. China. E-mail: hfdong@ustb.edu.cn; zhangxueji@ustb.edu.cn
bNational Institute of Precision Medicine & Health, Beijing, 100083, P. R. China
First published on 1st December 2017
Abstract
Herein, we design a smart autonomous ATP self-powered strand-displacement cascade amplification (SDCA) system for highly sensitive multiple intracellular miRNA detection. Rationally engineered Y-motif DNA structures are functionalized on mesoporous silica-coated copper sulfide nanoparticles loaded with numerous ATPs (CuS@mSiO2-Y/ATP) through pH stimulus-responsive disulfide bonds. The SDCA system is implemented by endogenous specific miRNA as a trigger and ATP as fuel released from the nanocarrier at acidic pH and photothermal stimuli-responsive CuS. The ATP self-powered SDCA process presents higher sensitivity compared to that without amplification for intracellular miRNA imaging. Two-color simultaneous and sensitive imaging of multiple cancer-related miRNAs in living cells is also confirmed. This enables facile and accurate differentiation between normal cells and different types of cancer cell using intracellular miRNA imaging, which improves the veracity and timeliness for early cancer diagnosis.
Introduction
MicroRNAs (miRNAs), a class of endogenous non-coding small molecule single-stranded RNA (18–22 nt), are regarded as indicators of biological processes, such as gene expression, reverse transcription, cellular differentiation, proliferation or apoptosis.1–5 The dysregulation of miRNA expressions is interrelated with human cancers, neurological diseases or viral infections,6–8 and miRNA serves as a biomarker for clinical diagnostics and drug delivery.9–13 Recently, a variety of SERS-based and fluorescence-based strategies have been developed for miRNA detection.14–16 However, these methods generally involved complicated preparation and low-sensitivity due to the one-target-one-trigger signal model.13,17 Fluorescence imaging of miRNA in living cells has great significance for the understanding of the functions and dynamics of diverse classes of cellular RNA encoded by the genome.18–21 It can be especially useful for the accurate and timely diagnosis and treatment of cancers.22–26 However, direct fluorescence imaging strategies are not suitable for imaging low-abundance miRNA owing to the relatively low sensitivity and insufficient background signal of traditional imaging probes designed on a “one-to-one” basis.27,28 Effective “one-to-many” signal amplification strategies for sensitive imaging of low-abundance miRNA in living cells are highly desirable.The enzyme-based rolling circle amplification (RCA) technique for the highly sensitive analysis of intracellular low-abundance miRNA has been developed,29,30 which indeed required the liposome-based complicated cellular delivery of enzymes or other agents. Several enzyme-free hybridization chain reaction (HCR) techniques for imaging low-abundance miRNA in living cells have also been explored,31 but the limited quantity of transfected probes may restrict the sensitivity. Recently, the strand-displacement cascade amplification (SDCA)32 system activated by an initiator DNA strand and powered by fuelling single-stranded DNA has provided great potential for intracellular nucleic acid detection.33 For example, a catalytic molecular imaging strategy has been developed for intracellular sensing using DNA as fuel.34 Very recently, a DNA walker moved extensively over microparticle surfaces35 and a miRNA-initiated DNAzyme motor36,37 has been developed for the amplified detection of low-abundance miRNA in living cells. However, all of the cascade processes require the additional transfection of external DNA fuels for continuous operation,38–40 which impels the engineering of more smart autonomous self-powered systems. ATP, the essential biogenic biomolecule in cells,41,42 can serve as a new fuel for powering the SDCA process, however, endogenous ATP is limited and the ATP self-powered SDCA process for intracellular miRNA detection has never been explored.
Herein, an ATP self-powered SDCA system of the Y-motif DNA structure modified mesoporous silica nanoparticle (mSiO2 NP)-coated CuS NPs loaded with numerous ATPs (CuS@mSiO2/Y-ATP) are constructed for the highly sensitive detection of low-abundance miRNA in living cells (Scheme 1). The rationally designed Y-motif DNA structures are modified on the surface of CuS@mSiO2 through a disulfide bond (–S–S–) with one terminal containing a folded DNA strand (rich in cytosine and guanine) to improve the encapsulation efficiency and reduce the cargo leakage. After cellular uptake, the folded DNA strands are unlocked by forming a C–G·C+ triplex DNA structure43–45 and accelerate the rupture of the disulfide bond (–S–S–) to release numerous ATPs in an acidic microenvironment. The near-infrared (NIR) laser irradiation further enhances ATP release due to the photothermal effect of the CuS core. The endogenous specific miRNAs initiate the corresponding strand displacement, and the endogenous and released ATP acts as fuel for SDCA, producing the corresponding fluorescence for miRNA target detection. Compared to previous reports, the ATP self-powered SDCA strategy provides a suitable tool for highly sensitive imaging of intracellular low-abundance miRNA without additional external catalytic fuel for intracellular miRNA analysis, enabling facile and accurate differentiation between normal cells and different types of cancer cell using intracellular miRNA imaging. To the best of our knowledge, this is the first exploration of an ATP self-powered SDCA strategy for the simultaneous detection of multiple miRNAs in living cells.
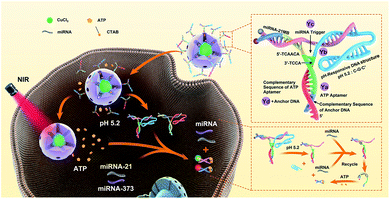 | ||
| Scheme 1 Schematic illustration of the imaging of multiple miRNAs in living cells using ATP self-powered strand-displacement cascade amplification. | ||
Results and discussion
Preparation and characterization of smart nanocarriers
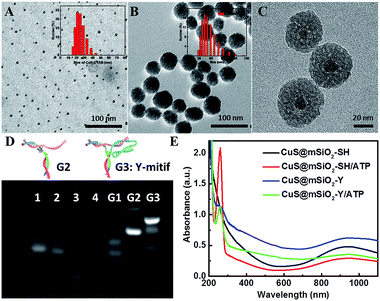
The transmission electron microscopy (TEM) image in Fig. 1A shows the synthetic cetyltrimethyl ammonium bromide (CTAB) coated CuS (CuS-CTAB) NPs with an average diameter of 7 nm, and the aqueous diameter determined with dynamic light scattering (DLS), which was 21 nm (inset in Fig. 1A). The steadily modified CTAB moiety facilitated mSiO2 shell formation and generated uniform CuS@mSiO2 NPs, which had an average diameter of 43 nm (Fig. 1B). High Resolution TEM (HRTEM) analysis (Fig. 1C) demonstrated a CuS NP core surrounded by an ordered mSiO2 phase with numerous cylindrical channels (pore sizes of 3.389 nm, in Fig. S1†), which is useful for cargo loading.Agarose gel electrophoresis analysis was performed to verify the assembly of the Y-motif DNA structure. As shown in Fig. 1D, lanes 1, 2, 3 and 4 were assigned to the Ya, Yb, Yc and Yd DNA single strands, respectively. Ya and Yc were annealed to form G1 (lane 5), and Yd was added to the G1 mixture at 40 °C to obtain G2 (lane 6). Then Yb was added into the G2 mixture at 37 °C to finally construct the Y-motif DNA structure (G3, lane 7). These results demonstrated that the desired DNA structures were generated at each stage for the formation of the Y-motif DNA structure. The UV-vis spectrum of CuS@mSiO2-Y/ATP presented the characteristic peaks assigned to the Y-motif DNA structure and ATP (Fig. 1E), demonstrating that the Y-motif DNA structure and ATP were successfully modified on the CuS@mSiO2-SH NPs. The ATP loading efficiency was 10.68% according to the calibration curve of the UV-vis absorbance of ATP at 258 nm vs. the concentration of ATP (Fig. S2†). Furthermore, the zeta potential and DLS were also employed to verify the self-assembly process of CuS@mSiO2-Y/ATP. As shown in Fig. S3,† the zeta potentials of CuS@mSiO2-CTAB and CuS@mSiO2-SH were about −16.3 mV and −18.3 mV, respectively. The surface zeta potential changed from −18.3 mV to −31.2 mV after the CuS@mSiO2-SH was loaded with negatively charged ATP. The introduction of the Y-motif DNA structure induced a zeta potential change to −26.0 mV, indicating the shielding of negative CuS@mSiO2-SH/ATP by the less negative outer Y-motif DNA structure. The DLS results were consistent with the size results of TEM (Fig. 1A and B), and the hydrodynamic size increased by 32.5 nm after CuS@mSiO2-SH/ATP was coated with the Y-motif DNA structure, also confirming the self-assembly process (Fig. S4†).
Optimization and feasibility of ATP-powered SDCA
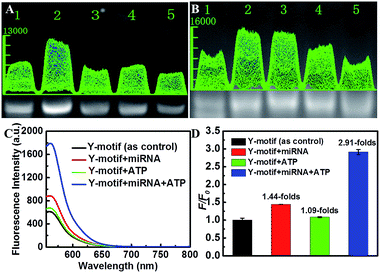
To optimize the hybridization efficiency of the Y-motif DNA structure, the ratio of the single DNA strands was investigated. Agarose gel electrophoresis revealed that the maximum hybridization efficiency of the Y-motif DNA structure was achieved when the ratio of Ya to Yc was 1![[thin space (1/6-em)]](https://www.rsc.org/images/entities/char_2009.gif) :
:![[thin space (1/6-em)]](https://www.rsc.org/images/entities/char_2009.gif) 2 (lane 2 in Fig. 2A). Moreover, the quantity of the Yb DNA strand significantly influenced the encapsulation efficiency, which was also further investigated. As shown in Fig. 2B, the hybridization efficiency of the Y-motif DNA structure reached the maximum value when the addition of the Yb strand was 10 nM, and a further increase of Yb induced a decrease of the hybridization efficiency resulting from the formation of Yb dimers at high concentration.
2 (lane 2 in Fig. 2A). Moreover, the quantity of the Yb DNA strand significantly influenced the encapsulation efficiency, which was also further investigated. As shown in Fig. 2B, the hybridization efficiency of the Y-motif DNA structure reached the maximum value when the addition of the Yb strand was 10 nM, and a further increase of Yb induced a decrease of the hybridization efficiency resulting from the formation of Yb dimers at high concentration.
Subsequently, the feasibility of the designed Y-motif DNA structure for the ATP-powered SDCA process was investigated using fluorescence intensity experiments (Fig. 2C). Compared to the control (black curve), the negligible fluorescence increase induced by ATP indicated that the ATP could almost not be recognized by the ATP aptamer in the absence of miRNA (green curve). On the contrary, miRNA could induce partial fluorescence recovery as a result of the hybridization of miRNA with the Y-motif DNA structure (red curve). The further addition of ATP to the mixture of miRNA and the Y-motif DNA structure caused a sharp fluorescence increase (blue curve), which suggested that the miRNA initiated-SDCA process could be efficiently powered by ATP in the SDCA process. We further verify the selectivity of the assay for miRNA detection (Fig. S5†). The fluorescence intensity of miRNA-21 was much higher than that produced by other miRNAs, indicating the good selectivity of the proposed detection strategy for discriminating the target miRNA from other miRNAs.
Released profiles of ATP from the smart nanocarrier
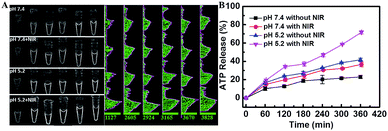
The mesoporous structure of the mSiO2 shell allowed the efficient loading of ATP. The ATP controllable release from the nanocarrier was another significant prerequisite for the SDCA process, which was systemically studied using an ATP Assay Kit (Fig. S6†). It displayed a typical pH-dependent release pattern; a larger cumulative ATP release was observed at pH 5.2 than at pH 7.4 (Fig. 3A and B). It resulted from the facilitated formation of the C–G·C+ triplex DNA structure and the rupture of –S–S– at the pH value of 5.2 to release the ATP. Furthermore, the 980 nm NIR laser (0.7 W cm−2, 3 min per hour) irradiation further enhanced the ATP release at both pH 5.2 and pH 7.4 due to the photothermal effect of the CuS core (Fig. S7 and S8†). In particular, the cumulative release of ATP reached up to 71.67% at the pH of 5.2 with NIR-laser irradiation, providing enough fuel to power the SDCA process for miRNA detection.Assay performance for imaging miRNAs in living cells
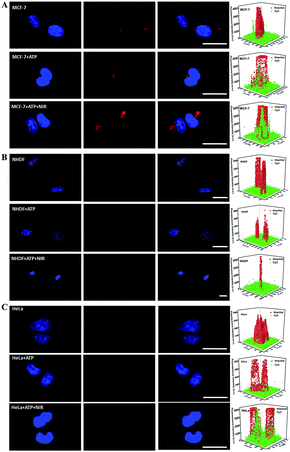
The good stability of nanomaterials in cell media containing serum is necessary for biomedical applications. The zeta potential of CuS@mSiO2-Y/ATP in PBS (pH 7.4, 10 mM) was −26.0 mV, and negligible changes were observed after mixing CuS@mSiO2-Y/ATP with FBS (−26.9 mV) (Fig. S3†), indicating the good stability of CuS@mSiO2-Y/ATP in biological media. The hydrodynamic size of CuS@mSiO2-Y/ATP was 91.3 nm, and the negligible size change and narrow size distribution of CuS@mSiO2-Y/ATP in serum (106 nm) also verified its good stability (Fig. S9†). The cytotoxicity of the prepared CuS@mSiO2-SH NPs was carefully evaluated in different cells and the NPs showed low cytotoxicity (Fig. S10†). Using miRNA-21 as a model, the SDCA strategy for highly sensitive imaging of low-abundance miRNAs in different living cells was investigated. As shown in Fig. 4, the CuS@mSiO2-Y treated MCF-7 cells presented red fluorescence due to the recognition of miRNAs by the Y-motif DNA structure and the endogenous ATP-powered SDCA process (Fig. 4A, row one). As a comparison, the fluorescence intensities of the CuS@mSiO2-Y/ATP-treated MCF-7 cells (Fig. 4A, row two) and the CuS@mSiO2-Y/ATP-treated MCF-7 cells (Fig. 4A, row three) irradiated with the NIR-laser were enhanced by 3.34-fold and 10.26-fold, respectively. This indicated that the loaded ATP effectively powered the SDCA process, and the NIR-irradiation further enhanced the ATP release for highly sensitive miRNA detection.Similar sensitivity improvements achieved by the ATP-powered SDCA process were observed for the NHDF cells (Fig. 4B) and HeLa cells (Fig. 4C). As shown in Fig. 4B, almost no red visible fluorescence signal was observed in the CuS@mSiO2-Y-treated NHDF cells due to the low expression of miRNA-21 in NHDF (Fig. 4B, row one), the CuS@mSiO2-Y/ATP-treated NHDF cells (Fig. 4B, row two) presented clear red fluorescence, and 14.8-fold more intense fluorescence could be observed in the CuS@mSiO2-Y/ATP-treated NHDF cells irradiated with the NIR-laser (Fig. 4B, row three). Interestingly, after undergoing the CuS@mSiO2-Y/ATP-mediated SDCA process, miRNA-21 revealed an obvious higher expression level in MCF-7 (Fig. 4A, row three) than in the HeLa cells (Fig. 4C, row three). These results demonstrated that the ATP self-powered SDCA process provided a facile and powerful tool to discriminate normal cells and different types of cancerous cell by miRNA imaging in living cells.
Generally, some significant cellular processes are regulated by multiple miRNAs collaboratively and simultaneously, especially in some cancer cells. Therefore, simultaneous imaging of multiple intracellular miRNAs is crucial for bioresearch and clinical diagnosis. However, the low-abundance and different expression levels of different miRNAs among different cells make it challenging to simultaneously image two types of miRNA in a single cell, which requires high sensitivity and a wide dynamic detection range of the assay.
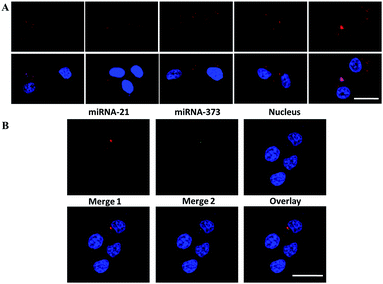
Therefore, the dynamic detection range was further studied by transfecting the MCF-7 cells with miRNA-21 mimics at different concentrations. The fluorescence intensity increased along with the quantity increase of the transfected miRNA-21 mimics ranging from 0 to 4 pg per cell (Fig. 5A), indicating the wide dynamic detection range. Two types of the Y-motif DNA structure were conjugated onto the nanocarrier and delivered into the cells to simultaneously image two types of cancer-related miRNA including miRNA-21 and miRNA-373. As shown in Fig. 5B, the red and green fluorescence were derived from the recognition of miRNA-21 and miRNA-373 by the ATP self-powered SDCA process, respectively. This clearly demonstrated the different spatial distribution of miRNA-21 and miRNA-373 and different expression levels in the MCF-7 cell. This revealed that this strategy was able to simultaneously image multiple miRNAs in living cells to potentially achieve early diagnosis of cancer with high accuracy.
Conclusions
In conclusion, we designed a Y-motif DNA structure functionalized on CuS@mSiO2 NPs loaded with numerous ATPs for highly sensitive simultaneous imaging of two types of miRNA in living cells through an ATP self-powered SDCA process. The Y-motif DNA structure was rationally designed and conjugated on the CuS@mSiO2 NPs via a pH stimulus-responsive disulfide bond for switchable ATP release, and the NIR-laser irradiation further enhanced the ATP release efficiency due to the photothermal effect of the CuS. The SDCA process could be initiated by specific endogenous target miRNAs and powered by the numerous ATPs released, providing a much higher sensitivity for intracellular imaging among different cell lines than that without amplification. This enables facile and accurate differentiation between normal cells and different types of cancer cell by intracellular miRNA imaging. The feasibility of the two-color simultaneous imaging of multiple cancer-related miRNAs in living cells was also confirmed. To the best of our knowledge, this is the first exploration of a smart autonomous self-powered SDCA system without additional external catalytic fuels for intracellular miRNA analysis, which potentially provides a reliable and powerful method for the early diagnosis of cancer with high accuracy.Experimental
Materials and reagents
Copper chloride (CuCl2) and sodium sulfide (Na2S) were purchased from Sinopharm Chemical Reagent Co., Ltd (Beijing, China). N-Cetyltrimethylammonium bromide (CTAB) and dimethyl sulfoxide (DMSO) were provided by Aladdin Industrial Co., Ltd (Shanghai, China). Tetraethyl orthosilicate (TEOS), 3-(4,5-dimethylthiozol-2-yl)-2,5-diphenyltetrazolium bromide (MTT), 2-[4-(2-hydroxyethyl)-1-piperazinyl] ethanesulfonic acid buffer solution (HEPES) and 3-mercaptopropyltrimethoxysilane (MPTES) were purchased from Sigma-Aldrich (China). The ATP Assay Kit was purchased from the Beyotime Institute of Biotechnology. All aqueous solutions in our research were prepared using ultrapure water obtained from a Millipore water purification system (≥18 MΩ, Milli-Q, Millipore). The DNA oligonucleotides in our experiment were purchased from Sangon Biological Engineering Technology & Services Co., Ltd. (Shanghai). And the RNA sequences were obtained from GenePharma (Shanghai). The sequences were as follows (5′- to 3′-):Ya(miRNA-21):
CGTACTATCAGGCAAGCTACACCTGGGGGAGTATTGCGGAGGAAGGTTCAACATCAGTCTGATAGTACG-Cy3
Yb(miRNA-21):
GGAGGGGAGGGGAGGTTATCCTCCCCTCCCCTCCCTTTGCCTCCCCTCCCCTCCGTACTCACCT
Yc(miRNA-21):
BHQ-TCGACTATCAGACTGATGCTCGAGTACGGAGGG
Yd(miRNA-21):
TCCTCCGCAATACTCCCCCAGGTGTAGCTTGCCTGATAGTACGTTTTTT-SH
miRNA-21 and miRNA-21 mimics:
UAGCUUAUCAGACUGAUGUUGA
Ya(miRNA-373):
CGTACCTTCGAGCAAGCTACACCTGGGGGAGTATTGCGGAGGAAGGTACACCCCAAAATCGAAGGTACG-Cy5
Yb(miRNA-373):
GGAGGGGAGGGGAGGTTATCCTCCCCTCCCCTCCCTTTGCCTCCCCTCCCCTCCGTACTCACCT
Yc(miRNA-373):
BHQ-TCGACCTTCGATTTTGTGCTCGAGTACGGAGGG
Yd(miRNA-373):
TCCTCCGCAATACTCCCCCAGGTGTAGCTTGCTCGAAGGTACGTTTTTT-SH
miRNA-373 and miRNA-373 mimics:
GAAGUGCUUCGAUUUUGGGGUGU
Synthesis of the CuS@mSiO2-SH nanoparticles
1 mL of CuCl2 (50 mM) and 1 mL of Na2S (50 mM) were added to 48 mL of the CTAB aqueous solution in a 100 mL three neck flask under stirring and magnetic stirring was maintained for 15 min. Then the solution was transferred into a 90 °C water bath under a moderate nitrogen flow and maintained for 1 h. Then we obtained CTAB stabilized CuS nanoparticles (CuS-CTAB NPs), a dark green homogeneous solution. The reaction temperature was cooled down to 70 °C and 94 mg of CTAB was added to the solution to make the final concentration of CTAB in the reaction system 2 mg mL−1. After stirring for 15 min, 350 μL of a 2 M NaOH solution and 200 μL of TEOS were added into the solution. Subsequently, 1 mL of ethyl acetate was rapidly injected into the mixture and was stirred for 3 h, forming a mesoporous silica layer on the CuS-CTAB NPs. Then the prepared product was centrifuged (13![[thin space (1/6-em)]](https://www.rsc.org/images/entities/char_2009.gif) 000 rpm, 30 min) and re-dispersed in ethanol under vigorous stirring for 48 h to remove the CTAB, obtaining the CuS@mSiO2 NP product. The resultant CuS@mSiO2 NPs were re-dispersed in 20 mL of absolute ethyl alcohol under stirring for 30 min. Subsequently, 400 μL of MPTES was added to modify the surfaces of the CuS@mSiO2 NPs with –SH groups. After a further 24 h of stirring, the prepared CuS@mSiO2-SH NPs were washed with ethanol and water several times, and were finally re-dispersed in ultrapure water for further use.
000 rpm, 30 min) and re-dispersed in ethanol under vigorous stirring for 48 h to remove the CTAB, obtaining the CuS@mSiO2 NP product. The resultant CuS@mSiO2 NPs were re-dispersed in 20 mL of absolute ethyl alcohol under stirring for 30 min. Subsequently, 400 μL of MPTES was added to modify the surfaces of the CuS@mSiO2 NPs with –SH groups. After a further 24 h of stirring, the prepared CuS@mSiO2-SH NPs were washed with ethanol and water several times, and were finally re-dispersed in ultrapure water for further use.
Construction of the nanocarrier CuS@mSiO2-Y/ATP
1 μL of the 100 μM Ya DNA strand, 2 μL of the 100 μM Yc DNA strand and 95 μL of Tris–HCl buffer (pH 7.4, 10 mM MgCl2) were added into a 100 μL PCR-tube and incubated at 95 °C for 5 min, and then sequentially cooled down to 65 °C, 60 °C, 55 °C, 50 °C, and 45 °C (each step for 5 min). When the temperature was cooled down to 40 °C, 1 μL of the Yd DNA strand (100 μM) was added into the mixture and it was maintained for 60 min. Then 1 μL of the 100 μM Yb DNA strand was added into the reaction system and incubated at 37 °C for 60 min. The Y-motif DNA structure was constructed and dispersed in Tris–HCl (pH 7.4) with a concentration of 1 μM for further use.4 mg of the CuS@mSiO2-SH NPs was dispersed in 13 mL of the PBS solution (10 mM, pH 7.4) containing 8 mg ATP and stirred for 24 h at a low temperature in the dark. The ATP-loaded CuS@mSiO2-SH (CuS@mSiO2-SH/ATP) was centrifuged (10![[thin space (1/6-em)]](https://www.rsc.org/images/entities/char_2009.gif) 000 rpm, 30 min) and washed three times with PBS (10 mM, pH 7.4) to remove the free ATP. The amount of loaded ATP for CuS@mSiO2-SH NPs was determined by a UV-vis spectrophotometer at 258 nm. The obtained CuS@mSiO2-SH/ATP was added into 1 mL of a HEPES (30 mM) buffer solution containing 75 μL of the Y-motif DNA structure (1 μM), and shaken gently for 24 h to construct the nanocarrier CuS@mSiO2-Y/ATP.
000 rpm, 30 min) and washed three times with PBS (10 mM, pH 7.4) to remove the free ATP. The amount of loaded ATP for CuS@mSiO2-SH NPs was determined by a UV-vis spectrophotometer at 258 nm. The obtained CuS@mSiO2-SH/ATP was added into 1 mL of a HEPES (30 mM) buffer solution containing 75 μL of the Y-motif DNA structure (1 μM), and shaken gently for 24 h to construct the nanocarrier CuS@mSiO2-Y/ATP.
In vitro ATP release from the CuS@mSiO2-SH NPs was performed in PBS (10 mM) at pH values of 5.2 and 7.4 with or without 980 nm NIR-laser irradiation. The CuS@mSiO2-Y/ATP was dispersed into the PBS solution at pH values of 5.2 or 7.4, and it was stirred in an ice-bath for ATP release. The CuS@mSiO2-Y/ATP samples were centrifuged every hour, and the supernatant solution was collected. The released percentage of ATP in the buffer at different time intervals was determined by the ATP Assay Kit (provided by the Beyotime Institute of Biotechnology).
Cytotoxicity tests of CuS@mSiO2-SH
MCF-7, NHDF and HeLa cells were cultured in a 96-well plate at a density of 104 cells per well for 24 h at 37 °C under 5% CO2 in DMEM. Then the cells were incubated with the Opti-MEM reduced serum medium containing different concentrations of CuS@mSiO2-SH (that ranged from 0 to 80 μg mL−1) for 4 h. Then, the solution was removed and the cells were washed three times using PBS (pH 7.4, 10 mM). Subsequently, 100 μL of the MTT solution (0.5 mg mL−1) was added to each well and incubated for 4 h. Finally, 100 μL of DMSO was transferred to the wells, and the absorbance was determined at 492 nm by an Anthos 2010 microplate reader (manufactured by Biochrom Ltd., Cambridge CB4 OFJ, England).MiRNA detection of CuS@mSiO2-Y/ATP in a single cell
MCF-7, NHDF and HeLa were seeded in glass bottom cell culture dishes (φ 20 mm) at 37 °C under an atmosphere containing 5% CO2 for 24 h in DMEM. Then, the cells were incubated with CuS@mSiO2-Y or CuS@mSiO2-Y/ATP solution in Opti-MEM serum medium. After 4 hours, the cells were cultured in a fresh medium for another 12 h with or without 980 nm NIR-laser irradiation, accomplishing the multiple miRNA-21/miRNA-373 detection in cells. Finally, the fluorescence signal for miRNA-21/miRNA-373 detection in the cells was imaged using a confocal laser scanning fluorescence microscope (FV1200, Olympus, Japan).Conflicts of interest
The authors declare no competing financial interest.Acknowledgements
The work was financially supported by the Special Foundation for the State Major Research Program of China (Grant No. 2016YFC0106602 and 2016YFC0106601); the National Natural Science Foundation of China (Grant No. 21645005 and 21475008); the Open Research Fund Program of the Beijing Key Lab of Plant Resources Research and Development, Beijing Technology and Business University (PRRD-2016-YB2).Notes and references
- H. Dong, J. Lei, L. Ding, Y. Wen, H. Ju and X. Zhang, Chem. Rev., 2013, 113, 6207–6233 CrossRef CAS PubMed.
- K. A. Cissell, Y. Rahimi, S. Shrestha, E. A. Hunt and S. K. Deo, Anal. Chem., 2008, 80, 2319–2325 CrossRef CAS PubMed.
- S. Campuzano, M. Pedrero and J. M. Pingarrón, Anal. Bioanal. Chem., 2014, 406, 27–33 CrossRef CAS PubMed.
- D. M. Zhou, W. F. Du, Q. Xi, J. Ge and J. H. Jiang, Anal. Chem., 2014, 86, 6763–6767 CrossRef CAS PubMed.
- R. I. Gregory, K. P. Yan, G. Amuthan, T. Chendrimada, B. Doratotaj, N. Cooch and R. Shiekhattar, Nature, 2004, 432, 235–240 CrossRef CAS PubMed.
- S. Bi, J. Zhang, S. Hao, C. Ding and S. Zhang, Anal. Chem., 2011, 83, 3696–3702 CrossRef CAS PubMed.
- G. L. Wang and C. Y. Zhang, Anal. Chem., 2012, 84, 7037–7042 CrossRef CAS PubMed.
- H. Dong, S. Jin, H. Ju, K. Hao, L.-P. Xu, H. Lu and X. Zhang, Anal. Chem., 2012, 84, 8670–8674 CrossRef CAS PubMed.
- C. Arenz, Angew. Chem., Int. Ed., 2006, 45, 5048–5050 CrossRef CAS PubMed.
- B. N. Johnson and R. Mutharasan, Analyst, 2014, 139, 1576–1588 RSC.
- R. Duan, X. Zuo, S. Wang, X. Quan, D. Chen, Z. Chen, L. Jiang, C. Fan and F. Xia, J. Am. Chem. Soc., 2013, 135, 4604–4607 CrossRef CAS PubMed.
- L. He, J. M. Thomson, M. T. Hemann, E. Hernando-Monge, D. Mu, S. Goodson, S. Powers, C. Cordon-Cardo, S. W. Lowe, G. J. Hannon and S. M. Hammond, Nature, 2005, 435, 828–833 CrossRef CAS PubMed.
- W. Ma, P. Fu, M. Sun, L. Xu, H. Kuang and C. Xu, J. Am. Chem. Soc., 2017, 139, 11752–11759 CrossRef CAS PubMed.
- J. Su, D. Wang, L. Norbel, J. Shen, Z. Zhao, Y. Dou, T. Peng, J. Shi, S. Mathur, C. Fan and S. Song, Anal. Chem., 2017, 89, 2531–2538 CrossRef CAS PubMed.
- X. Li, S. Ye and X. Luo, Chem. Commun., 2016, 52, 10269–10272 RSC.
- J. Zheng, D. Ma, M. Shi, J. Bai, Y. Li, J. Yang and R. Yang, Chem. Commun., 2015, 51, 16271–16274 RSC.
- W. Zhou, Y. F. Tian, B. C. Yin and B. C. Ye, Anal. Chem., 2017, 89, 6120–6128 CrossRef CAS PubMed.
- P. R. Bohländer, M. L. Abba, F. Bestvater, H. Allgayer and H. A. Wagenknecht, Org. Biomol. Chem., 2016, 14, 5001–5006 Search PubMed.
- Q. Lu, D. Ericson, Y. Song, C. Zhu, R. Ye, S. Liu, J. A. Spernyak, D. Du, H. Li and Y. Wu, ACS Appl. Mater. Interfaces, 2017, 9, 23325–23332 CAS.
- Z. M. Ying, Z. Wu, B. Tu, W. Tan and J. H. Jiang, J. Am. Chem. Soc., 2017, 139, 9779–9782 CrossRef CAS PubMed.
- J. Zheng, R. Yang, M. Shi, C. Wu, X. Fang, Y. Li, J. Li and W. Tan, Chem. Soc. Rev., 2015, 44, 3036–3055 RSC.
- S. R. Ryoo, J. Lee, J. Yeo, H. K. Na, Y. K. Kim, H. Jang, J. H. Lee, S. W. Han, Y. Lee and V. N. Kim, ACS Nano, 2013, 7, 5882–5891 CrossRef CAS PubMed.
- X. Zhao, L. Xu, M. Sun, W. Ma, X. Wu, H. Kuang, L. Wang and C. Xu, Small, 2016, 12, 4662–4668 CrossRef CAS PubMed.
- S. Li, L. Xu, M. Sun, X. Wu, L. Liu, H. Kuang and C. Xu, Adv. Mater., 2017, 29, 1606086 CrossRef PubMed.
- C. Jin, T. Fu, R. Wang, H. Liu, J. Zou, Z. Zhao, M. Ye, X. Zhang and W. Tan, Chem. Sci., 2017, 8, 7082–7086 RSC.
- L. He, D. Q. Lu, H. Liang, S. Xie, C. Luo, M. Hu, L. Xu, X. Zhang and W. Tan, ACS Nano, 2017, 11, 4060–4066 CrossRef CAS PubMed.
- H. Dong, W. Dai, H. Ju, H. Lu, S. Wang, L. Xu, S. F. Zhou, Y. Zhang and X. Zhang, ACS Appl. Mater. Interfaces, 2015, 7, 11015–11023 CAS.
- H. Dong, J. Lei, H. Ju, F. Zhi, H. Wang, W. Guo, Z. Zhu and F. Yan, Angew. Chem., Int. Ed., 2012, 51, 4607–4612 CrossRef CAS PubMed.
- Z. Zhang, Y. Wang, N. Zhang and S. Zhang, Chem. Sci., 2016, 7, 4184–4189 RSC.
- R. Deng, L. Tang, Q. Tian, Y. Wang, L. Lin and J. Li, Angew. Chem., Int. Ed., 2014, 53, 2389 CrossRef CAS PubMed.
- L. Li, J. Feng, H. Liu, Q. Li, L. Tong and B. Tang, Chem. Sci., 2016, 7, 1940–1945 RSC.
- D. Y. Zhang and G. Seelig, Nat. Chem., 2011, 3, 103–113 CrossRef CAS PubMed.
- D. Li, W. Zhou, R. Yuan and Y. Xiang, Anal. Chem., 2017, 89, 9934–9940 CrossRef CAS PubMed.
- X. He, T. Zeng, Z. Li, G. Wang and N. Ma, Angew. Chem., Int. Ed., 2016, 55, 3073–3076 CrossRef CAS PubMed.
- C. P. Liang, P. Q. Ma, H. Liu, X. G. Guo, B. Yin and B. C. Ye, Angew. Chem., Int. Ed., 2017, 56, 1–6 CrossRef.
- Y. Wu, J. Huang, X. Yang, Y. Yang, K. Quan, N. Xie, J. Li, C. Ma and K. Wang, Anal. Chem., 2017, 89, 8377–8383 CrossRef CAS PubMed.
- Y. Yang, H. Jin, X. Yang, X. He, Q. Ke, N. Xie, O. Min and K. Wang, Anal. Chem., 2017, 89, 5850–5856 CrossRef CAS PubMed.
- S. Yue, T. Zhao, S. Bi and Z. Zhang, Biosens. Bioelectron., 2017, 98, 234–239 CrossRef CAS PubMed.
- S. Bi, M. Chen, X. Jia, Y. Dong and Z. Wang, Angew. Chem., Int. Ed., 2015, 54, 8144–8148 CrossRef CAS PubMed.
- H. S. Yin, B. C. Li, Y. L. Zhou, H. Y. Wang, M. H. Wang and S. Y. Ai, Biosens. Bioelectron., 2017, 96, 106–112 CrossRef CAS PubMed.
- M. Ran, T. Jiang, R. Disanto, W. Tai and G. Zhen, Nat. Commun., 2014, 5, 3364 Search PubMed.
- R. Mo, T. Jiang and Z. Gu, Angew. Chem., Int. Ed., 2014, 53, 5815–5820 CrossRef CAS PubMed.
- A. Porchetta, A. Idili, A. Valléebélisle and F. Ricci, Nano Lett., 2015, 15, 4467–4471 CrossRef CAS PubMed.
- J. Ren, Y. Hu, C. H. Lu, W. Guo, M. A. García, F. Ricci and I. Willner, Chem. Sci., 2015, 6, 4190–4195 RSC.
- J. S. Kahn, L. Freage, N. Enkin, M. A. Garcia and I. Willner, Adv. Mater., 2017, 29, 1602782 CrossRef PubMed.
Footnote |
| † Electronic supplementary information (ESI) available: Additional documentation (6 figures) including pore size distribution, UV-vis spectra, chemiluminescence imaging, photothermal conversion efficiency, photothermal stability, infra-red thermal imaging, photoacoustic imaging, and MTT experiment. See DOI: 10.1039/c7sc04725h |
| This journal is © The Royal Society of Chemistry 2018 |

