 Open Access Article
Benchmarking lithium amide versus amine bonding by charge density and energy decomposition analysis arguments†
Felix
Engelhardt
a,
Christian
Maaß
a,
Diego M.
Andrada
*b,
Regine
Herbst-Irmer
 a and
Dietmar
Stalke
 *a
*a
aInstitut für Anorganische Chemie, Georg-August-Universität Göttingen, Tammannstraße 4, 37077 Göttingen, Germany
bKrupp-Chair of General and Inorganic Chemistry, Universität des Saarlandes, Campus Gebäude C4.1, 66123 Saarbrücken, Germany. E-mail: dstalke@chemie.uni-goettingen.de; diego.andrada@uni-saarland.de
First published on 8th February 2018
Abstract
Lithium amides are versatile C–H metallation reagents with vast industrial demand because of their high basicity combined with their weak nucleophilicity, and they are applied in kilotons worldwide annually. The nuclearity of lithium amides, however, modifies and steers reactivity, region- and stereo-selectivity and product diversification in organic syntheses. In this regard, it is vital to understand Li–N bonding as it causes the aggregation of lithium amides to form cubes or ladders from the polar Li–N covalent metal amide bond along the ring stacking and laddering principle. Deaggregation, however, is more governed by the Li←N donor bond to form amine adducts. The geometry of the solid state structures already suggests that there is σ- and π-contribution to the covalent bond. To quantify the mutual influence, we investigated [{(Me2NCH2)2(C4H2N)}Li]2 (1) by means of experimental charge density calculations based on the quantum theory of atoms in molecules (QTAIM) and DFT calculations using energy decomposition analysis (EDA). This new approach allows for the grading of electrostatic Li+N−, covalent Li–N and donating Li←N bonding, and provides a way to modify traditional widely-used heuristic concepts such as the −I and +I inductive effects. The electron density ρ(r) and its second derivative, the Laplacian ∇2ρ(r), mirror the various types of bonding. Most remarkably, from the topological descriptors, there is no clear separation of the lithium amide bonds from the lithium amine donor bonds. The computed natural partial charges for lithium are only +0.58, indicating an optimal density supply from the four nitrogen atoms, while the Wiberg bond orders of about 0.14 au suggest very weak bonding. The interaction energy between the two pincer molecules, (C4H2N)22−, with the Li22+ moiety is very strong (ca. −628 kcal mol−1), followed by the bond dissociation energy (−420.9 kcal mol−1). Partitioning the interaction energy into the Pauli (ΔEPauli), dispersion (ΔEdisp), electrostatic (ΔEelstat) and orbital (ΔEorb) terms gives a 71–72% ionic and 25–26% covalent character of the Li–N bond, different to the old dichotomy of 95 to 5%. In this regard, there is much more potential to steer the reactivity with various substituents and donor solvents than has been anticipated so far.
Introduction
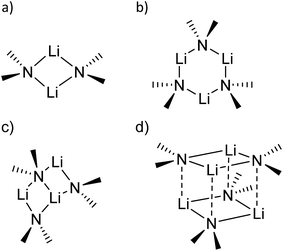
sec-Lithium amides (RR′NLi) have widespread applications as versatile reagents in synthetic inorganic and organic chemistry. This is because of the weak nucleophilicity of bulky lithium amides combined with a high basicity, making them excellent metallation reagents, even for vaguely acidic C–H bonds.1 Furthermore, lithium amides can serve as catalysts, e.g. in the hydro-amination reaction, as described by Hultzsch et al.2 Their reactivity is determined by their structure, which in turn is influenced by solvation, adjusting the aggregation.3 In 1971, Brown et al. had already investigated the aggregation of these lithium amide species.4 By recording NMR spectra of [LiN(SiMe3)2]n at varied temperatures in several donor solvents, Collum et al. described an equilibrium between the monomeric and dimeric forms.5 Reich emphasized their importance in various mechanistic scenarios.6 In 1986, Snaith and Mulvey et al. described a similarity in the aggregation behaviour of alkyl lithium compounds and lithium amides.7 Therein, they stated that a Li2N2 four-membered ring acts as the central building block for further aggregation to form cubes or ladders, in line with the ring stacking and laddering principle (Scheme 1).8These frameworks were shown to depend on the degree of solvation and on the steric bulk of the amide, which was confirmed by Mulvey et al. in their deaggregation studies of lithium anilide,9 ultimately yielding the dimeric form containing the Li2N2 moiety as the smallest aggregate in tetrahydrofuran.10 During our research into the effects of group 14 metal coordination11 by pincer type ligands,12 we were able to obtain crystals of [{(Me2NCH2)2(C4H2N)}Li]2 (1), [{(C4H8NCH2)2(C4H2N)}Li]2 (2) and [{(3,5-Me2(C5H8N)NCH2)2(C4H2N)}Li]2 (3) (Fig. 1). The crystal structures of 1 and 2 have been published earlier by Kuo et al.13 and Liu et al.,14 but the structure of 1 has so far only routinely been determined at room temperature.
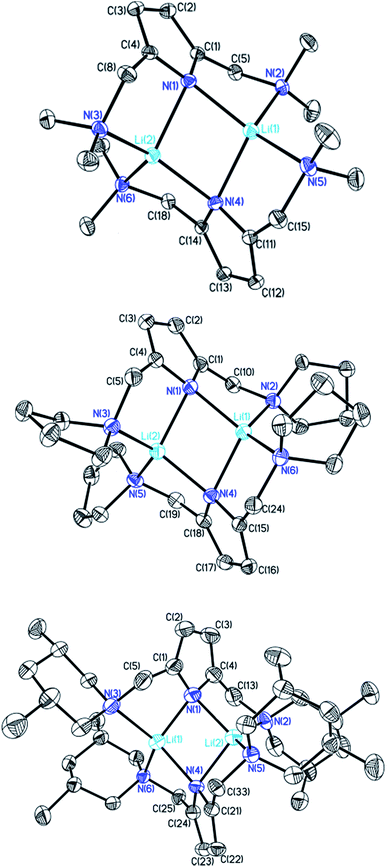 | ||
| Fig. 1 Crystal structures of compounds 1 (top), 2 (centre) and 3 (bottom). Thermal ellipsoids are depicted at the 50% probability level, and hydrogen atoms have been omitted for clarity. Selected bond lengths and angles of 1 and 2 are shown in Table 1. Compound 3 shows severe disorder of the whole molecule, which makes it impossible to analyse bond lengths and angles in any serious detail. | ||
Experimental charge density studies
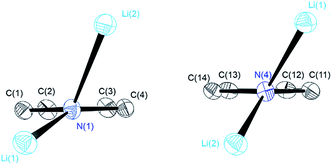
The central Li2N2 four-membered ring, common to all three compounds, represents the smallest unit (cf.Scheme 1a) for the previously mentioned laddering and stacking of the higher lithium amide aggregates. A closer inspection of the structural features is therefore worthwhile and was embarked upon in the current paper by means of charge density investigations.15 The most striking feature of the geometries is the prominent asymmetry within the central Li2N2 four-membered rings. Table 1 summarizes the bond lengths and angles of the Li–N bonds. In 1, the bond distances within the central moiety differ by 0.08 Å, from 2.0363(3) Å to 2.1212(3) Å. In addition, the Li–N–Li angles in the range of 76° to 78° are remarkably acute. While the Li–N bonds at N4 only slightly differ (N4–Li1 = 2.0705(3) Å and N4–Li2 = 2.0363(3) Å), the difference at N1 is much more pronounced (N1–Li1 = 2.0460(3) Å and N1–Li2 = 2.1212(3) Å). Furthermore, in a view with the pyrrole rings in the plane, it is evident that one lithium atom is closer to that ring plane than the other (see Fig. 2). The distances of the two lithium atoms to the plane containing N4 are relatively similar, and Li2 is only slightly closer to the plane ((N4 plane)⋯Li2 = 0.924 Å and (N4 plane)⋯Li1 = 1.298 Å). The difference is much more pronounced for the plane including N1. Li1 is much closer to the plane than Li2 ((N1 plane)⋯Li1 = 0.559 Å and (N1 plane)⋯Li2 = 1.522 Å). This asymmetric bonding geometry was already found earlier by us for primary amides. We attributed the widespread structural features to re-hybridization at the nitrogen atom from sp3 to sp2 (Scheme 2). Different to this, sp3 hybridized amidic nitrogen atoms with equally populated hybrid orbitals should give Li–N–Li bond angles close to 109° and equilateral Li2N2 four-membered rings, with the two substituents at the nitrogen atom located at the Li–N–Li bisection (Scheme 2a). An sp2 hybridization should give rise to a more distorted geometry.| Bond lengths (Å) and angles (°) | 1 | 2 | ||
|---|---|---|---|---|
| N1–Li1 | 2.0460(3) | (2.029) | 2.019(2) | (2.017) |
| N1–Li2 | 2.1212(3) | (2.029) | 2.083(2) | (2.039) |
| N4–Li1 | 2.0705(3) | (2.029) | 2.073(2) | (2.020) |
| N4–Li2 | 2.0363(3) | (2.029) | 2.013(2) | (2.031) |
| Li1–N1–Li2 | 76.468(12) | (75.9) | 76.32(9) | (76.5) |
| Li1–N4–Li2 | 77.822(12) | (75.9) | 76.67(9) | (76.6) |
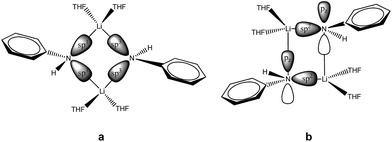 | ||
| Scheme 2 Possible orbital interactions within the Li2N2 four-membered ring building block of lithium amides. | ||
A shorter Li–N σ-bond is formed by the sp2 hybrid orbital within the plane of the amide, while the corresponding non-hybridized remaining p-orbital is involved with the longer Li–N bond towards the second lithium atom within the dimer. Obviously, this lithium atom is most dislocated from the amide plane when the p-orbital is involved in any Li–N bonding. As the pyrrolyl nitrogen atom in 1 is unequivocally sp2 hybridized, we anticipated bonding similar to that in Scheme 2b.
To check whether or not this asymmetry is a common motif in dimeric lithium amide structures, an extensive search in the Cambridge Structural Database (CSD)16 for all structures with a Li2N2 unit, not containing more than two lithium atoms, was carried out. 155 structures were found in version 5.37 of the CSD. For each nitrogen atom, d1 and d2 represent the two bond distances to lithium atoms 1 and 2, while d3 and d4 are calculated as the distances of lithium atoms 1 and 2 to the plane containing the nitrogen atom and its two next non-metallic bonding partners (see Fig. 4).
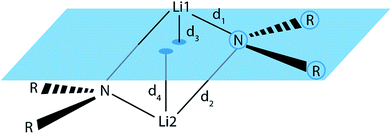 | ||
| Fig. 4 Definition of the Li–N bond distances, d1 and d2, and the distances d3 and d4 from the lithium atoms to the RNR plane. | ||
For the bonding situation outlined in Scheme 2b, we expect d1 and d2 to differ and the lithium atom with the shorter Li–N distance to be closer to the nitrogen plane. The latter would cause the differences d1 − d2 and d3 − d4 to have the same sign. Therefore, we plotted d1 − d2 against d3 − d4 (cf.Fig. 4). The correlation between these two values is calculated to be 0.491, and 118 data points (blue) fulfil our expectations while 37 (red) disagree (Fig. 5).
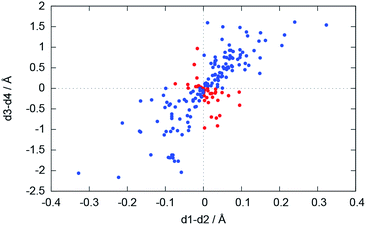 | ||
| Fig. 5 Plot of d1 − d2vs. d3 − d4. Blue dots represent database entries which are in agreement with the structure in Scheme 2b, and red dots represent entries which disagree. | ||
The nature of the Li–N bonds has also been the subject of several theoretical studies, mainly attributing purely17 or mostly ionic18–20 character to the bond. Following the idea of Maddaluno and Silvi et al.,17 who analysed lithium dimethyl amide as well as its dimer and related compounds within the ELF framework, a purely ionic interaction of a lithium cation with an sp3 hybridized nitrogen atom would result in identical bond lengths for all Li–N bonds in the dimeric species (cf.Scheme 2a).
Using population analysis, Schleyer, Pople et al.20 and Reed et al.19 proposed a more covalent bonding model for the monomeric lithium amide LiNH2 with a significant π overlap population for the lithium–nitrogen bond. This would imply sp2 hybridization at the nitrogen atom.9 Bonding like this would most likely result in the geometry proposed in Scheme 2b and is found for 71.5% of the Li2N2 entities in our CSD search. One lithium atom is located closer to the nitrogen atom and closer to the plane spanned by the nitrogen atom and the two non-metallic substituents (Scheme 2b).
To shed light on the nature of these lithium–nitrogen bonds from an experimental point of view, we recorded a high-resolution data set for 1. The unambiguous hybridization state of the bridging nitrogen atoms in 1 and the additionally present tertiary amine donor sites present an ideal starting point for this study.
The Hansen–Coppens multipole formalism21 was applied and the electron density (ED) of 1 was subsequently analysed within the quantum theory of atoms in molecules (QTAIM) framework.22 As the QTAIM framework is also applicable to EDs from theoretical calculations, we can complement our experimental results with results obtained from theory (for details regarding the theoretical calculations or the experimental details, see the ESI†).
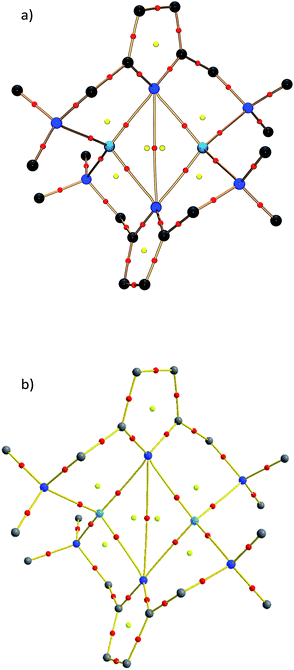
Within the QTAIM framework, a bonding interaction is linked to the existence of a line of maximum electron density ρ(r) (bond path)23 and of the atomic basins enclosed by so-called zero-flux surfaces. The minimum value of ρ along the bond path is called the bond critical point (BCP). Along with other critical points defining rings (ring critical point, RCP) and cages (cage critical point, CCP), this builds the first step towards describing the topology of molecules. The entirety of the critical points is described by the Poincaré–Hopf equation,24 which is fulfilled for both the theoretical and the experimental studies (see Fig. 6; for a full list of critical points including values of ρ(r) and ∇2ρ(r), see the ESI†). Both the experimental and theoretical molecular graphs show all of the expected features.25
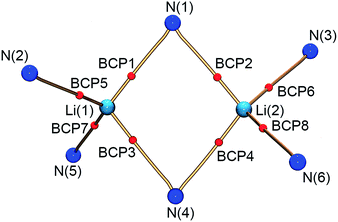 | ||
| Fig. 6 Molecular graph of the central Li2N2 ring and the amine nitrogen–lithium interactions (red spheres indicate bond critical points). | ||
The bonding situation in the central Li2N2 ring is best described in terms of ρ(r) and its second derivative, the Laplacian ∇2ρ(r). The Laplacian of the electron density indicates the local charge density concentrations (negative values of ∇2ρ(r)) and charge density depletions (positive values). Fig. 6 shows the found lithium–nitrogen bond paths obtained from the experimental structure. The bond critical points are in all cases shifted towards the more electropositive lithium atom. The results from theory exhibit the same features (see the ESI for details†). As can be seen from Table 2, the values of ρ(r) are minute, while ∇2ρ(r) adopts a positive sign. This is indicative of the considerably polarized bonds within the QTAIM. However, BCP1 and 4 exhibit slightly higher values in both ρ(r) and ∇2ρ(r). Also evident from Table 2 is the fact that the bond lengths, as well as the values for ρ(r) and ∇2ρ(r) at BCP2, lie closer to the values observed for the amine nitrogen atoms in the periphery (BCP5–BCP8). However, from the topological descriptors, there is no clear separation of the lithium amide bonds from the lithium amine donor bonds. So ρ(r) and ∇2ρ(r) at the bond critical point seem to be more dependent on the bond lengths than on the hybridization state. This further emphasizes the predominant electrostatic nature of any lithium–nitrogen bond, regardless of the level of σ, π or donor contribution.
| d/Å | Experimental | Theoreticala | ||||
|---|---|---|---|---|---|---|
| ρ(r)/eÅ−3 | ∇2ρ(r)/eÅ−5 | ρ(r)/eÅ−3 | ∇2ρ(r)/eÅ−5 | |||
| a Electron density computed at the BP86+D3(BJ)/def2-TZVPP level of theory on the frozen experimental geometry. | ||||||
| BCP1 | Li1–N1 | 2.0460(3) | 0.139(1) | 4.085(10) | 0.184 | 3.891 |
| BCP2 | Li2–N1 | 2.1212(3) | 0.116(1) | 3.254(7) | 0.148 | 3.113 |
| BCP3 | Li1–N4 | 2.0705(3) | 0.132(1) | 3.784(8) | 0.171 | 3.588 |
| BCP4 | Li2–N4 | 2.0363(3) | 0.148(1) | 4.195(7) | 0.187 | 3.956 |
| BCP5 | Li1–N2 | 2.1165(3) | 0.122(1) | 3.557(6) | 0.162 | 3.266 |
| BCP6 | Li2–N3 | 2.1169(3) | 0.121(1) | 3.549(5) | 0.163 | 3.227 |
| BCP7 | Li1–N5 | 2.1315(3) | 0.116(1) | 3.404(5) | 0.157 | 3.113 |
| BCP8 | Li2–N6 | 2.1033(3) | 0.126(1) | 3.687(5) | 0.168 | 3.389 |
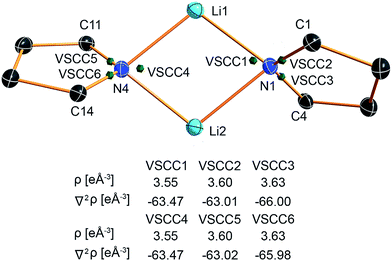
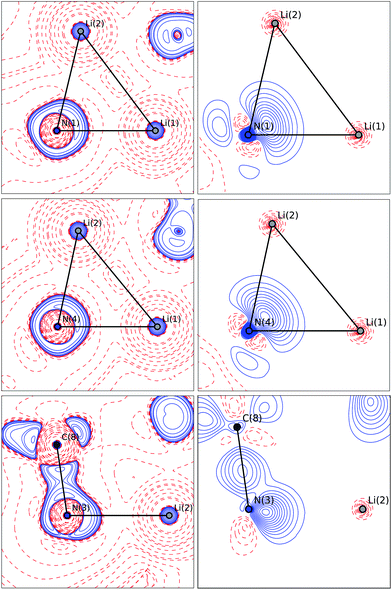
The valence shell charge concentrations (VSCCs) are critical points in the Laplacian. Two types of VSCC can be distinguished: bond- and non-bond-directed ones. The non-bond-directed VSCCs are typically associated with regions where lone pairs are expected. For 1, three VSCCs at the nitrogen N1 and N4 atoms are anticipated and confirmed: two bonded VSCCs facing the adjacent carbon atoms, and one non-bonded VSCC. The non-bonded VSCC at N1 is almost directly facing Li1, indicating that the highest charge concentration along the Li1–N1 path is directed away from Li2, consistent with the smallest values for ρ(r) and ∇2ρ(r) at the BCP of the longest Li–N distance in the molecule. In contrast, the VSCC of N4 is directed towards the Li1–N4–Li2 bisector (cf.Fig. 7), consistent with the smaller difference of the bond lengths Li1–N4 and Li2–N4. From this, N1 more closely mimics the bonding situation in Scheme 2b, while N4 is more similar to the dual bisecting bonding in Scheme 2a. In Fig. 8, plots of the deformation density and the Laplacian of the electron density for N1, N4 and N3 are shown. In the plots of ∇2ρ(r), the same tendency as discussed previously can be seen. The region of maximum charge density concentration is, for N1, shifted towards Li1. The same is true for the deformation density of N1 and N4. However, the differences are less pronounced compared to the Laplacian. Both of the nitrogen atoms however show the typical signs of sp2 hybridisation. This is especially evident when compared to the sp3 hybridized nitrogen atom N3 (Fig. 8, bottom).
Computational investigations
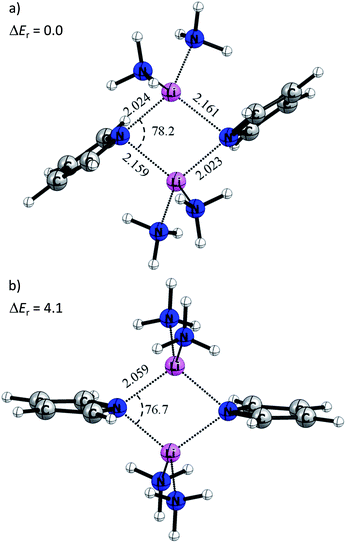
Quantum chemical calculations at the BP86+D3(BJ)/def2-TZVPP level of theory have been carried out to gain more insight into the electronic structure and the various energy contributions in these compounds (computational details are in the ESI†). Table 1 shows selected bond lengths and angles of the cyclic Li2N2 core of the calculated equilibrium structures of 1 and 2. In general, the theoretical values agree that the gas-phase optimized structure is predicted to be symmetric with N–Li bond distances of 2.029 Å, while compound 2 shows reduced asymmetry compared that determined experimentally, i.e. 2.017 Å (or 2.020 Å) and 2.039 Å (or 2.031 Å).This difference indicates that the asymmetry observed in the X-ray structures might be induced by the solid state arrangement restraining the flat potential energy surface. In order to understand the origins of the Li–N bond length differences, a model system where the methylene bridges of the pincer ligands were omitted was used (4M). In this case, the pyrrole ring is not attached to any amine groups. The amine donors would not superimpose their steric requirements on the overall structure, providing maximum flexibility.
Fig. 9a displays the optimized structure of 4M without any symmetry constraints. Clearly, the structure is similar to the situation described in Scheme 2b. The lone pairs on the sp2 orbital of the pyrrole nitrogen are pointing toward the lithium atoms, giving a strong interaction and a Li–N distance of 2.023 Å, while the pz lone pair gives a weaker interaction with a Li–N bond length of 2.161 Å. It is noteworthy that the ammonia molecules retain a similar position, like the donating side-arms in complexes 1 and 2. We also optimized the model systems (5M) with a D2h symmetry constraint (Fig. 9b). Here the pyrrole rings mimic the ideal geometry in Scheme 2a. The computed energy difference (ΔEr) between 4M and 5M is 4.1 kcal mol−1. This relatively low energy penalty can then be easily compensated by the methylene-bridged N-donors.
Fig. 10 shows the most important molecular orbitals of 1 (for an extended list of molecular orbitals, see the ESI†). As expected, the nitrogen atoms adopt sp2 hybridization (HOMO−9 and HOMO−8) where pz is compromised with the ring π system (HOMO−3 and HOMO−2). The molecular orbitals suggest that there is a donation of electron density from the nitrogen atoms to the lithium atoms. Indeed, the computed natural partial charges (in Table 3) are around +0.58 electrons. However, the Wiberg bond orders suggest a very weak bonding character.
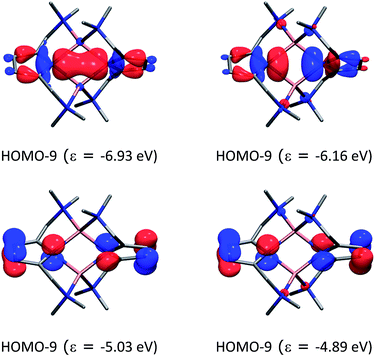 | ||
| Fig. 10 Molecular orbitals of compound 1 and their energies (in eV) at the BP86+D3(BJ)/def2-TZVPP level of theory. The hydrogen atoms were omitted for clarity. | ||
| Q or P | 1 | 2 |
|---|---|---|
| Q(Li1) | +0.58 | +0.59 |
| Q(Li2) | +0.58 | +0.54 |
| Q(N1) | −0.61 | −0.61 |
| Q(N2) and Q(N3) | −0.43 | −0.43 |
| Q(N4) | −0.68 | −0.61 |
| Q(N5) and Q(N6) | −0.43 | −0.43 |
| P(Li–Li) | 0.06 | 0.06 |
| P(Li1–N1) | 0.14 | 0.14 |
| P(Li2–N1) | 0.14 | 0.12 |
| P(Li1–N4) | 0.14 | 0.15 |
| P(Li2–N4) | 0.14 | 0.13 |
| P(Li1–N2) and P(Li1–N5) | 0.08 | 0.07 |
| P(Li2–N3) and P(Li2–N6) | 0.08 | 0.08 |
Energy decomposition analysis (EDA) was performed in order to unravel the nature of the interaction between the Li atoms and the pincer molecules.28 EDA has proven to be a powerful tool for improving the understanding of chemical bonding in main group compounds and transition metal compounds.29 Within this method, the bond formation between two or more interacting fragments is divided into three steps (for further details, see the ESI†). In the first step, the fragments, which are calculated using the frozen geometries within the entire molecule, are placed into the molecule disposition without electronic relaxation to yield the electrostatic interaction (ΔEelstat). In the second step, the wave function is anti-symmetrized and re-normalized giving the Pauli repulsion within the fragments (ΔEPauli). In the third step, the molecular orbitals relax into the final state to yield the stabilizing orbital term (ΔEorb). Also, the stabilizing dispersion interaction can be computed (ΔEdisp). The sum of all the terms gives the total interaction energy ΔEint. The dissociation energy can be calculated by combining the interaction energy together with the preparation energy (ΔEprep), which is the energy needed to promote the fragments from their equilibrium geometry to the geometry and electronic state in the compounds. Notably, in the present system, many fragmentation schemes can be envisioned to form 1 and 2. We performed EDA calculations to select the fragments (C4H2N)22− and Li22+ as the interaction can be cleanly evaluated. The numerical results are presented in Table 4.
| 1 | 2 | |
|---|---|---|
| a The value in parentheses gives the percentage contribution to the total attractive interactions, ΔEelstat + ΔEorb + ΔEdisp. b The value in parentheses gives the percentage contribution to the total orbital interactions ΔEorb. | ||
| ΔEint | −627.5 | −630.4 |
| ΔEPauli | 71.7 | 71.2 |
| ΔEdispa | −18.1 (2.6) | −19.7 (2.8) |
| ΔEelstata | −502.5 (71.9) | −499.5 (71.2) |
| ΔEorba | −178.5 (25.5) | −182.4 (26.0) |
| ΔEorbρ(1)b | −19.7 (11.0) | −21.3 (11.7) |
| ΔEorbρ(2)b | −20.3 (11.4) | −19.7 (11.0) |
| ΔEorbρ(3)b | −16.5 (9.2) | −16.1 (9.0) |
| ΔEorbρ(4)b | −15.2 (8.5) | −13.9 (7.8) |
| ΔEorbρ(5)b | −14.4 (8.1) | −14.0 (7.8) |
| ΔEorbρ(6)b | −14.1 (7.9) | −12.4 (6.9) |
| ΔEorbρ(7)b | −11.0 (6.2) | −10.4 (5.8) |
| ΔEorbρ(8)b | −8.4 (4.7) | −7.7 (4.3) |
| ΔEorbρrestb | −58.9 (33.0) | −66.9 (37.5) |
| ΔEprep | 211.5 | 209.5 |
| −De = ΔE | −416.0 | −420.9 |
The interaction energy between the two pincer molecules, (C4H2N)22−, with the Li22+ moiety is very strong, i.e. −627.5 and −630.4 kcal mol−1 for compounds 1 and 2, respectively. The bond dissociation energy (De) follows the same trend, being −416.0 for 1 and −420.9 kcal mol−1 for 2. The preparation energy (ΔEprep) is important in order to take into account the energy required to bring together on the one hand the two positively charged lithium atoms, and on the other hand the two negatively charged pincers. Interestingly, splitting the interaction term into the dispersion (ΔEdisp), electrostatic (ΔEelstat) and orbital (ΔEorb) terms gives relevant information. The bond interaction is around 71–72% ionic and 25–26% covalent, which gives a different perspective to the old dichotomy.7,8 The dispersion is minute and only 2% of the stabilizing contributions. Although not the strongest contribution, the covalent contribution (ΔEorb) is pronounced in absolute numbers by ca. −180.0 kcal mol−1. This is in good agreement with the presence of the bond paths found by QTAIM analysis.
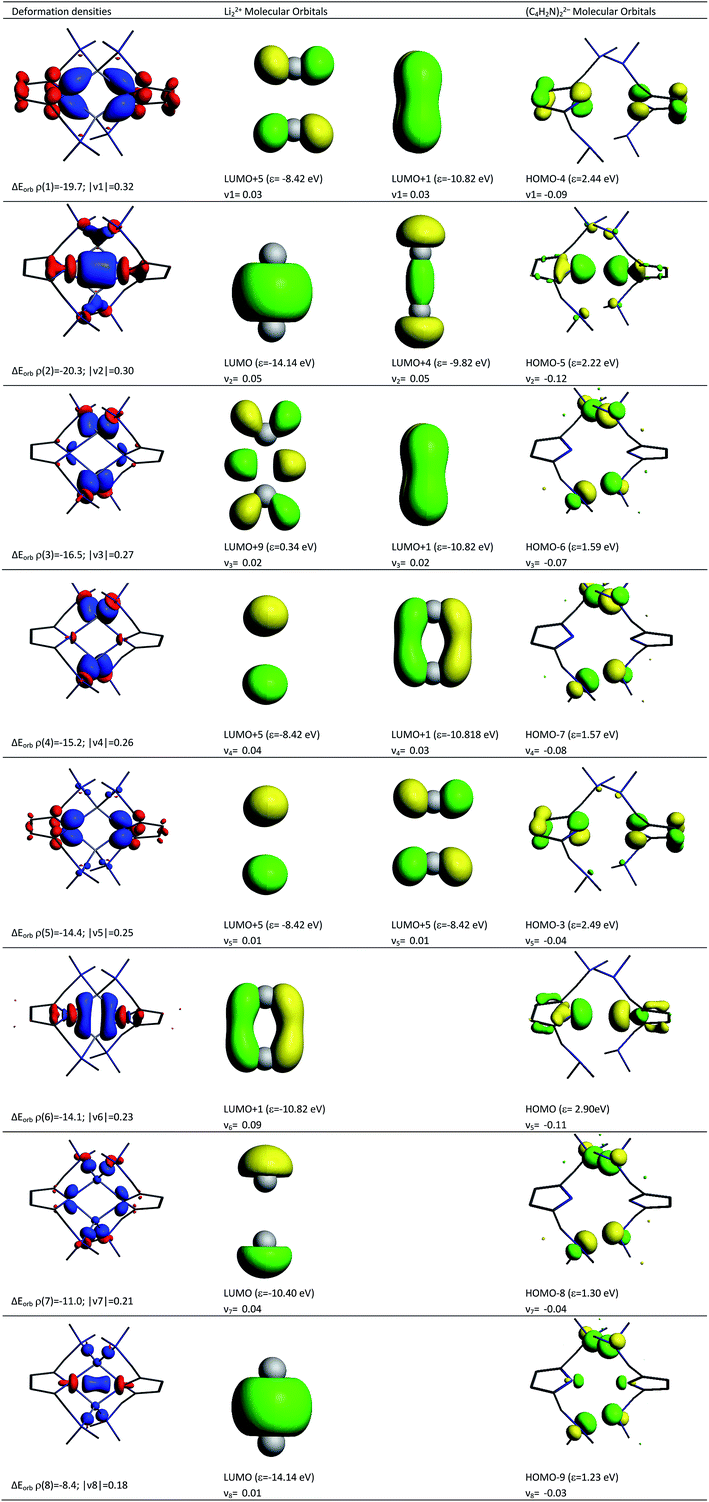
Deeper insights into the nature of the covalent interaction are available from EDA in combination with natural orbitals for chemical valence calculations (EDA-NOCV).30 This method deconstructs the orbital term (ΔEorb) into components (ΔEorbρ(i)) that provide an energetic estimation of a given deformation density (ρ(i)), which is related to a particular electron flow channel, and consequently the amount of charge transferred, Δq(i) = |ν(i)|, for the bonding between the interacting fragments. Table 4 summarizes the strongest eight contributions to the orbital term. It can be seen that the values of the orbital terms are the results of several small contributions where the strongest is only slightly above −20 kcal mol−1. The deformation densities of 1, which are associated with the orbital interactions, are shown in the first column of Fig. 11 (see Fig S5† for those of 2). The colour coding (red → blue) illustrates the direction of charge flow. A nice feature of the EDA-NOCV method is that it not only provides numerical results, but also that the change in the electronic structure, which is associated with the orbital interactions, can be visualized. The eigenvalues ν1–ν8 are a measure of the size of the charge alteration, which does always correlate with the strength of the orbital interactions. The second and third column of Fig. 11 display the orbitals of the fragments, responsible for each deformation density, and the amount of electrons which are donated.
According to the data in Fig. 11, four of the contributions result from the donation of lone pairs from the amine atoms of the pincer side arms into the empty orbitals of the lithium system, such as ρ(3), ρ(4), ρ(7) and ρ(8). The resulting deformation densities are the four different combinations possible for the lone pairs. The corresponding energies are not very high (ΔEorb = 16.5–8.4 kcal mol−1) and the charge flows associated are not significant (|ν(i)| = 0.27–0.18). This is expected for interactions with a weak covalent character. Interestingly, the sp2 lone pairs of the pyrrole nitrogen atoms can be distinguished as two clear contributions. On the one hand, ρ(2) comes from the positive combination of the lone pairs (+, +) which interact with the empty σ orbital between the Li atoms. On the other hand, ρ(6) shows a charge flow of a (+, −) contribution into the vacant π system of Li22+. The main list of orbital terms of EDA-NOCV is completed by the interaction of the pz orbitals at the pyrrole nitrogen atoms associated with ρ(1) and ρ(5). ρ(1) is the pz (+, −) orbital combination which interacts with the π* orbitals of Li22+ and presents a strong orbital term energy ΔEorb of ρ(1) = −19.7 kcal mol−1. The ρ(5) is associated to the interaction to the (+, −) pz orbitals of pyrrole ring orbitals and the π* orbitals of Li22+. The deformation densities ρ(1), ρ(2), ρ(5) and ρ(6) suggest a strong polarization within the pyrrole rings as well as an accumulation of electron density between these N atoms and the Li cations, supporting the QTAIM model presented in Fig. 3.
Conclusions
The current paper opens up the avenue to gradually modify the aggregation and hence the reactivity of lithium amides in a N-donating environment. We deconvoluted the polar Li–N covalent metal amide bonds from the Li←N amine donor bonds in [{(Me2NCH2)2(C4H2N)}Li]2 (1). σ- and π-bonding contributes to the covalent bond. The combination of experimental charge density investigations based on the quantum theory of atoms in molecules (QTAIM) and DFT based on energy decomposition analysis (EDA) facilitates the quantification of either energy share. The electron density ρ(r) and its second derivative, the Laplacian ∇2ρ(r), recover the molecular graph and mirror the asymmetry in the Li2N2 four-membered ring. Most remarkably, from the topological descriptors, there is no clear separation of the lithium amide bonds from the lithium amine donor bonds. The computed natural partial charges for lithium are only +0.58, indicating an optimal density supply from the four nitrogen atoms, while the Wiberg bond orders of about 0.14 suggest very weak bonding. The interaction energy between the two (C4H2N)22− pincer molecules and the Li22+ moiety is very strong (ca. −628 kcal mol−1), followed by the bond dissociation energy (−420.9 kcal mol−1). Partitioning the interaction term into the dispersion (ΔEdisp), electrostatic (ΔEelstat) and orbital (ΔEorb) terms gives a 71–72% ionic and 25–26% covalent character of the Li–N bond, different to the old dichotomy of 95 to 5%. The latter left only a little space and motivation for modifying covalent Li–N bonding and hence aggregation and reactivity. Knowing now that the bonding capacity of a neutral amine is on par with the amide donor bond pushes the door wide open to grade ionic Li+N–, covalent Li–N and donating Li←N bonding in connection to σ- and π-bonding by substituent and solvent permutation. We are currently trying to identify a benchmark protocol in organic synthesis to scale the various bonding features with different levels of reactivity.Experimental details
Shock cooled crystals were selected from a Schlenk flask under argon atmosphere using the X-TEMP2 device.31 The data were collected on a Bruker D8 Ultra diffractometer equipped with a molybdenum Turbo X-ray Source (TXS) rotating anode generator and INCOATEC Helios mirror optics and integrated with SAINT.32 A multi-scan absorption correction (SADABS) was applied.33 The structures were solved by direct methods (SHELXT)34 and refined on F2 using the full-matrix least-squares methods of SHELXL35 within the SHELXLE GUI.36 Multipole model refinement was carried out with the XD2006 program suite.26 The data were corrected for resolution- and temperature-dependent errors using the method of Niepötter et al.37 To obtain the best refinement strategy, the cross-validation method proposed by Krause et al. was employed.27 More details about the crystallographic data and the refinement can be found in the ESI.†Conflicts of interest
There are no conflicts to declare.Acknowledgements
Thanks to the Danish National Research Foundation (DNRF93) funded Centre for Materials Crystallography (CMC) for partial support and the federal state of Lower Saxony, Germany for providing a fellowship in the CaSuS PhD program.Notes and references
- (a) M. F. Lappert, Metal and metalloid amides, Ellis Horwood, Chichester, 1980 Search PubMed; (b) B. J. Wakefield, Organolithium methods, Academic Press, London, 2nd edn, 1994 Search PubMed; (c) R. Neufeld, M. John and D. Stalke, Angew. Chem. Int. Ed., 2015, 54, 6994–6998 ( Angew. Chem. , 2015 , 127 , 7100–7104 ) CrossRef CAS PubMed; (d) R. Neufeld, R. Michel, R. Herbst-Irmer, R. Schöne and D. Stalke, Chem.−Eur. J., 2016, 22, 12340 CrossRef CAS PubMed; (e) T. Rathman and J. Schwindeman, Org. Process Res. Dev., 2014, 18, 1192 CrossRef CAS; (f) R. E. Mulvey and S. D. Robertson, Angew. Chem. Int. Ed., 2013, 52, 11470 ( Angew. Chem. , 2013 , 125 , 11682–11700 ) CrossRef CAS PubMed; (g) E. Carl and D. Stalke, Structure-Reactivity Relationship in Organolithium Compounds, in Lithium Compounds in Organic Synthesis – From Fundamentals to Applications, ed. R. Luisi and V. Capriati, Wiley-VCH, Weinheim 2014, pp. 1–31 Search PubMed.
- P. H. Martínez, K. C. Hultzsch and F. Hampel, Chem. Commun., 2006, 2221 RSC.
- M. F. Lappert, M. J. Slade, A. Singh, J. L. Atwood, R. D. Rogers and R. Shakir, J. Am. Chem. Soc., 1983, 105, 302 CrossRef CAS.
- B. Y. Kimura and T. L. Brown, J. Organomet. Chem., 1971, 26, 57 CrossRef CAS.
- (a) P. Zhao and D. B. Collum, J. Am. Chem. Soc., 2003, 125, 14411 CrossRef CAS PubMed; (b) B. L. Lucht and D. B. Collum, Acc. Chem. Res., 1999, 32, 1035 CrossRef CAS; (c) T. F. Briggs, M. D. Winemiller, D. B. Collum, R. L. Parsons, A. H. Davulcu, G. D. Harris, J. M. Fortunak and P. N. Confalone, J. Am. Chem. Soc., 2004, 126, 5427 CrossRef CAS PubMed; (d) G. J. Reyes-Rodríguez, R. F. Algera and D. B. Collum, J. Am. Chem. Soc., 2017, 139, 1233 CrossRef PubMed; (e) P. F. Godenschwager and D. B. Collum, J. Am. Chem. Soc., 2007, 129, 12023 CrossRef CAS PubMed.
- H. J. Reich, Chem. Rev., 2013, 113, 7130 CrossRef CAS PubMed.
- D. R. Armstrong, D. Barr, W. Clegg, R. E. Mulvey, D. Reed, R. Snaith and K. Wade, J. Chem. Soc., Chem. Commun., 1986, 869 RSC.
- K. Gregory, P. v. R. Schleyer and R. Snaith, Adv. Inorg. Chem., 1991, 37, 47 CrossRef CAS.
- R. v. Bülow, H. Gornitzka, T. Kottke and D. Stalke, Chem. Commun., 1996, 37, 1639 RSC.
- W. Clegg, L. Horsburgh, F. M. Mackenzie and R. E. Mulvey, J. Chem. Soc., Chem. Commun., 1995, 111, 2011 RSC.
- C. Maaß, D. M. Andrada, R. A. Mata, R. Herbst-Irmer and D. Stalke, Inorg. Chem., 2013, 52, 9539 CrossRef PubMed.
- (a) C. J. Moulton and B. L. Shaw, J. Chem. Soc., Dalton Trans., 1976, 1020 RSC; (b) G. van Koten, J. T. B. H. Jastrzebski, J. G. Noltes, A. L. Spek and J. C. Schoone, J. Organomet. Chem., 1978, 148, 233 CrossRef CAS.
- P.-C. Kuo, J.-C. Chang, W.-Y. Lee, H. M. Lee and J.-H. Huang, J. Organomet. Chem., 2005, 690, 4168 CrossRef CAS.
- Q. Liu, Z. Guo, H. Han, H. Tong and X. Wei, Polyhedron, 2015, 85, 15 CrossRef CAS.
- (a) Electron Density and Chemical Bonding I. Experimental Charge Density Studies, ed. D. Stalke, Springer Berlin Heidelberg, Berlin, Heidelberg, 2012, vol. 146 Search PubMed; (b) Electron Density and Chemical Bonding II. Theoretical Charge Density Studies, ed. D. Stalke, Springer Berlin Heidelberg, Berlin, Heidelberg, 2012, vol. 147 Search PubMed; (c) D. Stalke, Chem.−Eur. J., 2011, 17, 9264 CrossRef CAS PubMed; (d) The chemical bond. Fundamental aspects of chemical bonding, ed. G. Frenking and S. S. Shaik, Wiley-VCH Verlag, Weinheim, 2014 Search PubMed; (e) The Chemical Bond. Chemical Bonding Across the Periodic Table, ed. G. Frenking and S. S. Shaik, Wiley-VCH Verlag GmbH & Co. KGaA, Weinheim, Germany, 2014 Search PubMed; (f) C. Gatti and P. Macchi, Modern Charge-Density Analysis, Springer, Netherlands, s. l, 1st edn, 2012 Search PubMed.
- C. R. Groom, I. J. Bruno, M. P. Lightfoot and S. C. Ward, Acta Crystallogr., Sect. B: Struct. Sci., Cryst. Eng. Mater., 2016, 72, 171 CrossRef CAS PubMed.
- C. Fressigné, J. Maddaluno, C. Giessner-Prettre and B. Silvi, J. Org. Chem., 2001, 66, 6476 CrossRef.
- (a) J. B. Collins and A. Streitwieser, J. Comput. Chem., 1980, 1, 81 CrossRef CAS; (b) D. R. Armstrong, D. Barr, W. Clegg, S. M. Hodgson, R. E. Mulvey, D. Reed, R. Snaith and D. S. Wright, J. Am. Chem. Soc., 1989, 111, 4719 CrossRef CAS; (c) E. U. Wuerthwein, K. D. Sen, J. A. Pople and P. v. R. Schleyer, Inorg. Chem., 1983, 22, 496 CrossRef CAS; (d) A. Hinchliffe and J. Charles Dobson, Theor. Chim. Acta, 1975, 39, 17 CrossRef CAS; (e) A. L. Hinde, A. Pross and L. Radom, J. Comput. Chem., 1980, 1, 118 CrossRef CAS; (f) A. Hinchliffe, Chem. Phys. Lett., 1977, 45, 88 CrossRef CAS.
- A. E. Reed, R. B. Weinstock and F. Weinhold, J. Chem. Phys., 1985, 83, 735 CrossRef CAS.
- J. D. Dill, P. v. R. Schleyer, J. S. Binkley and J. A. Pople, J. Am. Chem. Soc., 1977, 99, 6159 CrossRef CAS.
- (a) N. K. Hansen and P. Coppens, Acta Crystallogr., Sect. A: Cryst. Phys., Diffr., Theor. Gen. Crystallogr., 1978, 34, 909 CrossRef; (b) P. Coppens, X-ray charge densities and chemical bonding, International Union of Crystallography, Chester, England, Oxford, New York, 1997, vol. 4 Search PubMed.
- R. F. W. Bader, Atoms in molecules. A quantum theory, Clarendon Press, Oxford, 2003, vol. 22 Search PubMed.
- (a) R. F. W. Bader, J. Phys. Chem. A, 1998, 102, 7314 CrossRef CAS; (b) A. M. Pendás, E. Francisco, M. A. Blanco and C. Gatti, Chem.−Eur. J., 2007, 13, 9362 CrossRef PubMed.
- H. Hopf, Math. Ann., 1927, 96, 209 CrossRef.
- In fact, we were also able to observe a bond path linking N(1) and N(4). This will not be discussed because of the very small value and the close vicinity of the RCPs, which indicates that this geometry is close to a catastrophe point where these critical points coincide.38 However, these kinds of BCP are not uncommon. Stalke et al.39 as well as Zhurova et al.40 already reported on trans annular N⋯N interactions.
- A. Volkov, P. Macchi, L. J. Farrugia, C. Gatti, P. Mallinson, T. Richter and T. Koritsanszky, XD2006, 2006 Search PubMed.
- L. Krause, B. Niepötter, C. J. Schürmann, D. Stalke and R. Herbst-Irmer, IUCrJ, 2017, 4, 420 CAS.
- (a) K. Morokuma, J. Chem. Phys., 1971, 55, 1236 CrossRef CAS; (b) T. Ziegler and A. Rauk, Inorg. Chem., 1979, 18, 1755 CrossRef CAS.
- (a) I. Fernández and G. Frenking, Chem.−Eur. J., 2006, 12, 3617 CrossRef PubMed; (b) G. Frenking, M. Hermann, D. M. Andrada and N. Holzmann, Chem. Soc. Rev., 2016, 45, 1129 RSC; (c) G. Frenking, R. Tonner, S. Klein, N. Takagi, T. Shimizu, A. Krapp, K. K. Pandey and P. Parameswaran, Chem. Soc. Rev., 2014, 43, 5106 RSC; (d) C. Mohapatra, S. Kundu, A. N. Paesch, R. Herbst-Irmer, D. Stalke, D. M. Andrada, G. Frenking and H. W. Roesky, J. Am. Chem. Soc., 2016, 138, 10429 CrossRef CAS PubMed; (e) R. Tonner and G. Frenking, Chem.−Eur. J., 2008, 14, 3260 CrossRef CAS PubMed; (f) D. M. Andrada and G. Frenking, Angew. Chem. Int. Ed., 2015, 54, 12319 ( Angew. Chem. , 2015 , 127 , 12494–12500 ) CrossRef CAS PubMed.
- (a) M. Mitoraj and A. Michalak, Organometallics, 2007, 26, 6576 CrossRef CAS; (b) M. P. Mitoraj, A. Michalak and T. Ziegler, J. Chem. Theory Comput., 2009, 5, 962 CrossRef CAS PubMed.
- (a) T. Kottke and D. Stalke, J. Appl. Crystallogr., 1993, 26, 615 CrossRef; (b) D. Stalke, Chem. Soc. Rev., 1998, 27, 171 RSC.
- SAINT, Bruker-AXS, Madison, WI, USA, 2013 Search PubMed.
- L. Krause, R. Herbst-Irmer, G. M. Sheldrick and D. Stalke, J. Appl. Crystallogr., 2015, 48, 3 CAS.
- G. M. Sheldrick, Acta Crystallogr., Sect. A: Found. Adv., 2015, 71, 3 CrossRef PubMed.
- G. M. Sheldrick, Acta Crystallogr., Sect. C: Struct. Chem., 2015, 71, 3 CrossRef PubMed.
- C. B. Hübschle, G. M. Sheldrick and B. Dittrich, J. Appl. Crystallogr., 2011, 44, 1281 CrossRef PubMed.
- B. Niepötter, R. Herbst-Irmer and D. Stalke, J. Appl. Crystallogr., 2015, 48, 1485 Search PubMed.
- (a) R. Destro and F. Merati, Acta Crystallogr., Sect. B: Struct. Sci., 1995, 51, 559 CrossRef; (b) S. Deuerlein, D. Leusser, U. Flierler, H. Ott and D. Stalke, Organometallics, 2008, 27, 2306 CrossRef CAS; (c) C. F. Matta, J. Hernández-Trujillo, T.-H. Tang and R. F. W. Bader, Chem.−Eur. J., 2003, 9, 1940 CrossRef CAS PubMed; (d) A. Haaland, D. J. Shorokhov and N. V. Tverdova, Chem.−Eur. J., 2004, 10, 4416 CrossRef CAS PubMed; (e) L. J. Farrugia, C. Evans and M. Tegel, J. Phys. Chem. A, 2006, 110, 7952 CrossRef CAS PubMed; (f) L. J. Farrugia, C. Evans, D. Lentz and M. Roemer, J. Am. Chem. Soc., 2009, 131, 1251 CrossRef CAS PubMed.
- H. Ott, U. Pieper, D. Leusser, U. Flierler, J. Henn and D. Stalke, Angew. Chem. Int. Ed., 2009, 48, 2978 ( Angew. Chem. , 2009 , 121 , 3022–3026 ) CrossRef CAS PubMed.
- E. A. Zhurova, V. V. Zhurov and A. A. Pinkerton, J. Am. Chem. Soc., 2007, 129, 13887 CrossRef CAS PubMed.
Footnote |
| † Electronic supplementary information (ESI) available: Experimental charge density investigation and computational details. CCDC 1590024–1590026. For ESI and crystallographic data in CIF or other electronic format see DOI: 10.1039/c7sc05368a |
| This journal is © The Royal Society of Chemistry 2018 |

