
 Open Access Article
 This Open Access Article is licensed under a Creative Commons Attribution-Non Commercial 3.0 Unported Licence
A mononuclear nonheme {FeNO}6 complex: synthesis and structural and spectroscopic characterization†
Seungwoo
Hong
 ab,
James J.
Yan
c,
Deepika G.
Karmalkar
a,
Kyle D.
Sutherlin
c,
Jin
Kim
a,
Yong-Min
Lee
a,
Yire
Goo
a,
Pradip K.
Mascharak
*d,
Britt
Hedman
*e,
Keith O.
Hodgson
*ce,
Kenneth D.
Karlin
*f,
Edward I.
Solomon
*ce and
Wonwoo
Nam
*ag
ab,
James J.
Yan
c,
Deepika G.
Karmalkar
a,
Kyle D.
Sutherlin
c,
Jin
Kim
a,
Yong-Min
Lee
a,
Yire
Goo
a,
Pradip K.
Mascharak
*d,
Britt
Hedman
*e,
Keith O.
Hodgson
*ce,
Kenneth D.
Karlin
*f,
Edward I.
Solomon
*ce and
Wonwoo
Nam
*ag
aDepartment of Chemistry and Nano Science, Ewha Womans University, Seoul 03760, Korea. E-mail: wwnam@ewha.ac.kr
bDepartment of Chemistry, Sookmyung Women's University, Seoul 04310, Korea
cDepartment of Chemistry, Stanford University, Stanford, California 94305, USA. E-mail: edward.solomon@stanford.edu
dDepartment of Chemistry and Biochemistry, University of California, Santa Cruz, California 95064, USA
eStanford Synchrotron Radiation Lightsource, SLAC National Accelerator Laboratory, Stanford University, California 94025, USA. E-mail: bhedman@stanford.edu; hodgsonk@stanford.edu
fDepartment of Chemistry, The Johns Hopkins University, Baltimore, Maryland 21218, USA. E-mail: karlin@jhu.edu
gSchool of Chemistry and Chemical Engineering, Shaanxi Normal University, Xi'an 710119, P. R. China
First published on 20th July 2018
Abstract
While the synthesis and characterization of {FeNO}7,8,9 complexes have been well documented in heme and nonheme iron models, {FeNO}6 complexes have been less clearly understood. Herein, we report the synthesis and structural and spectroscopic characterization of mononuclear nonheme {FeNO}6 and iron(III)–nitrito complexes bearing a tetraamido macrocyclic ligand (TAML), such as [(TAML)FeIII(NO)]− and [(TAML)FeIII(NO2)]2−, respectively. First, direct addition of NO(g) to [FeIII(TAML)]− results in the formation of [(TAML)FeIII(NO)]−, which is sensitive to moisture and air. The spectroscopic data of [(TAML)FeIII(NO)]−, such as 1H nuclear magnetic resonance and X-ray absorption spectroscopies, combined with computational study suggest the neutral nature of nitric oxide with a diamagnetic Fe center (S = 0). We also provide alternative pathways for the generation of [(TAML)FeIII(NO)]−, such as the iron–nitrite reduction triggered by protonation in the presence of ferrocene, which acts as an electron donor, and the photochemical iron–nitrite reduction. To the best of our knowledge, the present study reports the first photochemical nitrite reduction in nonheme iron models.
Introduction
Nitrogen oxides (NOx), including nitric oxide (NO), nitrite anion (NO2−), nitrogen dioxide (NO2) and nitrous oxide (N2O), are important in environmental and atmospheric chemistries, and play critical roles in biological settings. Nitric oxide is well established in cellular signaling and it is a powerful vasodilator;1–3 NO is also intimately involved in the physiological immune response, for example, by reacting with superoxide anion (O2˙−) to generate the toxic oxidizing/nitrating species peroxynitrite (–OON![[double bond, length as m-dash]](https://www.rsc.org/images/entities/char_e001.gif) O) and/or NO2, which aid the fight against invading pathogens.4,5 Thus, the tight control of NO concentrations (i.e., homeostasis) is important and (i) it may be stored in the form of a circulating cellular nitrite pool (which can undergo reduction–protonation to give back NO),5,6 or conversely (ii) NO may be removed and transformed to innocuous nitrogen oxide forms. For the latter, hemo- or myoglobin type proteins oxidize NO to nitrate anion, in the so-called NO dioxygenase (NOD) activity.3,7,8 Bacterial nitric oxide reductases (NOR's)3,9 reductively couple two NO molecules to give N2O, and in fungi, a heme protein cytochrome P450 NOR (P450nor) effects the same reaction.3,10 As is clear from these discussions, transition metal ions are associated with NOx interactions and enzymatic reactions, for heme, and non-heme iron and copper proteins.2,11
O) and/or NO2, which aid the fight against invading pathogens.4,5 Thus, the tight control of NO concentrations (i.e., homeostasis) is important and (i) it may be stored in the form of a circulating cellular nitrite pool (which can undergo reduction–protonation to give back NO),5,6 or conversely (ii) NO may be removed and transformed to innocuous nitrogen oxide forms. For the latter, hemo- or myoglobin type proteins oxidize NO to nitrate anion, in the so-called NO dioxygenase (NOD) activity.3,7,8 Bacterial nitric oxide reductases (NOR's)3,9 reductively couple two NO molecules to give N2O, and in fungi, a heme protein cytochrome P450 NOR (P450nor) effects the same reaction.3,10 As is clear from these discussions, transition metal ions are associated with NOx interactions and enzymatic reactions, for heme, and non-heme iron and copper proteins.2,11
Biomimetic synthetic models offer an attractive platform to understand physical and chemical properties of the Fe–NO moiety. For example, Ford and co-workers have reported seminal works on the characterization of Fe–NO intermediates and nitrite reduction mediated by heme models.12 Lehnert has demonstrated the synthesis and characterization of Fe–NO complexes in heme and nonheme models.13 Mascharak has synthesized and characterized non-heme complexes with a photolabile Fe–NO bond, including [(PaPy3)FeIII(NO)]2+.14 Recently, Pluth and Lippard reported that an Fe(III) complex with a tetraamido macrocycle TAML ligand, [FeIII(TAML)]−,15 where the TAML scaffold is known to provide remarkable stability to higher oxidation states of iron,16 promotes NO binding and release, stated to occur without formal oxidation state changes at iron.
Instead of using NO, it has been well documented that there are two different pathways for nitrite (NO2−) reduction that lead to the formation of Fe–NO complexes: addition of (i) proton resulting in the electrophilic attack of two protons on the O atom of Fe–nitrite complexes (Scheme 1, pathway i) or (ii) triphenylphosphine(PPh3)/thioether-/thio-triggered oxygen atom transfer (OAT) reactions (Scheme 1, pathway ii).12,17 However, photochemical generation of NO from Fe-bound nitrite has yet to be explored. Herein, we describe more elaborated NOx chemistry starting with the same compound [FeIII(TAML)]−. The new aspects and advances presented here include (a) full characterization of a Fe(III)–nitrosyl complex including the X-ray crystal structure and (b) chemical and photochemical generation of the same Fe(III)–nitrosyl complex from a Fe(III)–nitrito complex (Scheme 1, pathway i and iii). Indeed, previously known Fe–NO adducts have {Fe–NO}7 or {Fe–NO}8 descriptions in the Enemark–Feltham notation,18 but [(TAML)FeIII(NO)]− (1) is a {Fe–NO}6 compound, like [(PaPy3)FeIII(NO)]2+.14
 | ||
| Scheme 1 Schematic illustration showing different pathways of nitrite reduction. | ||
Results and discussion
Complex 1 was generated as described by Pluth and Lippard15 (see the Experimental section and Fig. S1–S4, ESI†); 1 was prepared in situ at −40 °C and excess NO(g) was removed by vacuum/argon-purge cycles. A UV-vis spectrum of 1 generated in CH3CN at −40 °C displayed similar features with λmax at 525 nm (ε = 4500 M−1 cm−1) and 880 nm (ε = 8000 M−1 cm−1), respectively (Fig. S2a, ESI†). In contrast to what was found for 1 generated in CH3OH,14 a 1H NMR spectrum of isolated 1 exhibited ligand peaks in the range of 0–10 ppm, and an Evans method experiment showed that there is no shift of the TMS or solvent peak. These results suggest that the complex is diamagnetic with a low-spin (S = 0) state (Fig. S3, ESI†). A cold spray ionization time-of-flight mass (CSI MS) spectrum of 1 in negative mode exhibited an ion peak at m/z of 456.1, whose mass and isotopic distribution patterns correspond to [(TAML)Fe(NO)]− (calculated m/z of 456.1) (Fig. S4, ESI†). The ion peak of 1 shifted one-mass unit upon 15NO-substitution, confirming that 1 contains one exchangeable nitrogen atom in it. Fortunately, recrystallization of 1 from CH3CN/Et2O under an Ar atmosphere afforded single crystals suitable for X-ray diffraction; the crystallographic analysis revealed average Fe1–NTAML, Fe1–N5, and N5–O1 distances of 1.8843(12), 1.6131(13), and 1.1667(19) Å, respectively (Fig. 1a). The crystal structure of 1 also exhibits a linear Fe–N–O angle of 172.05(14)°, which is consistent with S = 0 ground state. It is noteworthy that while {FeNO}6 with a typical non-heme ligand such as TMG3tren exhibited S = 1 ground states with a linear Fe–N–O angles of 180°,13d {FeNO}6 with heme ligands displayed Fe–N–O angles ranging from 159.6(8)° to 178.3(3)°.19 Since the TAML ligand exhibits strong π-donation that isn't seen in typical non-heme ligands, there are some geometric and electronic structural similarities between iron–nitrosyl complexes bearing TAML and heme ligands.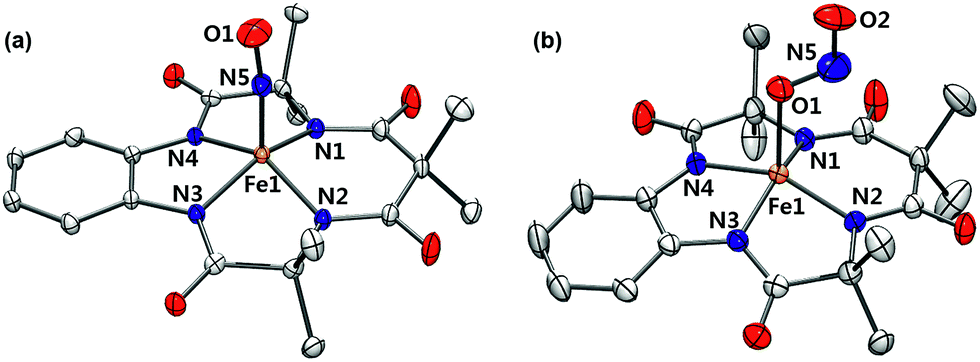 | ||
| Fig. 1 X-ray crystal structures of (a) 1 and (b) 2 showing 50% probability ellipsoids. Cations such as tetraphenylphosphonium, tetrabutylammonium, hydrogen atoms and ether molecules are omitted for clarity. Colors for atoms: Fe, orange; N, blue; O, red; C, white (see Tables S1 and S2, ESI†). | ||
Zero-field Mössbauer data for 1 measured at 77 K are given in Fig. 2. Fitting of these data shows a single species (100%) with δ = −0.19 mm s−1 and |ΔEQ| = 3.29 mm s−1, in agreement with previously reported parameters for 1 (δ = −0.20 mm s−1 and |ΔEQ| = 3.29 mm s−1).15 It should be noted that, in the previous study, the nitrosyl species only accounted for 36% of the Mössbauer spectrum. These parameters are similar to a low-spin, six-coordinate {FeNO}6 compound with a macrocyclic tetracarbene ligand, [(NHCL)FeNO(ONO)](OTf)2, which has δ = −0.16 mm s−1 and |ΔEQ| = 3.12 mm s−1 (Table S4, ESI†).20 They are also significantly different from the parameters obtained for a different low-spin, six-coordinate {FeNO}6 complex, [(PaPy3)FeIII(NO)]2+, which has δ = −0.05 mm s−1 and |ΔEQ| = 0.85 mm s−1.14 Previous studies on other TAML compounds have shown that they have more negative isomer shifts for a given oxidation state, such as in the case of [(TAML)FeIVO]2− (−0.19) 16b compared to [(N4Py)FeIVO]2+ (−0.04).21 This is due to the strong equatorial donation of the TAML ligand into the 4s orbital,22 and can account for the difference between the TAML and PaPy3 {FeNO}6 compounds. The tetracarbene ligand is a good equatorial donor, like TAML, which gives it similar Mössbauer parameters.
 | ||
| Fig. 2 Zero-field Mössbauer spectrum (black opened circles) and fit (blue line) of 1 measured at 77 K. The isomer shift of −0.19 mm s−1 and quadrupole splitting of 3.29 mm s−1 are in good agreement with parameters previously reported for this complex in ref. 14 (also see Table S3, ESI†). | ||
EXAFS data for 1 are shown in Fig. 3a. The best fit to the EXAFS is consistent with the crystal structure, with a short 1.62 Å Fe–NO bond length and an intense Fe–N–O multiple scattering path at 3.03 Å, consistent with a nearly linear Fe–N–O (Table S5, ESI†). There are also four N atoms at 1.89 Å and eight C atoms at 2.93 Å, consistent with the low-Z atoms of the TAML ring (full fit and components shown in Fig. S5, ESI†). The XANES data of 1 are shown in blue in Fig. 3b with the XANES data for [(PaPy3)FeIII(NO)]2+ in black. The two compounds have the same rising edge energy, indicating they have the same Zeff. This is consistent with the difference in isomer shift being due to equatorial ligand donation. The pre-edge for 1 has a total intensity of 27 units, and is resolved into two peaks at 7112.1 eV (16 units) and 7113.3 eV (11 units), while the pre-edge of [(PaPy3)FeIII(NO)]2+ has one peak at 7113.0 eV (9 units) (Table S6, ESI†). The increased pre-edge intensity of 1 is consistent with 4p mixing into the 3d orbitals due to the loss of centrosymmetry in a 5C complex.
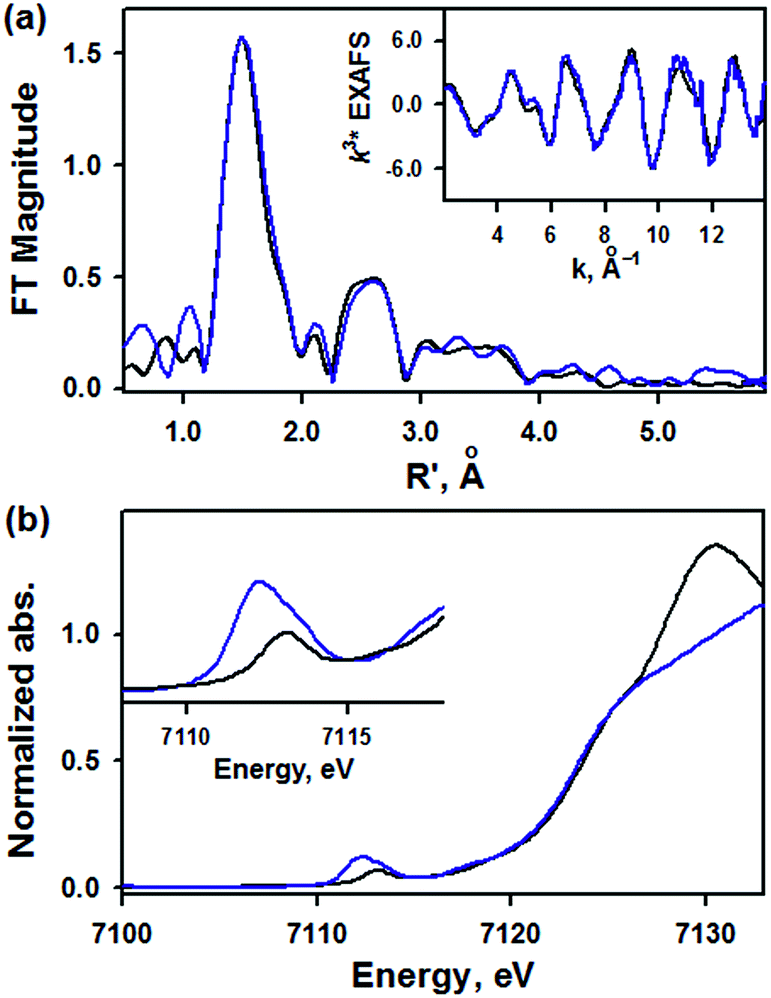 | ||
| Fig. 3 (a) Fourier transform and EXAFS (inset) of 1 (blue line) with fits (black line). (b) XANES data of 1 (blue line) and [(PaPy3)FeIII(NO)]2+ (black line) for comparison. Inset shows the expansion of the pre-edge region. | ||
To understand the electronic structure of 1, DFT calculations were performed. The BP86 functional correctly reproduced the S = 0 ground state with good geometrical agreement with the crystal and EXAFS structure (Table S7, ESI†). The calculations show an electronic structure for 1 very similar to [(PaPy3)FeIII(NO)]2+, which was previously studied through L-edge XAS and DFT calculations.23 The L-edge XAS showed that [(PaPy3)FeIII(NO)]2+ has backbonding equivalent to donation of an electron from the Fe to the NO for a total unoccupied metal 3d character consistent with FeIII, but with unpolarized bonding to give an S = 0 FeIII–NO (neutral) electronic structure, rather than antiferromagnetically coupled FeIII (S = 1/2)–NO˙ (S = −1/2). The unpolarized FeIII–NO (neutral) description is equivalent to the “FeII–NO+ with strong backbonding” description used in previous work.24a DFT gives two (α and β) unoccupied dz2 and dx2–y2 σ*-bonding orbitals, and two unoccupied  and
and  π*-bonding orbitals. While the calculated MO's are qualitatively similar to an FeII–NO+ electronic structure, quantitative analysis of the metal d character in the unoccupied π*-bonding orbitals (130% in 1, 112% in [(PaPy3)FeIII(NO)]2+) shows extensive donation from the Fe to the NO. The strong backbonding gives a Zeff that is quantitatively FeIII, as additionally corroborated by vibrational spectroscopy and S K-edge XAS.24 The FeIII–NO(neutral) description decouples the oxidation state from polarization to provide a more complete description. While the calculations show that 1 (338%) has a similar amount of unoccupied 3d character to [(PaPy3)FeIII(NO)]2+ (342%), the calculated Mössbauer δ value agrees with the experiment in 1 being more negative than [(PaPy3)FeIII(NO)]2+. This results from some quantitative differences in the bonding. The TAML ligand in 1 is a much stronger σ donor into the dx2–y2 orbital than the PaPy3 ligand (55% vs. 64% 3d character), leading to greater backbonding in 1 compared to [(PaPy3)FeIII(NO)]2+ (33% vs. 28%). The calculations also show that the dz2 orbital lowers in energy going from 6C to 5C, which explains the difference in pre-edge shape (Fig. S6, ESI† for full DFT comparison). Combining the XAS, Mössbauer, and DFT analysis, the electronic structure of 1 is assigned as unpolarized FeIII–NO (neutral), similar to the prior description of [(PaPy3)FeIII(NO)]2+ (vide supra).
Addition of a nitrite source such as sodium nitrite (NaNO2) or tetrabutylammonium nitrite (Bu4NNO2) to a solution of [FeIII(TAML)]− in CH3CN at −40 °C resulted in the formation of [(TAML)FeIII(NO2)]2− (2), and this transformation could be easily noted by the blue-shift of the electronic absorption band from 400 nm due to 1 to 365 nm (ε = 7500 M−1 cm−1) due to 2 (Fig. 4a). The X-band EPR spectrum showed signals identical to those found for [FeIII(TAML)]−, at g = 3.9 and 2.0, consistent with the presence of an intermediate spin state (S = 3/2) (Fig. 4b). The CSI MS spectrum of 2 in negative mode exhibits a peak at m/z of 495.0, whose mass and distribution patterns correspond to the formulation of [(TAML)Fe(14NO2)(Na)]− (calculated m/z of 495.1) (Fig. S7, ESI†). When the reaction was carried out with isotopically 15N-labeled Na15NO2, a mass peak corresponding to [(TAML)Fe(15NO2)(Na)]− (calculated m/z of 496.1) appeared at m/z of 496.0, indicating that 2 contains one exchangeable N atom (Fig. 4a, inset). The NO2− binding to the iron(III)–TAML center is strong; variable temperature UV-vis experiments from −40 to 20 °C (Fig. S8, ESI†) indicate that the binding constant (Kf) of NO2− to the Fe(III) center was 8.0(5) × 103 at 20 °C, whereas Kf at −40 °C was determined to be 6.0(5) × 107.
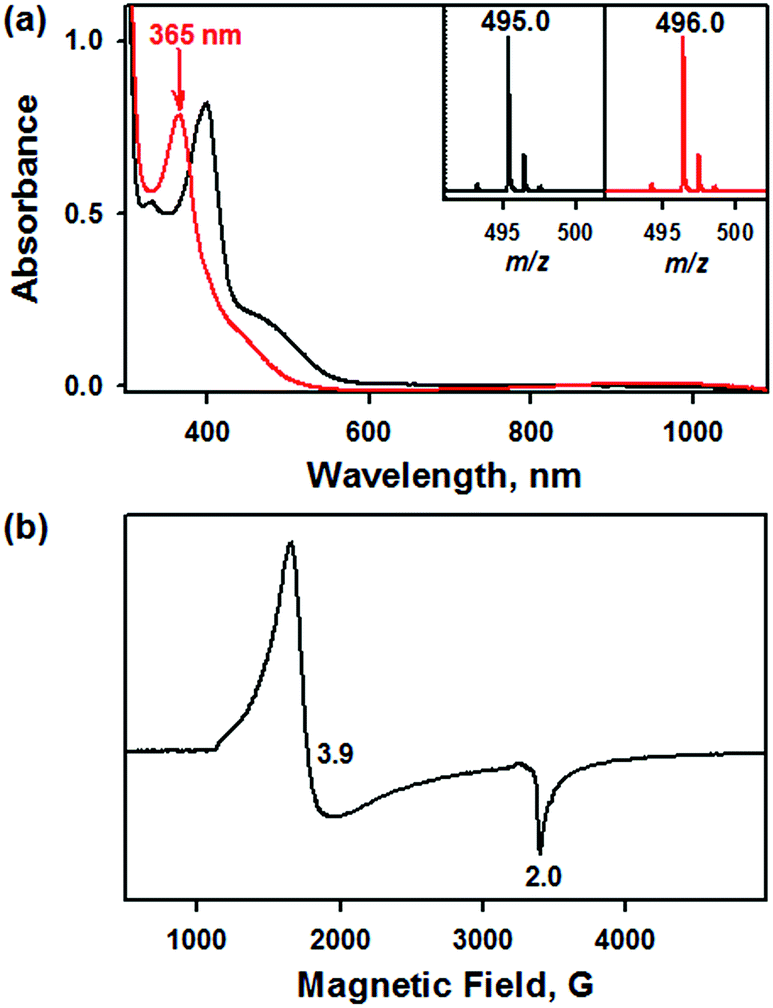 | ||
| Fig. 4 (a) UV-vis spectra of [FeIII(TAML)]− (0.10 mM, black line) and [(TAML)FeIII(NO2)]2− (0.10 mM, red line) under an inert atmosphere in CH3CN at −40 °C. Insets show the isotopic distribution patterns of the peaks at m/z of 495.0 for 2–14NO2 (left panel) and m/z of 496.0 for 2–15NO2 (right panel), which were generated by Na14NO2 and Na15NO2, respectively. (b) X-band EPR spectrum of 2 (1.0 mM) recorded in CH3CN at 5 K. | ||
Interestingly, the X-ray crystal structure of 2 revealed an O-binding Fe(III)–nitrito complex (Fe–κ1–ONO), in a square pyramidal geometry arising from the TAML ligand and monodentate Fe–ONO moiety (Fig. 1b). O-binding of the nitrite ligand is biologically relevant because the metal–O–nitrito binding fashion has been observed in the reaction of metmyoglobin and nitrite.25 In this nitrite complex with [FeIII(TAML)]−, the Fe1–O1 bond distance is 2.068(4) Å, which is longer than that of MbIII(ONO−) (1.94 Å). The angles formed from Fe1–O1–N5 of 122.4(4)° and O1–N5–O2 of 116.6(5)° are slightly larger than those for MbIII(ONO−) (116° and 113°, respectively).25
Of importance, treatment of a solution of 2 with 2.4 equiv. of CF3SO3H in the presence of 1.2 equiv. of ferrocene leads to the immediate formation of 1 with over 90% yield on the basis of the extinction coefficient of isolated 1 (Fig. S9, ESI†). This result clearly showed that the nitrite reduction of 2 successfully occurred to produce NO. To rule out a possibility of the free nitrous acid (HNO2) disproportionation that yields NO2 and NO, we carried out control reactions by (1) adding the starting [Fe(TAML)]− complex into the Ar-saturated CH3CN solution containing NaNO2, ferrocene, and triflic acid and (2) a solution of NaNO2 and triflic acid was added to an Ar-saturated CH3CN solution of [Fe(TAML)]−. In these control reactions, we did not observe the formation of 1, suggesting that 1 was formed directly from the iron(III)–nitrito complex, 2, upon protonation (Fig. S10, ESI†). Instead of the protonation, we also endeavored to carry out (i) the thioether-/thio-triggered oxygen atom transfer (OAT) and (ii) triphenylphosphine (PPh3)-triggered OAT in the hope of finding different pathways of nitroxylation proposed by other groups;12,13,17 unfortunately, those attempts did not lead to the formation of 1. More interestingly, preliminary results on the photoirradiation at 420 nm of a solution containing 2 (0.10 mM) in acetone under an Ar atmosphere afforded the formation of 1 within 3.5 h with over 90% yield (Fig. 5). The formation of 1 was not observed in the absence of visible-light irradiation, indicating that the photochemical generation of 1 from 2 occurred. To investigate the photochemical transformation of free nitrite resulting in NO, we carried out a control experiment, in which we first photolyzed an Ar-saturated acetone solution containing NaNO2, followed by adding the starting [Fe(TAML)]− complex. However, it didn't afford the formation of 1, indicating that the photochemical transformation of 2 to 1 didn't involve the free nitrite photolysis (Fig. S11, ESI†). An X-band EPR spectrum and CSI MS of the product confirmed that 1 was successfully generated (Fig. S12, ESI†). Thus, the nitrite reduction could be triggered by adding proton or by photoirradiating 2.
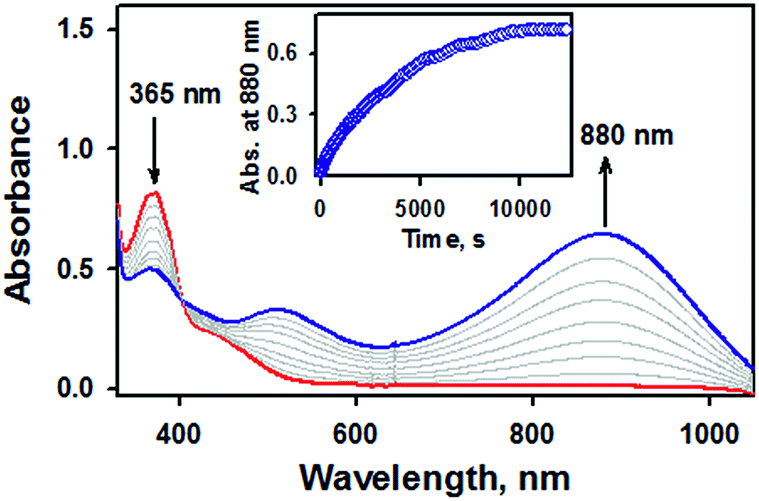 | ||
| Fig. 5 UV-vis spectral changes observed in the photoirradiation reaction of 2 (0.10 mM, red line) under an inert atmosphere in acetone at −40 °C. | ||
Since 2 would unambiguously undergo N–O bond cleavage to yield 1 under photochemical conditions, we then pursued the fate of oxygen transfer reactions from the initial Fe(III)–nitrite complex by adding oxygen trapping substrates, such as PPh3 and thioanisole. Otherwise, it is difficult to trap the dissociated oxygen atom in the reaction solution without adding substrates. Product analysis performed after the completion of the photochemical nitrite reduction of 2 in the presence of thioanisole or PPh3 revealed the formation of methyl phenyl sulfoxide (∼40% yield) and triphenylphosphine oxide (∼45%), respectively. It has been suggested that in the case of manganese and iron porphyrin complexes, the photo-triggered oxygen atom transfer occurred from the O-bound nitrito complexes to substrates such as PPh3, resulting in the formation of the corresponding NO complexes.26 In the present case, however, the reaction rate was not affected by the nature of substrates or the concentration of substrates, consistent with the fact that the PPh3/thio-triggered nitrite reduction did not occur unless photoreduction of 2 does trigger oxo transfer.
Conclusions
As demonstrated in this report (see Scheme 2), we were able to characterize novel Fe–NO2, and Fe–NO complexes bearing TAML by using various spectroscopic methods, including UV-vis, Mössbauer, XAS, NMR, CSI MS, and IR spectroscopies, and X-ray crystallography. We also established a photochemical nitrite reduction of an Fe(III)–nitrito complex that produced a nearly quantitative yield of the corresponding Fe(III)–nitrosyl complex. Since there is a constant challenge regarding NO production and/or release related to drug delivery, the present work provides an interesting insight into producing NO from nitrite under photoirradiation. Future work will be focused on the further reactivity of Fe–NO intermediates in the formation of ammonia via hydroxylamine in the presence of protons.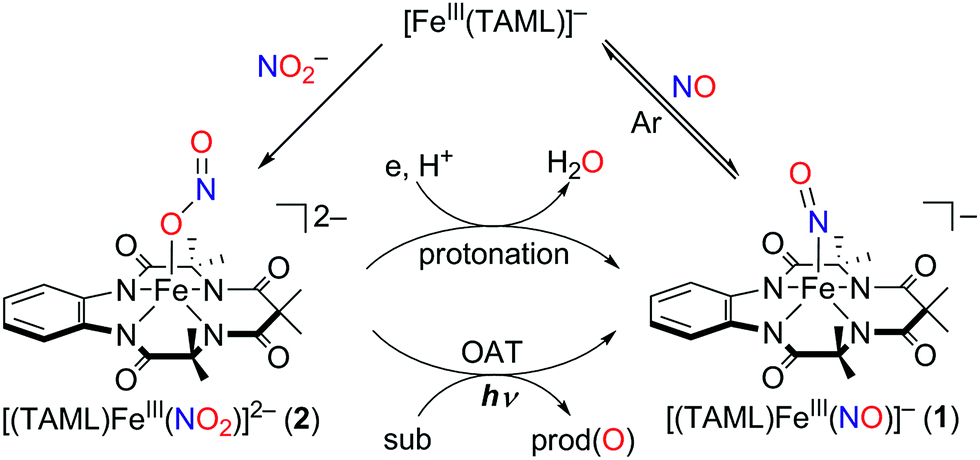 | ||
| Scheme 2 Schematic representation showing the generation of [(TAML)FeIII(NO)]−. | ||
Experimental section
Materials
All chemicals, obtained from Aldrich Chemical Co. and Tokyo Chemical Industry, were the best available purity and used without further purification unless otherwise indicated. Solvents were dried according to published procedures and distilled under argon prior to use.2715NO(g) (>99% 15N-enriched) was purchased from ICON Services Inc. (Summit, NJ, USA) and used without further purification. Na[FeIII(TAML)] and TAML-H4 (TAML = tetraamidomacrocyclic ligand, 3,3,6,6,9,9-hexamethyl-2,5,7,10-tetraoxo-3,5,6,7,9,10-hexahydro-2H-benzo[e][1,4,7,10]tetraazacyclo-tridecine-1,4,8,11-tetraide) were purchased from GreenOx Catalyst, Inc. (Pittsburgh, PA, USA), and the Na[FeIII(TAML)] complex was recrystallized from an isopropanol/H2O mixture for further use.16,2857Fe-enriched 1 was prepared according to the literature method.16,28Instrumentation
UV-vis spectra were recorded on a Hewlett Packard 8453 diode array spectrophotometer equipped with a UNISOKU Scientific Instruments Cryostat USP-203A for low-temperature experiments. Cold spray ionization time-of-flight mass (CSI MS) spectra were collected on a JMS-T100CS (JEOL) mass spectrometer equipped with the CSI source. Typical measurement conditions are as follows: needle voltage: 2.2 kV, orifice 1 current: 50–500 nA, orifice 1 voltage: 0 to 20 V, ring lens voltage: 10 V, ion source temperature: 5 °C, spray temperature: −40 °C. The CSI MS spectra of [(TAML)FeIII(NO)]− and [(TAML)FeIII(NO2)]2− were observed by directly infusing the reaction solution into the ion source through a pre-cooled tube under high N2 gas pressure. X-band CW-EPR spectra were taken at 5 K using a X-band Bruker EMX-plus spectrometer equipped with a dual mode cavity (ER 4116DM). Low temperatures were achieved and controlled with an Oxford Instruments ESR900 liquid He quartz cryostat with an Oxford Instruments ITC503 temperature and gas flow controller. The experimental parameters for EPR spectra were as follows: microwave frequency = 9.647 GHz, microwave power = 1.0 mW, modulation amplitude = 10 G, gain = 1 × 10⁴, modulation frequency = 100 kHz, time constant = 40.96 ms and conversion time = 81.00 ms. Low temperature liquid IR spectra were recorded on a Remspec 626 FT-IR spectrometer. IR spectrum analysis was performed in the frequency range of 1000–5000 cm−1 at a resolution of 4 cm−1. Product analysis was performed using high performance liquid chromatography (HPLC, Waters 515). Quantitative analyses were made on the basis of comparison of HPLC peak integration between products and authentic samples. 1H NMR spectra were measured with a Bruker model digital AVANCE III 400 FT-NMR spectrometer. All NMR spectra were recorded in CD3CN at −40 °C.Purification of nitric oxide
Nitric oxide gas (NO(g)) was obtained from Dong-A Specialty Gases and purified as follows (see Fig. S1†): NO(g) was first passed through two columns filled with NaOH beads and molecular sieves to remove higher nitrogen oxide and moisture impurities and collected in the frozen form in a first trap cooled at 77 K with liquid N2. Further purification was performed by the distillation of frozen NO(g) (as crystalline N2O2), which means that frozen NO(g) was warmed up to 193 K (acetone/dry-ice mixture, 193 K) and then the sample was collected in a second trap cooled at 77 K with liquid N2. This second trap was again warmed up to 193 K and then, the highly purified NO(g) was collected in another Schlenk flask fitted with a rubber septum (free from oxygen; after several cycles of vacuum and Ar purging). The NO(g) should be at a very high pressure in the Schlenk flask (>1 atm; the septum bulges outward due to high pressures inside the Schlenk flask). Then, NO(g) was purged into the distilled and degassed CH3CN (15 mL) in a Schlenk flask, which was already connected with an oil bubbler. NO(g) purging with vigorous stirring under 1 atm for 20 min was required to make NO-saturated CH3CN solution. The concentration of NO in CH3CN saturated solution at 293 K was approximated to be 14 mM.29Synthesis of [(TAML)Fe(NO)]− (1)
The starting complex, [FeIII(TAML)]− (1) was bubbled with Ar for 20 min in CH3CN at −40 °C.15 To this solution, excess NO(g) (∼10 cm3) was injected into the head-space and stirred for 10 min as the color changed from orange to deep purple. 15N-incorporated {FeNO}6 complex was generated using 15NO(g) under the identical reaction conditions. Solution IR data of both 1–NO (5.0 mM) and 1–15NO (5.0 mM) were obtained by reacting 1 with NO(g) and 15NO(g), respectively.Synthesis of [(TAML)FeIII(NO2)]2− (2)
The Fe(III)–nitrite intermediate, [(TAML)FeIII(NO2)]2− (2), was generated either by adding 5.0 equiv. of sodium nitrite, NaNO2 in the presence of 10 equiv. of 15-crown ether (15C5) or by adding 5.0 equiv. of tetrabutylammonium nitrite (Bu4NNO2) in CH3CN at room temperature. The solution color changed from orange to yellow. Slow diffusion of diethylether into the reaction solution allowed us to obtain single crystals. 15N-incorporated 2 was synthesized by using Na15NO2 under identical reaction conditions.X-ray structural analysis
To improve the quality of the single crystals of 1, the cation exchange from Na+ to PPh4+ was performed by introducing PPh4Cl into the solution containing Na[FeIII(TAML)]. Single crystals of {FeNO}6, (PPh4)[(TAML)Fe(NO)], and Fe(III)–nitrite complexes, (Bu4N)2[(TAML)FeIII(NO2)], suitable for X-ray analysis were obtained by slow diffusion of Et2O into the CH3CN solution of 1 and 2, respectively. These crystals were taken from the solution using a nylon loop (Hampton Research Co.) on a handmade copper plate and mounted on a goniometer head in a N2 cryostream. The diffraction data for both 1 and 2 were collected at 100 K, on a Bruker SMART AXS diffractometer equipped with a monochromator in the Mo Kα (λ = 0.71073 Å) incident beam. The CCD data were integrated and scaled using the Bruker-SAINT software package, and the structure was solved and refined using SHELXTL V 6.12.30 Hydrogen atoms were located in the calculated positions. In the structure, the crystal lattice contains some amounts of disordered solvent molecules (most likely to be one diethyl ether lattice molecule per asymmetric unit whose occupancy factors are possibly lower than 1). The contribution of the lattice solvent molecule has been taken out using the program SQUEEZE (Spek, 2003) for the final refinement.31 All details of the SQUEEZE refinement are provided in the CIF files. CCDC 1574430 for 1 and CCDC 1574431 for 2 contain the supplementary crystallographic data for 1 and 2.†Spectral titration for the binding constant (Kf)
The binding constant of nitrite ion to [FeIII(TAML)]− was examined by varying the temperature of the CH3CN solution containing the isolated Fe(III)–nitrite intermediate, 2. Typically, the temperature of a CH3CN solution of 2 varied from −40 °C to 20 °C. The concentration of [FeIII(TAML)]− was determined from the absorption band at λ = 400 nm (ε = 8000 M−1 cm−1) and that of 2 from the absorption band at λ = 365 nm (ε = 7500 M−1 cm−1).
The binding constant (Kf) is expressed by the equation below:
| Kf = [2]/([[FeIII(TAML)]−] × [NO2−]) | (1) |
Finally, the Kf values of 8.0(5) × 103 at 20 °C and 6.0(5) × 107 at −40 °C were determined from UV spectral changes with respect to the temperature (ESI, Fig. S8†).
Solution IR measurements
Solution IR signals for samples were recorded on an IR instrument (Remspec #: 626) having a very sensitive probe, attached to a sophisticated setup under an Ar atmosphere in CH3CN at −40 °C. Solution IR data of both 1–NO (5.0 mM) and 1–15NO (5.0 mM) were obtained by reacting 1 with excess of NO(g) and 15NO(g), respectively.Spin state measurements
The effective magnetic moment (μeff, BM) of the FeIII complex 1 was determined using the modified 1H NMR method of Evans at −40 °C.32–34 A WILMAD® coaxial insert (sealed capillary) tube containing the blank acetonitrile-d3 solvent only (with 1.0% tetramethylsilane (TMS)) was inserted into the normal NMR tube containing the complexes (1.0 mM) dissolved in acetonitrile-d3 (with 0.10% TMS). The chemical shift of the TMS peak (and/or solvent peak) in the presence of the paramagnetic metal complexes was compared to that of the TMS peak (and/or solvent peak) in the inner coaxial insert tube. The effective magnetic moment was calculated using the following equation:| μ = 0.0618(ΔνT/2fM)1/2 |
X-ray absorption spectroscopy
[(TAML)Fe(NO)]− XAS samples were prepared and frozen under liquid nitrogen in 2 × 10 mm pinhole-type Delrin cells wrapped with Kapton tape. The [(PaPy3)Fe(NO)]2+ XAS sample was prepared by diluting 12.5 mg solid [(PaPy3)Fe(NO)]2+ with 67.5 mg solid BN, as calculated by the program SAMPLE4 as part of the program suite EXAFSPAK,35,36 and loaded into a 2 mm thick aluminum sample holder wrapped with Kapton tape under a N2 atmosphere in a glove bag in a dark room. All XAS data were collected at beamline 7–3 (ref. 37) at the Stanford Synchrotron Radiation Lightsource (SSRL) and the samples were maintained at 10 K using an Oxford Instruments CF1208 continuous flow liquid helium cryostat. The solution samples were oriented at 45° to the incident X-ray beam and measured under ring operating conditions of 500 mA over an energy range of 6785–7876 eV (k = 14 Å−1). Fluorescence data were collected at 90° to the incident beam using a solid-state 30-element Ge detector array with Soller slits and a 6 wavelength Mn filter aligned between the Soller slits and the sample to improve the Fe Kα fluorescence signal intensity relative to that of the scattered beam.38 The solid samples were oriented at 0° to the incident X-ray beam and measured in transmission mode with N2-filled ionization chambers under ring operating conditions of 350 mA over an energy range of 6785–8365 eV (k = 18 Å−1). An internal calibration was utilized with the first inflection point of an Fe foil set to 7111.2 eV.39 During measurement, the data in the Fe K-edge, K pre-edge, and extended X-ray absorption finestructure (EXAFS) regions were continuously monitored in order to ensure sample integrity by comparing each individual scan to the ones taken previously and no photodamage was observed.Data reduction, background subtraction, and normalization were performed according to established methods38–42 using the program PySpline43 with the data normalized to a value of 1.0 at 7130.0 eV. The spline function through the EXAFS region was chosen to minimize any residual low frequency background but not reduce the EXAFS amplitude, as monitored by the Fourier transform intensity. For pre-edge and edge analysis, all data sets were truncated to k = 9.5 Å−1 and renormalized using a second-order post-edge polynomial background and a two segment (three knot) spline for comparison between datasets and to past reference compounds.44 Normalization of the EXAFS data was accomplished using a second-order post-edge polynomial background fit over the energy range up to k = 14 Å−1 and a three-segment (four knot) spline.
Iron K pre-edge features were modeled with a pseudo-Voigt line shape in a 50![[thin space (1/6-em)]](https://www.rsc.org/images/entities/char_2009.gif) :50 ratio of Lorentzian:Gaussian functions using the fitting program EDG_FIT45 as part of the program suite EXAFSPAK. The energy position, full width at half-maximum (fwhm), and peak intensity were all allowed to float throughout the fitting process. A function modeling the background was empirically chosen to give the best fit, floated with all variables, and then varied with different fwhm (±0.5 fixed from float) to establish confidence limits on pre-edge intensity. In all cases, an acceptable fit reasonably matched both the pre-edge data as well as those of its second derivative. A minimum of three fits with different fwhm (±0.5 fixed from float) backgrounds were acquired over the energy ranges of 7106–7116, 7106–7117, and 7106–7118 eV to provide nine pre-edge fits. These were then averaged to give the final pre-edge energy and intensity values.
:50 ratio of Lorentzian:Gaussian functions using the fitting program EDG_FIT45 as part of the program suite EXAFSPAK. The energy position, full width at half-maximum (fwhm), and peak intensity were all allowed to float throughout the fitting process. A function modeling the background was empirically chosen to give the best fit, floated with all variables, and then varied with different fwhm (±0.5 fixed from float) to establish confidence limits on pre-edge intensity. In all cases, an acceptable fit reasonably matched both the pre-edge data as well as those of its second derivative. A minimum of three fits with different fwhm (±0.5 fixed from float) backgrounds were acquired over the energy ranges of 7106–7116, 7106–7117, and 7106–7118 eV to provide nine pre-edge fits. These were then averaged to give the final pre-edge energy and intensity values.
EXAFS signals were calculated using FEFF (version 7.0), and the data were fit using the program OPT as part of EXAFSPAK. In all fits the bond lengths (R) and bond variances (σ2) were allowed to vary. The threshold energy (k = 0, E0) was also allowed to vary but was constrained as a common variable (ΔE0) for all fit paths in a given dataset. The amplitude reduction factors (S02) were fixed to a value of 1.0, and the coordination numbers (CNs) were varied systematically based on a structural model to achieve the best fit to the EXAFS data. The best choice of all available FEFF paths and the goodness of the overall fit were optimized based on a combination of weighted F-factor (F) as well as visual fit to the EXAFS data and their Fourier transform. On the basis of studies of complexes of known structures, the uncertainties in final distances are within 0.02 Å.46 The EXAFS data for 1 were fit using the crystal structure as an initial model.
Mössbauer spectroscopy
Mössbauer data were collected at 77 K in a Janis model SVT-4000T cryostat using a SEE Co model W302 resonant gamma ray spectrometer. Spectral fits and simulations were performed using the Vinda software package.47 All isomer shifts are quoted relative to Fe foil at 298 K.DFT calculations
DFT geometry optimization calculations were performed on 1 using the Gaussian 09 (ref. 48) software package with the crystal structure as the starting structure. The BP86 (ref. 49 and 50) and B3LYP51,52 functionals were used with the 6-311G(d) basis set. Implicit solvation was included using the polarizable continuum model with the solvent specified as acetonitrile. Mössbauer parameters were calculated on the Gaussian optimized structures of 1 and [(PaPy3)FeIII(NO)]2+ using the Orca software package,53 the same functionals, and the CP(PPP) basis set on Fe and TZVP on the remaining atoms. Isomer shifts were calculated from densities at the Fe nucleus using Neese's calibration.54 Mulliken populations were analyzed with QMForge.55Conflicts of interest
There are no conflicts to declare.Acknowledgements
This work was supported by NRF of Korea through CRI (NRF-2012R1A3A2048842 to W. N.), GRL (NRF-2010-00353 to W. N.), MSIP (NRF-2017R1C1B2002037 to S. H.) and the USA National Institutes of Health (GM-28962 to K. D. K. and GM-40392 to E. I. S.). Use of the Stanford Synchrotron Radiation Lightsource, SLAC National Accelerator Laboratory, is supported by the U.S. Department of Energy, Office of Science, Office of Basic Energy Sciences under Contract No. DE-AC02-76SF00515. The SSRL Structural Molecular Biology Program is supported by the DOE Office of Biological and Environmental Research, and by the National Institutes of Health, National Institute of General Medical Sciences (P41GM103393 to K. O. H and B. H.).Notes and references
- (a) S. Moncada, R. M. J. Palmer and E. A. Higgs, Pharmacol. Rev., 1991, 43, 109 Search PubMed; (b) L. J. Ignarro, in Nitric Oxide: Principles and Actions, ed. J. Lancaster Jr, Academic Press, New York, 1996, p. 111 Search PubMed; (c) A. G. Tennyson and S. J. Lippard, Chem. Biol., 2011, 18, 1211 CrossRef PubMed; (d) V. Kuhn, L. Diederich, T. C. S. Keller IV, C. M. Kramer, W. Lückstädt, C. Panknin, T. Suvorava, B. E. Isakson, M. Kelm and M. M. Cortese-Krott, Antioxid. Redox Signaling, 2017, 26, 718 CrossRef PubMed.
- M. P. Schopfer, J. Wang and K. D. Karlin, Inorg. Chem., 2010, 49, 6267 CrossRef PubMed.
- N. Lehnert, T. C. Berto, M. G. I. Galinato and L. E. Goodrich, in The Handbook of Porphyrin Science, ed. K. M. Kadish, K. M. Smith and R. Guilard, World Scientific, Singapore, 2011, p. 1 Search PubMed.
- S. K. Sharma, P. J. Rogler and K. D. Karlin, J. Porphyrins Phthalocyanines, 2015, 19, 352 CrossRef PubMed.
- (a) J. S. Beckman, T. W. Beckman, J. Chen, P. A. Marshall and B. A. Freeman, Proc. Natl. Acad. Sci. U. S. A., 1990, 87, 1620 CrossRef PubMed; (b) P. Pacher, J. S. Beckman and L. Liaudet, Physiol. Rev., 2007, 87, 315 CrossRef PubMed; (c) C. H. Lim, P. C. Dedon and W. M. Deen, Chem. Res. Toxicol., 2008, 21, 2134 Search PubMed; (d) C. Prolo, M. N. Álvarez and R. Radi, BioFactors, 2014, 40, 215 Search PubMed; (e) H. C. Lok, S. Sahni, P. J. Jansson, Z. Kovacevic, C. L. Hawkins and D. R. Richardson, J. Biol. Chem., 2016, 291, 27042 CrossRef PubMed.
- (a) J. L. Cape and J. K. Hurst, Arch. Biochem. Biophys., 2009, 484, 190 CrossRef PubMed; (b) K. Akrawinthawong, J. W. Park, B. Piknova, N. Sibmooh, S. Fucharoen and A. N. Schechter, PLoS One, 2014, 9, e92435 CrossRef PubMed; (c) J. O. Lundberg, M. T. Gladwin and E. Weitzberg, Nat. Rev. Drug Discovery, 2015, 14, 623 CrossRef PubMed.
- (a) A. Samouilov, P. Kuppusamy and J. L. Zweier, Arch. Biochem. Biophys., 1998, 357, 1 CrossRef PubMed; (b) M. T. Gladwin, A. N. Schechter, D. B. Kim-Shapiro, R. P. Patel, N. Hogg, S. Shiva, R. O. Cannon III, M. Kelm, D. A. Wink, M. G. Espey, E. H. Oldfield, R. M. Pluta, B. A. Freeman, J. R. Lancaster Jr, M. Feelisch and J. O. Lundberg, Nat. Chem. Biol., 2005, 1, 308 CrossRef PubMed; (c) P. R. Castello, P. S. David, T. McClure, Z. Crook and R. O. Poyton, Cell Metab., 2006, 3, 277 CrossRef PubMed; (d) J. O. Lundberg, E. Weitzberg, S. Shiva and M. T. Gladwin, in Nitrite and Nitrate in Human Health and Disease, ed. N. S. Bryan and J. Loscalzo, Humana Press, 2011, p. 21 Search PubMed.
- P. R. Gardner, J. Inorg. Biochem., 2005, 99, 247 CrossRef PubMed.
- H. Ouellet, Y. Ouellet, C. Richard, M. Labarre, B. Wittenberg, J. Wittenberg and M. Guertin, Proc. Natl. Acad. Sci. U. S. A., 2002, 99, 5902 CrossRef PubMed.
- (a) W. G. Zumft, J. Inorg. Biochem., 2005, 99, 194 CrossRef PubMed; (b) P. Moënne-Loccoz, Nat. Prod. Rep., 2007, 24, 610 RSC; (c) N. J. Watmough, S. J. Field, R. J. L. Hughes and D. J. Richardson, Biochem. Soc. Trans., 2009, 37, 392 CrossRef PubMed.
- (a) H. Shimizu, S.-Y. Park, D.-S. Lee, H. Shoun and Y. Shiro, J. Inorg. Biochem., 2000, 81, 191 CrossRef PubMed; (b) A. Daiber, H. Shoun and V. Ullrich, J. Inorg. Biochem., 2005, 99, 185 CrossRef PubMed.
- (a) P. C. Ford and I. M. Lorkovic, Chem. Rev., 2002, 102, 993 CrossRef PubMed; (b) P. C. Ford, J. C. M. Pereira and K. M. Miranda, Struct. Bonding, 2014, 154, 99 CrossRef; (c) G. G. Martirosyan, T. S. Kurtikyan, A. S. Azizyan, A. V. Iretskii and P. C. Ford, J. Inorg. Biochem., 2013, 121, 129 CrossRef PubMed; (d) J. L. Heinecke, C. Khin, J. C. M. Pereira, S. A. Suárez, A. V. Iretskii, F. Doctorovich and P. C. Ford, J. Am. Chem. Soc., 2013, 135, 4007 CrossRef PubMed; (e) T. S. Kurtikyan, A. A. Hovhannisyan and P. C. Ford, Inorg. Chem., 2016, 55, 9517 CrossRef PubMed.
- (a) A. L. Speelman and N. Lehnert, Angew. Chem., Int. Ed., 2013, 52, 12283 CrossRef PubMed; (b) A. B. McQuarters, N. E. Wirgau and N. Lehnert, Curr. Opin. Chem. Biol., 2014, 19, 82 CrossRef PubMed; (c) A. P. Hunt and N. Lehnert, Acc. Chem. Res., 2015, 48, 2117 CrossRef PubMed; (d) A. L. Speelman, B. Zhang, C. Krebs and N. Lehnert, Angew. Chem., Int. Ed., 2016, 55, 6685 CrossRef PubMed; (e) M. Jana, N. Pal, C. J. White, C. Kupper, F. Meyer, N. Lenhert and A. Majumdar, J. Am. Chem. Soc., 2017, 139, 14380 CrossRef PubMed; (f) A. B. McQuarters, J. W. Kampf, E. E. Alp, M. Hu, J. Zhao and N. Lenhert, Inorg. Chem., 2017, 56, 10513 CrossRef PubMed; (g) M. K. Ellison and W. R. Scheidt, J. Am. Chem. Soc., 1999, 121, 5210 CrossRef.
- A. K. Patra, J. M. Rowland, D. S. Marlin, E. Bill, M. M. Olmstead and P. K. Mascharak, Inorg. Chem., 2003, 42, 6812 CrossRef PubMed.
- M. D. Pluth and S. J. Lippard, Chem. Commun., 2012, 48, 11981 RSC.
- (a) T. J. Collins, Acc. Chem. Res., 2002, 35, 782 CrossRef PubMed; (b) F. T. de Oliveira, A. Chanda, D. Banerjee, X. Shan, S. Mondal, L. Que Jr, E. L. Bominaar, E. Münck and T. J. Collins, Science, 2007, 315, 835 CrossRef PubMed.
- (a) A. K. Patra, R. Afshar, J. M. Rowland, M. M. Olmstead and P. K. Mascharak, Angew. Chem., Int. Ed., 2003, 42, 4521 CrossRef PubMed; (b) F.-T. Tsai, T.-S. Kuo and W.-F. Liaw, J. Am. Chem. Soc., 2009, 131, 3426 CrossRef PubMed; (c) C.-C. Tsou, W.-L. Yang and W.-F. Liaw, J. Am. Chem. Soc., 2013, 135, 18758 CrossRef PubMed; (d) B. C. Sanders, S. M. Hassan and T. C. Harrop, J. Am. Chem. Soc., 2014, 136, 10230 CrossRef PubMed; (e) T. C. Harrop, Adv. Inorg. Chem., 2015, 67, 243 CrossRef; (f) S. Kundu, W. Y. Kim, J. A. Bertke and T. H. Warren, J. Am. Chem. Soc., 2017, 139, 1045 CrossRef PubMed.
- J. H. Enemark and R. D. Feltham, Coord. Chem. Rev., 1974, 13, 339 CrossRef.
- (a) A. B. McQuarters, J. W. Kampf, E. E. Alp, M. Hu, J. Zhao and N. Lehnert, Inorg. Chem., 2017, 56, 10513 CrossRef PubMed; (b) A. P. Hunt and N. Lehnert, Acc. Chem. Res., 2015, 48, 2117 CrossRef PubMed.
- C. Kupper, J. A. Rees, S. Dechert, S. DeBeer and F. Meyer, J. Am. Chem. Soc., 2016, 138, 7888 CrossRef PubMed.
- J. Kaizer, E. J. Klinker, N. Y. Oh, J.-U. Rohde, W. J. Song, A. Stubna, J. Kim, E. Münck, W. Nam and L. Que Jr, J. Am. Chem. Soc., 2004, 126, 472 CrossRef PubMed.
- A. Chanda, X. Shan, M. Chakrabarti, W. C. Ellis, D. L. Popescu, F. T. de Oliveira, D. Wang, L. Que Jr, T. J. Collins, E. Münck and E. L. Bominaar, Inorg. Chem., 2008, 47, 3669 CrossRef PubMed.
- J. J. Yan, M. A. Gonzales, P. K. Mascharak, B. Hedman, K. O. Hodgson and E. I. Solomon, J. Am. Chem. Soc., 2017, 139, 1215 CrossRef PubMed.
- (a) V. K. K. Praneeth, F. Paulat, T. C. Berto, S. DeBeer George, C. Näther, C. D. Sulok and N. Lehnert, J. Am. Chem. Soc., 2008, 130, 15288 CrossRef PubMed; (b) A. Dey, M. Crow, K. Taniguchi, P. Lugo-Mas, S. Davin, M. Maeda, J. A. Kovacs, M. Odaka, K. O. Hodgson, B. Hedman and E. I. Solomon, J. Am. Chem. Soc., 2006, 128, 533 CrossRef PubMed.
- D. M. Copeland, A. S. Soares, A. H. West and G. B. Richter-Addo, J. Inorg. Biochem., 2006, 100, 1413 CrossRef PubMed.
- K. S. Suslick and R. A. Watson, Inorg. Chem., 1991, 30, 912 CrossRef.
- W. L. F. Armarego and C. L. L. Chai, in Purification of Laboratory Chemicals, 6th edn, Pergamon Press, Oxford, 2009 Search PubMed.
- C. P. Horwitz and A. Ghosh, US Pat., 7060818, 2006.
- C. L. Young, Solubility Data Series, Oxides of Nitrogen, International Union of Pure and Applied Chemistry (IUPAC), vol. 8, 1981 Search PubMed.
- G. M. Sheldrick, SHELXTL/PC Version 6.12 for Windows XP, Bruker AXS Inc., Madison, Wisconsin, USA, 2001 Search PubMed.
- A. L. Spek, Acta Crystallogr., Sect. D: Biol. Crystallogr., 2009, 65, 148 CrossRef PubMed.
- D. F. Evans, J. Chem. Soc., 1959, 2003 RSC.
- J. Lölinger and R. Scheffold, J. Chem. Educ., 1972, 49, 646 CrossRef.
- D. F. Evans and D. A. Jakubovic, J. Chem. Soc., Dalton Trans., 1988, 2927 RSC.
- G. N. George and I. J. Pickering, SAMPLE4, Stanford Synchrotron Radiation Laboratory, Stanford Linear Accelerator Center, Stanford University, Stanford, CA, 2000 Search PubMed.
- G. N. George and I. J. Pickering, EXAFSPAK, Stanford Synchrotron Radiation Laboratory, Stanford Linear Accelerator Center, Stanford University, Stanford, CA, 2000 Search PubMed.
- Source: SSRL Biological XAS beam line 7-3, 20-pole, 2-T wiggler, 0.8 mrad beam, SPEAR3 at 3 GeV. Optics: Si(220), liquid nitrogen cooled double crystal monochromator, fully tuned. Premonochromator flat, bent, vertically collimating Rh-coated Si M0 mirror; 9.5 keV cutoff, energy resolution 1 × 10⁻⁴ ΔE/E..
- S. P. Cramer, O. Tench, M. Yocum and G. N. George, Nucl. Instrum. Methods Phys. Res., Sect. A, 1988, 266, 586 CrossRef.
- R. A. Scott, J. E. Hahn, S. Doniach, H. C. Freeman and K. O. Hodgson, J. Am. Chem. Soc., 1982, 104, 5364 CrossRef.
- S. P. Cramer and K. O. Hodgson, Prog. Inorg. Chem., 1979, 25, 1 Search PubMed.
- J. G. DeWitt, J. G. Bentsen, A. C. Rosenzweig, B. Hedman, J. Green, S. Pilkington, G. C. Papaefthymiou, H. Dalton, K. O. Hodgson and S. J. Lippard, J. Am. Chem. Soc., 1991, 113, 9219 CrossRef.
- R. A. Scott, Methods Enzymol., 1985, 177, 414 Search PubMed.
- A. Tenderholt, B. Hedman and K. O. Hodgson, AIP Conf. Proc., 2007, 882, 105 CrossRef.
- T. E. Westre, P. Kennepohl, J. G. DeWitt, B. Hedman, K. O. Hodgson and E. I. Solomon, J. Am. Chem. Soc., 1997, 119, 6297 CrossRef.
- G. N. George and I. J. Pickering, EDG_FIT, Stanford Synchrotron Radiation Laboratory, Stanford Linear Accelerator Center, Stanford University, Stanford, CA, 2000 Search PubMed.
- S. P. Cramer, K. O. Hodgson, E. I. Stiefel and W. E. Newton, J. Am. Chem. Soc., 1978, 100, 2748 CrossRef.
- H. P. Gunnlaugsson, Spreadsheet Based Analysis of Mössbauer Spectra, Hyperfine Interact., 2016, 237, 79 CrossRef.
- M. J. Frisch, G. W. Trucks, H. B. Schlegel, G. E. Scuseria, M. A. Robb, J. R. Cheeseman, G. Scalmani, V. Barone, B. Mennucci, G. A. Petersson, H. Nakatsuji, M. Caricato, X. Li, H. P. Hratchian, A. F. Izmaylov, J. Bloino, G. Zheng, J. L. Sonnenberg, M. Hada, M. Ehara, K. Toyota, R. Fukuda, J. Hasegawa, M. Ishida, T. Nakajima, Y. Honda, O. Kitao, H. Nakai, T. Vreven, J. A. Montgomery Jr, J. E. Peralta, F. Ogliaro, M. Bearpark, J. J. Heyd, E. Brothers, K. N. Kudin, V. N. Staroverov, T. Keith, R. Kobayashi, J. Normand, K. Raghavachari, A. Rendell, J. C. Burant, S. S. Iyengar, J. Tomasi, M. Cossi, N. Rega, J. M. Millam, M. Klene, J. E. Knox, J. B. Cross, V. Bakken, C. Adamo, J. Jaramillo, R. Gomperts, R. E. Stratmann, O. Yazyev, A. J. Austin, R. Cammi, C. Pomelli, J. W. Ochterski, R. L. Martin, K. Morokuma, V. G. Zakrzewski, G. A. Voth, P. Salvador, J. J. Dannenberg, S. Dapprich, A. D. Daniels, O. Farkas, J. B. Foresman, J. V. Ortiz, J. Cioslowski and D. J. Fox, Gaussian 09, Gaussian Inc., Wallingford, CT, 2009 Search PubMed.
- A. D. Becke, Phys. Rev. A: At., Mol., Opt. Phys., 1988, 38, 3098 CrossRef.
- J. P. Perdew, Phys. Rev. B: Condens. Matter Mater. Phys., 1986, 33, 8822 CrossRef.
- A. D. Becke, J. Chem. Phys., 1993, 98, 5648 CrossRef.
- C. Lee, W. Yang and R. G. Parr, Phys. Rev. B: Condens. Matter Mater. Phys., 1988, 37, 785 CrossRef.
- F. Neese, ORCA – an ab initio, Density Functional and Semiempirical program package, Version 2.9.1, Max-Planck-Insitut für Bioanorganische Chemie, Mülheim and der Ruhr, 2008 Search PubMed.
- M. Römelt, S. Ye and F. Neese, Inorg. Chem., 2009, 48, 784 CrossRef PubMed.
- A. L. Tenderholt, QMForge: A Program to Analyze Quantum Chemistry Calculations, version 2.4 Search PubMed.
Footnote |
| † Electronic supplementary information (ESI) available: Tables S1–S6 for crystallographic data, Mössbauer parameters, XAS data and computational geometric parameters and Fig. S1–S11. CCDC 1574430, 1574431. For ESI and crystallographic data in CIF or other electronic format see DOI: 10.1039/c8sc01962b |
| This journal is © The Royal Society of Chemistry 2018 |