 Open Access Article
Construction of an enzyme-free concatenated DNA circuit for signal amplification and intracellular imaging†
Huimin
Wang
a,
Chunxiao
Li
a,
Xiaoqing
Liu
a,
Xiang
Zhou
 b and
Fuan
Wang
 *a
*a
aKey Laboratory of Analytical Chemistry for Biology and Medicine (Ministry of Education), College of Chemistry and Molecular Sciences, Wuhan University, Wuhan, P. R. China. E-mail: fuanwang@whu.edu.cn
bKey Laboratory of Biomedical Polymers-Ministry of Education, College of Chemistry and Molecular Sciences, Wuhan University, 430072 Wuhan, China
First published on 6th June 2018
Abstract
Nucleic acid circuits have shown promising potential for amplified detection of biomarkers with interest in biologically important engineering applications. In this work, by properly integrating two signal amplification approaches, catalytic hairpin assembly (CHA) and hybridization chain reaction (HCR), a concatenated CHA–HCR system was established as an isothermal enzyme-free amplification strategy for highly sensitive and selective nucleic acid assay. The target catalyzes the self-assembly of CHA hairpin substrates into dsDNA products, where the split segments of HCR trigger are successively connected to drive the subsequent autonomous cross-opening of HCR hairpins, leading to the construction of HCR tandem copolymeric dsDNA nanowires. The resulting HCR copolymer brings a fluorophore donor/acceptor pair into close proximity that allows an efficient generation of FRET readout signal. Moreover, the optimized CHA–HCR circuit, upon the incorporation of an auxiliary sensing module, can be converted into a universal sensing platform for detecting cancerous biomarkers (e.g., a well-known oncogene miR-21) through a convenient easy-to-integrate procedure. The concatenated CHA–HCR amplifier enables accurate intracellular miRNA imaging in living cells, which is especially suitable for in situ amplified detection of lowly expressed endogenous analytes. The inherent synergistically accelerated recognition and hybridization features of CHA–HCR circuit contribute to the amplified detection of endogenous RNAs in living cells. The flexible and programmable nature of the homogeneous CHA–HCR system provides a versatile and robust toolbox for a wide range of research fields, such as in vivo bioimaging, clinical diagnosis and environmental monitoring.
Introduction
Isothermal amplification of nucleic acids has been extensively used in various biological studies because of its efficient and rapid amplification ability at a constant temperature rather than using conventional complex thermocycling of polymerase chain reaction (PCR).1–3 These isothermal amplification methods include nucleic acid sequence-based amplification (NASBA),4 exponential strand displacement amplification (E-SDA),5 rolling circle amplification (RCA),6 loop-mediated isothermal amplification (LAMP)7 and so on.8–11 However, all of these enzyme-mediated amplification strategies need additional requisite DNA polymerase or other enzymes that might have the limitations of environmental sensitivity and poor repeatability. So the development of new enzyme-free amplification approaches is more appealing for biological and biomedical applications.Isothermal enzyme-free amplification has thus been developed, including ribozyme- or DNAzyme-assisted amplifications12–14 and entropy-driven DNA circuit15-based amplifications. DNAzyme amplification is based on cyclic cleavage reactions while DNA circuit amplifications rely merely on toehold-mediated successive hybridization processes. Unfortunately, the ease and accessibility of DNAzyme substrates need to be solved before their extensive applications can be envisaged. Hybridization chain reaction (HCR) and catalyzed hairpin assembly (CHA) are two typical non-enzymatic amplification circuits. HCR provides a general principle for assembling dsDNA copolymeric nanowires via trigger-driven successive cross-opening of hairpin substrates.16 CHA is achieved by catalyzed cross-hybridization of hairpin reactants to generate numerous dsDNA products.17 Both of these two systems have been widely utilized for amplified detection of target via fluorescent,18–20 colorimetric21–23 and electrochemical24,25 transductions. For example, the isothermal autonomous HCR was utilized for amplified DNA detection by successively coupling pyrene monomers into pyrene excimers.18 Similarly, CHA was successfully adapted for amplified detection of nucleic acid and small molecule targets.21 These different approaches achieve an isothermal enzyme-free amplification of target molecules, as well as an efficient transduction of molecular recognitions into observable signals. More efforts have been devoted to the signal transduction of the amplification means, while rare interest is spent on non-enzymatic nucleic acid circuits themselves.26–29 Recently, different cascaded circuits have emerged as improved amplifiers for sensing purposes.30–34 Here the product of the upstream circuit acts as a versatile mediator for triggering the downstream amplification procedure. HCR and CHA circuits have been further explored with significant amplification capabilities by their integration with Mg2+-dependent26,27 or hemin/G-quadruplex DNAzymes.28,29
Intracellular RNA plays an essential role in various biological processes, such as encoding, regulation and expression of genes. More importantly, the varied expression levels of mRNAs reveal crucial information on tumor progression.35 The intracellular location of mRNA is closely related to the spatial restriction of protein activities inside living cells.36 Live-cell imaging methods hold great promise for understanding the spatial and temporal resolution of intracellular RNA dynamics. Current studies are mainly focused on the in situ conjugation with enzymes that catalyze different imaging reactions.37 However, the precise location of target molecules is seriously limited originating from the high diffusibility of small molecular products. A satisfactory spatial resolution could be achieved through various fluorophore-labelled molecular probes, yet the short nature of miRNAs needs high affinity molecular probes or significant amplification approaches to acquire detectable readout signals. Several attempts have thus been made to improve the sensitivity and spatial resolution of intracellular imaging methods through a nucleic acid amplification strategy. HCR is reported as a cost-effective imaging method for amplified intracellular imaging of mRNAs38 and immunotargets.39 CHA is also utilized with signal gain for mRNA imaging inside living cells.40 However, the performance of these linear amplification strategies is rather limited with a comparably low signal gain. It is anticipated that, by using a successive and sequential amplification procedure, the isothermal enzyme-free cascaded circuit can be utilized for high performance intracellular imaging fields.
In this work, we constructed an isothermal enzyme-free cascaded amplification platform for highly sensitive and selective detection of intracellular miRNA based on an ingenious coupling of CHA and HCR circuits. The two-layered amplification circuit starts with upstream CHA, where the target catalyzes the autonomous cross-opening of two hairpin substrates, yielding numerous dsDNA products that are encoded with initiator sequences for downstream HCR circuit. As a result of the primary recognition event, the product of upstream CHA drives the autonomous self-assembly of HCR hairpin reactants, resulting in copolymeric dsDNA nanowires that simultaneously bring a fluorophore donor/acceptor pair into close proximity to generate a tremendously amplified Förster resonance energy transfer (FRET) signal. As a versatile, efficient and robust amplification strategy, the CHA–HCR amplifier enables a facile discrimination of nucleic acid analyte from its allelic gene mutants, which might originate from the progressively guaranteed molecular recognitions and the synergistically accelerated hybridization features of the cascaded circuit. The overall hybridization reaction process was systematically investigated to prove the synergistic amplification principle. Importantly, the CHA–HCR circuit was demonstrated to be a universal amplification module for general sensing purposes. This is exemplified by the establishment of a highly sensitive and selective detection platform for miRNA by integrating an auxiliary sensing module into the present CHA–HCR amplifier. The easy-to-integrate “plug-and-play” procedure enabled amplified miRNA detection with minimal system leakage yet high signal gain in living cells. The present autonomous amplification strategy provides a universal and rational toolbox for a highly sensitive assay of various biomarkers and thus holds great promise for probing many cancer-related biomarkers in clinical diagnosis and assessment.
Results and discussion
The CHA–HCR system involves two signal amplification approaches: upstream CHA and downstream HCR. The downstream HCR is activated upon a successful execution of CHA, as schematically depicted in Fig. 1. The CHA reaction consists of two hairpin structures, H1 and H2, which are designed to include the appropriate sequences (where domain x is complementary to domain x*, for details see Fig. S1†). The target I opens H1 through toehold-mediated strand displacement, yielding DNA assembly “I-H1”. The released single-stranded domain b–c* of “I-H1” furtherly triggers the opening of H2 to form an intermediate structure “I-H1·H2” where the newly exposed tether c*–a–b stimulates the strand displacement of I to produce the dsDNA “H1·H2” assembly and to regenerate concomitantly initiator I. This allows the successive activation of the CHA circuit that catalyzes the cross-hybridization of hairpins H1 and H2 which bring the separate segments d* and c* into close proximity. Thus, the I-initiated CHA leads to the catalyzed assembly of numerous reconstituted c*–d* co-localized structures T. For the following downstream HCR, segments d* and c* act as the toehold domain and branch-migration region, respectively.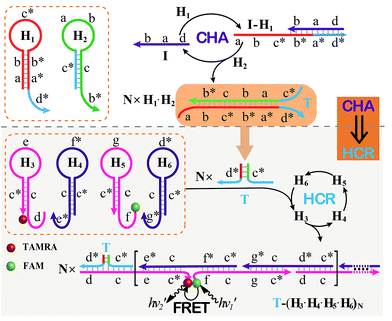 | ||
| Fig. 1 Schematic of the isothermal enzyme-free two-layered cascaded CHA–HCR circuit for an accurate DNA assay. | ||
The downstream HCR system is composed of four hairpins H3, H4, H5, and H6 (for details see Fig. S2†). Here H3 is functionalized with a fluorescence acceptor (TAMRA) at its 3′-end while H5 is labeled with a fluorescence donor (FAM) at its 5′-end. Upon the formation of the H1·H2 duplex product through the upstream CHA circuit, the co-localized c*–d* structure T opens H3, resulting in an intermediate T-H3 structure. The exposed domain e–c* of T-H3 then hybridizes and opens H4 to yield an intermediate structure T-H3·H4. The released domain c*–f* of H4 facilitates its hybridization with H5 to form an intermediate structure T-H3·H4·H5. This structure brings the two fluorophores (FAM and TAMRA) into close proximity, allowing for the generation of an efficient FRET process. The exposed domain g–c* of H5 opens H6 to yield an intermediate structure T-H3·H4·H5·H6 and to expose a single-stranded domain c*–d* that corresponds to an I-analog sequence. Thus the activated H6 further unfolds H3 and initiates the following successive autonomous cross-hybridization reactions. By the autonomous HCR-involved self-assembly of hairpins H3, H4, H5 and H6, dsDNA copolymeric nanowires consisting of a large amount of adjacent FAM/TAMRA fluorophores pairs are assembled, producing a tremendously amplified FRET signal. Note that the present FRET-generating principle could be easily extended to a different FRET-dissipating process where a more sophisticated dual-labeled hairpin probe is indispensably needed.
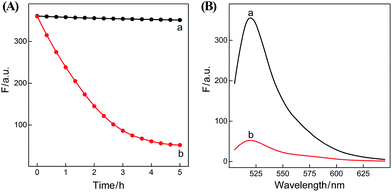
In summary, the upstream CHA-initiated successive self-assembly of H1 and H2 generates numerous dsDNA structures or T triggers that initiate the downstream HCR-driven cyclic and sequential hybridizations among H3, H4, H5 and H6, resulting in the formation of numerous long dsDNA copolymeric nanowires and the generation of a remarkable FRET signal. During this process, each H1/H2 pair hybridization event produces one dsDNA product as a transmitted HCR trigger while each H3·H4·H5·H6 hybridization event leads to one FRET signal generation. Thus the successive multiple hybridization events of CHA and HCR circuits lead to significant amplification capacity which originates from the synergistic effect between these two different amplification strategies. The hairpin components of the isothermal CHA–HCR system were theoretically (by Mfold software)41 and experimentally optimized for high-performance sensing. It is essential to adjust the base distribution of two segments (c* and d*) of CHA hairpins to effectively trigger the downstream HCR (for details see Fig. S3†). Under the appropriately optimized conditions, the proof-of-concept demonstration of the CHA–HCR system was investigated systematically at room temperature (25 °C, for details see Fig. S4†). As depicted in Fig. 2(A), the mixture of H1 + H2 + H3 + H4 + H5 + H6 generates no fluorescence change (curve a), indicating that the CHA–HCR circuit is metastable enough without signal leakage, while a dramatic fluorescence change is observed after the introduction of initiator I into the mixture until it reaches a plateau after ca. 5 h (curve b). Thus, the fluorescence spectra were acquired after a fixed time-interval of 5 h for all of the subsequent experiments (Fig. 2(B)). The cascaded CHA–HCR circuit generated a more obvious fluorescent response than the conventional HCR or CHA control system (Fig. S5†), revealing that the enhanced amplification efficiency originates from an exquisite integration of the CHA circuit into the HCR scheme. Here the upstream CHA is based on the target-catalyzed successive DNA hybridization and displacement reactions, of which the analyte will not be consumed and its functions will not be affected, thus eliminating undesired systematic fluctuations during the intracellular sensing process.
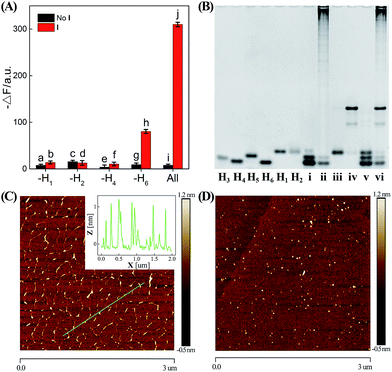
In order to confirm the autonomous CHA–HCR cascade, one of the non-labeled hairpin reactants (H1, H2, H4, or H6) was removed from the CHA–HCR mixture to acquire the accompanying fluorescence spectra (Fig. 3(A) and S6†). As shown in Fig. 3(A), scarcely no fluorescence change was observed for the I-triggered CHA–HCR circuit when H1 or H2 was removed from the upstream CHA (points b and d, respectively) or H4 was expelled from the downstream HCR (point f). Meanwhile, an apparent fluorescence change (−ΔF) was shown for the I-activated CHA–HCR mixture without H6 (point h). It is reasonable since the absence of H1 or H2 could significantly block the upstream CHA layer while the removal of H4 could efficiently block the downstream HCR layer for the concatenated CHA–HCR circuit. In addition, the H6-excluded CHA–HCR system corresponded to a conventional CHA system where the intact CHA carried out single-stage amplification and the subsequent H6-expelled HCR acted merely as a signal readout device. Also, no fluorescence change was observed by removing one of the non-labeled hairpins from the CHA–HCR mixture without initiator I (points a, c, e and g). Clearly, the CHA–HCR circuit can only be activated with both upstream CHA- and downstream HCR-involved reactants. Gel electrophoresis was further performed to investigate the upstream CHA, the downstream HCR and the integrated CHA–HCR circuits, Fig. 3(B). No new band appeared for CHA, HCR and CHA–HCR reactants without their corresponding initiators, suggesting that all of these hairpin reactants are stable enough without false hybridizations. A new band of high molecular weight was observed for the initiator-activated CHA mixture and corresponded to the dsDNA product. Also, many new bright bands with molecular weight as high as thousands of base pairs were emerged for the respective triggered HCR and CHA–HCR systems. Obviously, these metastable hairpin substrates of CHA, HCR and CHA–HCR circuits can only be driven by their corresponding triggers, which is in good accordance with fluorescence results shown in Fig. 2. Furthermore, the morphological features of CHA–HCR-generated dsDNA nanostructures were characterized by atomic force microscopy (AFM). Micrometer-long dsDNA copolymeric nanowires were observed for the initiator-triggered CHA–HCR circuit (Fig. 3(C)) while tiny dots of hairpin monomers were observed for the non-triggered CHA–HCR system (Fig. 3(D)). The height of these self-assembled dsDNA nanowires was measured to be ∼1 nm, which corresponded to the height of a characteristic dsDNA. In conclusion, these results clearly demonstrate the successful implementation of our concatenated CHA–HCR circuit with significant amplification capacity.
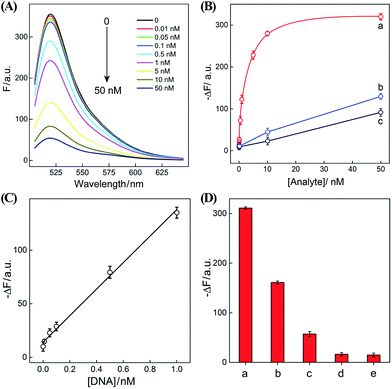
After ensuring a proper operation of our proposed CHA–HCR circuit, we investigated the fluorescence spectra of the CHA–HCR amplifier in the presence of different concentrations of target DNA after a fixed time interval of 5 h (Fig. 4(A)). The fluorescence of the H6-expelled CHA–HCR and the merely HCR systems was also acquired as traditional CHA and HCR controls (Fig. S7(A) and (B),† respectively). As shown in Fig. 4(B), the absolute fluorescence change (−ΔF) increased with elevated concentrations of target DNA, indicating that the signal generation of upstream CHA, HCR or integrated CHA–HCR is highly dependent on initiator DNA. Moreover, the concentration-dependent signal tendency of the CHA–HCR amplifier is more obvious than that of traditional CHA or HCR system, validating an enhanced amplification capability of our proposed CHA–HCR strategy. Fig. 4(C) depicts a linear correlationship between the absolute fluorescence change (−ΔF) and target concentration ranging from 0 to 1 nM (R2 = 0.99). The detection limits of the coupled CHA–HCR amplifier, and the corresponding CHA and HCR control systems were acquired to be 4 pM, 400 pM and 200 pM, respectively (based on a conventional 3σ calculation method). The performance of the integrated CHA–HCR amplifier is comparable and even better than some of the reported enzyme-free fluorescence detection methods (Table S3†), which we believe is attributed to the aforementioned synergistic amplification effect between CHA and HCR constituents.
The performance of the CHA–HCR amplifier not merely relies on its high amplification capacity, but also on its high selectivity. To evaluate the selectivity of our CHA–HCR amplifier, the respective sequence of one-, two-, and three-base mutant DNA targets, Ia, Ib, and Ic, was examined by incubating these mutants with the CHA–HCR mixture (for details see Fig. S8†). Fig. 4(D) shows the absolute fluorescence changes (−ΔF) of the CHA–HCR mixture upon analyzing I, Ia, Ib, and Ic (50 nM each). It is clear that only target I can generate an intense fluorescence change (bar a) while the two-base mutant Ib (bar c) and three-base mutant Ic (bar d) show fluorescence changes that are almost identical to the background of the sensing platform (bar e). Albeit an apparent fluorescence change is observed for single-base mutant Ia (bar b), this signal could be easily discriminated from that of fully complementary target I. These results clearly demonstrate the high sensitivity and selectivity of our CHA–HCR-based sensing platform.
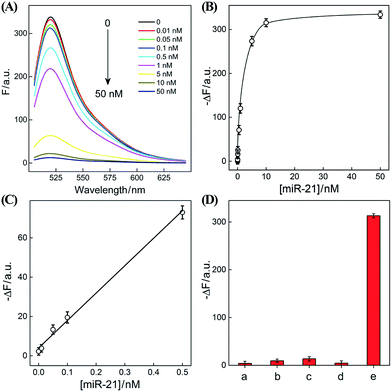
The optimized CHA–HCR-based sensing platform can also be used as a general detection platform for analyzing other nucleic acid targets, e.g., miR-21, without changing the sequences of all hairpin constituents. MiR-21 is one of the most frequently up-regulated microRNA in solid tumors and is associated with a wide range of human cancers.42,43 As shown in Fig. 5, a foreigner hairpin H7 was engineered to recognize the miR-21 target, and the resulting I-exposed product worked as a versatile trigger for the synergistically amplified CHA–HCR system, resulting in a significant FRET readout signal. The auxiliary “helper” hairpin was optimized and integrated into the well-established CHA–HCR amplifier for detecting miR-21 (for details see Fig. S9†). Fig. 6(A) shows the resulting fluorescence spectra of the furtherly extended CHA–HCR sensing platform upon analyzing miR-21 of varied concentrations for a fixed time interval of 5 h. The absolute fluorescence change (−ΔF) increased substantially with elevated concentrations of miR-21 (Fig. 6(B)), which showed a good accordance with the DNA assay. From the derived calibration curve (Fig. 6(C)), a detection limit of 2 pM was acquired for the miR-21 target. This demonstrates that the present CHA–HCR amplifier can be utilized as a general amplification module with the aid of an auxiliary sensing module consisting of a “helper” hairpin DNA. The selectivity of the CHA–HCR-amplified miR-21 assay was further investigated. β-Actin mRNA, son DNA and let-7a miRNA are chosen as the representative interference nucleic acids for studying the specificity of the updated CHA–HCR-amplifier. As shown in Fig. 6(D) and S10,† no distinct fluorescence response is achieved upon incubating the extended CHA–HCR mixture with these interfering mRNAs (curves a, b, c and d) while only the miR-21 target generates a significantly amplified fluorescence readout signal (curve e), indicating a high selectivity of the newly established miR-21-targeting system.
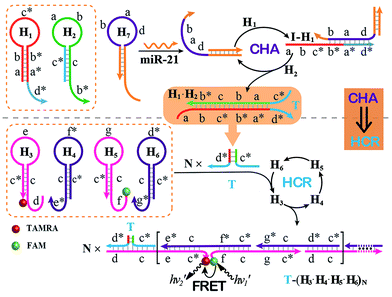 | ||
| Fig. 5 Schematic of the general sensing platform for amplified miR-21 detection by introducing a “helper” hairpin H7 into the autonomous CHA–HCR system. | ||
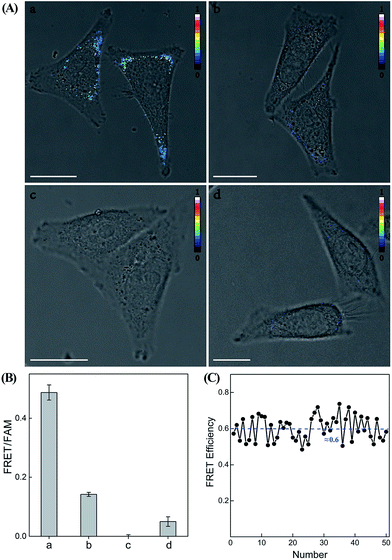
Having demonstrated the high performance of the CHA–HCR amplifier to accurately quantify miR-21 analyte in vitro, we then applied the system to image and monitor miR-21 in living cells using the confocal laser scanning microscopy (CLSM) technique. All of the hairpin reactants were synthesized with phosphorothioate bonds to enhance their intracellular biostabilities in complex intracellular environment. In addition, to minimize the undesirable system fluctuations, here the FRET readout was defined as the fluorescence emission ratio of FRET to FAM (FFRET/FFAM), different from the in vitro fluorescence experiments, for an accurate intracellular miR-21 assay (for detailed description, see the Experimental section). MCF-7 cells, which are well known to overexpress miR-21,43 were chosen to investigate the capability of the CHA–HCR-mediated intracellular miR-21 imaging strategy (Fig. 7 and S11†). All components of the miR-21-targeting system were transfected into MCF-7 living cells via Lipofectamine 3000, and incubated with cells at 37 °C for 5 h (an optimized incubation time, see Fig. S12†). An obvious FRET readout was observed for the CHA–HCR-mediated miR-21 imaging system (sample a of Fig. 7(A) and (B)), which was consistent with a high miR-21 expression in MCF-7 cells. An exact location of the miR-21 analyte was also revealed from these intracellular images. Interestingly, the FRET readout of the CHA-imaging system (sample b of Fig. 7(A) and (B)) was obviously weaker than that of the CHA–HCR circuit in MCF-7 cells. This, on the other hand, further demonstrated a more efficient amplification of the CHA–HCR circuit than that of CHA alone even in biological systems. Moreover, no FRET readout was observed by introducing an anti-miRNA antisense inhibitor oligonucleotide, which was able to knock down the content of intracellular miR-21 (sample c of Fig. 7(A) and (B)). It was clearly demonstrated that the FRET readout of the CHA–HCR imaging system was closely related to the varied miR-21 expressions in living cells. Furthermore, 3D Z-stack projections of MCF-7 cells were taken from a series of Z-section CLSM images following the CHA–HCR imaging procedure. Clearly, miR-21 was localized throughout the entire cell except nucleus as revealed by its corresponding intracellular FRET readout signal (Fig. S13†). Note that the statistical histogram analysis of the FRET signal was collected from a large number of their corresponding living cells under a series of Z-stack projections (Fig. 7(B)). Then, the CHA–HCR imaging system was applied to Hela cells, which exhibited a relatively low miR-21 expression, and revealed a weak FRET transduction as expected (sample d of Fig. 7(A) and (B)). The CHA–HCR amplifier was able to distinguish different cell lines with diverse expression levels of miR-21. To further explore the in situ amplification capability of the CHA–HCR system, control experiments that excluded one of the non-labeled hairpin reactants were also carried out for intracellular imaging applications. Not surprisingly, consistent with the aforementioned in vitro experiments, no obvious FRET signal was observed for the H1-, H2- or H4-expelled CHA–HCR imaging system, while a slightly lower FRET signal was revealed for the H6-expelled CHA–HCR system, which corresponds to a conventional CHA-imaging system (for details see Fig. S14†). These results indicate the improved amplification capacity of the cascaded CHA–HCR scheme for imaging miR-21 in living cells. As shown in Fig. 7(C), a relatively stable FRET efficiency of ∼0.6 was acquired for the CHA–HCR-imaging system by using a conventional acceptor-photobleaching technique. These results imply that the CHA–HCR circuit holds great potential for accurately detecting cancer-related biomarkers, and thus provides promising approaches in early cancer diagnosis.
Conclusions
We have introduced an enzyme-free isothermal autonomous sensing platform by using the concatenated CHA–HCR circuit as a powerful signal amplification means. In upstream CHA, the trigger induced the successive generation of numerous colocalized initiator DNAs for downstream HCR that drives the self-assembly of copolymeric DNA nanowires. The generated dsDNA copolymer simultaneously brings a fluorophore donor (FAM) and acceptor (TAMRA) into close proximity, resulting in a tremendously amplified FRET signal. Based on its intrinsic multiple granted recognitions and synergistic signal amplifications, the CHA–HCR circuit can selectively discriminate the target from its one-, two-, three-base mutant sequences. This sensing strategy can be easily adapted as a universal amplification module for analyzing other biologically important targets upon its facile integration with the auxiliary sensing module that is comprised of a foreigner “helper” hairpin. The CHA–HCR sensing platform was successfully applied for sensitive and selective detection of miR-21 with a detection limit corresponding to 2 pM. More importantly, the concatenated CHA–HCR system was further utilized for accurate intracellular miR-21 imaging in living cells, and showed great potential for analyzing a lowly expressed, short RNA target in real time. Note that other powerful affinity probes, e.g., aptamers, could be easily introduced into the present sensing strategy, it is thus envisaged that the CHA–HCR imaging system plays a crucial role in monitoring other small metabolite targets of interest inside living cells, and for understanding chemical molecular events in real time. Besides the analytical application of the system, it may also offer new promising possibilities for early cancer diagnosis and therapeutic intervention applications.Experimental
Materials
4-(2-Hydroxyethyl)piperazine-1-ethanesulfonic acid sodium salt (HEPES sodium salt), sodium chloride and magnesium chloride were purchased from Sigma-Aldrich. All HPLC-purified oligonucleotide sequences were purchased from Sangon Biotech. Co., Ltd. (Shanghai, China). All hairpins were heated at 95 °C for 5 min and then allowed to cool down to room temperature (25 °C) for 2 hours before use. Ultrapure water from a Millipore Milli-Q water purification system was used in all of the experiments. The sequences of all oligomers are shown in Tables S1 and S2, ESI.† Human breast cancer (MCF-7) and cervical cancer cells (Hela) were purchased from Shanghai Institutes for Biological Sciences (SIBS).Fluorescence analysis
All assays were performed in 10 mM HEPES buffer (pH 7.2) containing 1 M NaCl and 50 mM MgCl2. For analyzing DNA target I, the concentration of H1, H2, and H3 was fixed at 400 nM each while the concentration of H4, H5 and H6 corresponded to 200 nM each. For analyzing miRNA, the concentration of “helper” probe hairpin H7 was fixed at 50 nM while the concentrations of other DNA probes were kept the same as the aforementioned CHA–HCR circuit. Unless specified, the fluorescence spectra were recorded after 5 h.Native polyacrylamide gel electrophoresis
The 9% precast polyacrylamide gel was prepared with 5× TBE buffer (445 mM Tris/445 mM boric acid/10 mM EDTA, pH 8.0). The sample-included gel was run at 120 V for 3.5 h in 1× TBE buffer, stained with Gel-Red, and viewed under UV light (λ = 365 nm). The HCR, CHA and CHA–HCR mixtures were respectively incubated with their initiators or triggers at 25 °C for 5 h. Detailed reaction conditions are the same as the fluorescence assay.Atomic force microscopy (AFM) imaging
MgCl2 (5 mM) was deposited on a freshly cleaved mica surface (Structure Probe Inc., USA) for 2 min, followed by its rinsing with ultrapure water and drying under a stream of nitrogen. The resulting CHA–HCR dsDNA products were diluted with HEPES buffer (20 mM, pH 7.2), and then deposited on the mica surface. AFM images were taken using a Multimode-8 AFM with a NanoScope V controller (Bruker) in tapping mode.Cell culture and transfection for the CHA–HCR-imaging system
MCF-7 and Hela cells were grown in Dulbecco's Modified Eagle Medium (DMEM) containing 10% FBS and 1% penicillin/streptomycin at 37 °C in a 5% CO2 atmosphere. Cells were plated in 20 mm glass bottomed culture dishes for 12 h before transfection with DNA probes. Transfection was performed according to the manufacturer's protocol. Briefly, the CHA–HCR mixture containing H7* (0.05 nmol) and H1* + H2* + H3* + H4* + H5* + H6* (0.2 nmol each) was prepared in Opti-MEM (200 μL), and then mixed with Lipofectamine 3000 (5 μL) in Opti-MEM (200 μL) for 10 min. Then the plated cells were transfected with the mixture supplied with 20% FBS at 37 °C for 5 h. Subsequently, the cultured cells were washed three times with phosphate buffered saline (PBS) for CLSM observations. For the anti-miRNA antisense inhibiter experiment, MCF-7 cells were pre-transfected with the inhibiter oligonucleotide (final concentration, 100 nM) for 1 h, followed by extensive transfection and incubation with the CHA–HCR system as described above for 5 h.Confocal laser scanning microscopy (CLSM) characterization
All cellular fluorescence images were collected with a Leica TCS SP8 confocal laser scanning microscope system. An external excitation of 488 nm was chosen for the green channel of the fluorophore (FAM) donor. The FRET excitation of 488 nm was chosen for the yellow channel of the fluorophore (TAMRA) acceptor. A stimulation of 561 nm was selected for the red channel of the TAMRA fluorophore. All images were developed using a 60× objective lens with oil. The FRET signal was denoted as the fluorescence intensity ratio of FRET/FAM in intracellular imaging systems upon an excitation at 488 nm. The background FRET signal, generated from solely the FAM or TAMRA fluorophore, was subtracted from each of the samples to improve the reliability of our FRET transductions. After incubating the updated CHA–HCR mixture with MCF-7 or Hela cells for 5 h at 37 °C, the Z-stack projections were taken with 51 slice stacks at 0.2 μm increments throughout the entire cells. All FRET images of living cells were normalized by using ImageJ and Fiji software.Conflicts of interest
The authors declare no conflict of interest.Acknowledgements
This work is supported by the National Natural Science Foundation of China (21503151 and 81602610), National Basic Research Program of China (973 Program, 2015CB932600), Jiangsu Provincial Natural Science Foundation of China (BK20161248 and BK20160381), Wuhan Youth Science and Technology Plan (No. 2016070204010131), Fundamental Research Funds for the Central Universities (No. 2042018kf0210) and 1000 Young Talent (to F. W. and X. L.).Notes and references
- Y. Zhao, F. Chen, Q. Li, L. Wang and C. Fan, Chem. Rev., 2015, 115, 12491–12545 CrossRef PubMed.
- R. Duan, X. Lou and F. Xia, Chem. Soc. Rev., 2016, 45, 1738–1749 RSC.
- H. Zhang, F. Li, B. Dever, X.-F. Li and X. C. Le, Chem. Rev., 2013, 113, 2812–2841 CrossRef PubMed.
- J. Compton, Nature, 1991, 350, 91–92 CrossRef PubMed.
- G. T. Walker, M. C. Little, J. G. Nadeau and D. D. Shank, Proc. Natl. Acad. Sci. U. S. A., 1992, 89, 392–396 CrossRef.
- W. Zhao, M. M. Ali, M. A. Brook and Y. Li, Angew. Chem., Int. Ed., 2008, 47, 6330–6337 CrossRef PubMed.
- B. Li, X. Chen and A. D. Ellington, Anal. Chem., 2012, 84, 8371–8377 CrossRef PubMed.
- F. Wang, C.-H. Lu and I. Willner, Chem. Rev., 2014, 114, 2881–2941 CrossRef PubMed.
- Y. Tang, B. Lu, Z. Zhu and B. Li, Chem. Sci., 2018, 9, 760–769 RSC.
- Z. Zhu, Y. Zhou, X. Xu, R. Wu, Y. Jin and B. Li, Anal. Chem., 2018, 90, 814–820 CrossRef PubMed.
- F. Wang, J. Elbaz and I. Willner, J. Am. Chem. Soc., 2012, 134, 5504–5507 CrossRef PubMed.
- T. A. Lincoln and G. F. Joyce, Science, 2009, 323, 1229–1232 CrossRef PubMed.
- I. Willner, B. Shlyahovsky, M. Zayats and B. Willner, Chem. Soc. Rev., 2008, 37, 1153–1165 RSC.
- F. Wang, J. Elbaz, C. Teller and I. Willner, Angew. Chem., Int. Ed., 2011, 50, 295–299 CrossRef PubMed.
- D. Y. Zhang and G. Seelig, Nat. Chem., 2011, 3, 103–113 CrossRef PubMed.
- R. M. Dirks and N. A. Pierce, Proc. Natl. Acad. Sci. U. S. A., 2004, 101, 15275–15278 CrossRef PubMed.
- P. Yin, H. M. T. Choi, C. R. Calvert and N. A. Pierce, Nature, 2008, 451, 318–322 CrossRef PubMed.
- J. Huang, Y. Wu, Y. Chen, Z. Zhu, X. H. Yang, C. J. Yang, K. M. Wang and W. Tan, Angew. Chem., Int. Ed., 2011, 50, 401–404 CrossRef PubMed.
- Y. S. Jiang, B. Li and J. N. Milligan, J. Am. Chem. Soc., 2013, 135, 7430–7433 CrossRef PubMed.
- Z. Cheglakov, T. M. Cronin, C. He and Y. Weizmann, J. Am. Chem. Soc., 2015, 137, 6116–6119 CrossRef PubMed.
- B. Li, A. D. Ellington and X. Chen, Nucleic Acids Res., 2011, 39, e110 CrossRef PubMed.
- J. Ren, J. Wang, L. Han, E. Wang and J. Wang, Chem. Commun., 2011, 47, 10563–10565 RSC.
- P. Liu, X. Yang, S. Sun, Q. Wang, K. Wang, J. Huang, J. Liu and L. He, Anal. Chem., 2013, 85, 7689–7695 CrossRef PubMed.
- Y. Du and S. Dong, Anal. Chem., 2017, 89, 189–215 CrossRef PubMed.
- B. Zhang, B. Liu, D. Tang, R. Niessner, G. Chen and D. Knopp, Anal. Chem., 2012, 84, 5392–5399 CrossRef PubMed.
- F. Wang, J. Elbaz, R. Orbach, N. Magen and I. Willner, J. Am. Chem. Soc., 2011, 133, 17149–17151 CrossRef PubMed.
- H. Xie, Y. Chai, Y. Yuan and R. Yuan, Chem. Commun., 2017, 53, 8368–8371 RSC.
- S. Shimron, F. Wang, R. Orbach and I. Willner, Anal. Chem., 2012, 84, 1042–1048 CrossRef PubMed.
- A. Zheng, J. Li, J. Wang, X. Song, G. Chen and H. Yang, Chem. Commun., 2012, 48, 3112–3114 RSC.
- J. Zhu, L. Wang, X. Xu, H. Wei and W. Jiang, Anal. Chem., 2016, 88, 3817–3825 CrossRef PubMed.
- J. Wei, X. Gong, Q. Wang, M. Pan, X. Liu, J. Liu, F. Xia and F. Wang, Chem. Sci., 2018, 9, 52–61 RSC.
- B. Li, Y. Jiang, X. Chen and A. D. Ellington, J. Am. Chem. Soc., 2012, 134, 13918–13921 CrossRef PubMed.
- Q. Wang, M. Pan, J. Wei, X. Liu and F. Wang, ACS Sens., 2017, 2, 932–939 CrossRef PubMed.
- J. Wang, M. Pan, J. Wei, X. Liu and F. Wang, Chem. Commun., 2017, 53, 12878–12881 RSC.
- S. Tyagi, Nat. Methods, 2009, 6, 331–338 CrossRef PubMed.
- D. S. Johnston, Nat. Rev. Mol. Cell Biol., 2005, 6, 363–375 CrossRef PubMed.
- J. M. Levsky and R. H. Singer, J. Cell Sci., 2003, 116, 2833–2838 CrossRef PubMed.
- H. M. T. Choi, V. A. Beck and N. A. Pierce, ACS Nano, 2014, 8, 4284–4294 CrossRef PubMed.
- R. Lin, Q. Feng, P. Li, P. Zhou, R. Wang, Z. Liu, Z. Wang, X. Qi, N. Tang, F. Shao and M. Luo, Nat. Methods, 2018, 15, 275–278 CrossRef PubMed.
- C. Wu, S. Cansiz and W. Tan, J. Am. Chem. Soc., 2015, 137, 4900–4903 CrossRef PubMed.
- J. N. Zadeh, C. D. Steenberg, J. S. Bois, B. R. Wolfe, M. B. Pierce, A. R. Khan, R. M. Dirks and N. A. Pierce, J. Comput. Chem., 2011, 32, 170–173 CrossRef PubMed.
- A. Lujambio and S. W. Lowe, Nature, 2012, 482, 347–355 CrossRef PubMed.
- M. V. Iorio, M. Ferracin, C. Liu, A. Veronese, R. Spizzo, S. Sabbioni, E. Magri, M. Pedriali, M. Fabbri, M. Campiglio, S. Ménard, J. P. Palazzo, A. Rosenberg, P. Musiani, S. Volinia, I. Nenci, G. A. Calin, P. Querzoli, M. Negrini and C. M. Croce, Cancer Res., 2005, 65, 7065–7070 CrossRef PubMed.
Footnote |
| † Electronic supplementary information (ESI) available: DNA sequences, CHA and HCR systems, control experiments, Z-stack projections of MCF-7 cells, and FRET efficiency of intracellular imaging of miR-21. See DOI: 10.1039/c8sc01981a |
| This journal is © The Royal Society of Chemistry 2018 |

