 Open Access Article
Electric-field induced bistability in single-molecule conductance measurements for boron coordinated curcuminoid compounds†
Ignacio José
Olavarría-Contreras‡
a,
Alvaro
Etcheverry-Berríos‡
 b,
Wenjie
Qian
 c,
Cristian
Gutiérrez-Cerón
d,
Aldo
Campos-Olguín
 b,
E. Carolina
Sañudo
 ef,
Diana
Dulić
 d,
Eliseo
Ruiz
 eg,
Núria
Aliaga-Alcalde
 *ch,
Monica
Soler
 *b and
Herre S. J.
van der Zant
 *a
*a
aKavli Institute of Nanoscience, Delft University of Technology, Lorentzweg 1, Delft 2628 CJ, The Netherlands. E-mail: h.s.j.vanderzant@tudelft.nl
bDepartamento de Ingeniería Química, Biotecnología y Materiales, Facultad de Ciencias Físicas y Matemáticas, Universidad de Chile, Beauchef 851, Santiago, Chile. E-mail: msoler@ing.uchile.cl
cICMAB-CSIC (Institut de Ciència dels Materials de Barcelona), Campus de la Universitat Autònoma de Barcelona, 08193 Bellaterra, Spain. E-mail: naliaga@icmab.es
dDepartamento de Física, Facultad de Ciencias Físicas y Matemáticas, Universidad de Chile, Av. Blanco Encalada 2008, Santiago, Chile
eDepartament de Química Inorgànica i Orgànica, Universitat de Barcelona, Diagonal 645, 08028, Barcelona, Spain
fInstitut de Nanociència i Nanotecnologia, Universitat de Barcelona, Diagonal 645, 08028, Barcelona, Spain
gInstitut de Química Teòrica i Computacional, Universitat de Barcelona, Diagonal 645, E-08028 Barcelona, Spain
hICREA (Institució Catalana de Recerca i Estudis Avançats), Passeig Lluís Companys, 23, 08018 Barcelona, Spain
First published on 24th July 2018
Abstract
We have studied the single-molecule conductance of a family of curcuminoid molecules (CCMs) using the mechanically controlled break junction (MCBJ) technique. The CCMs under study contain methylthio (MeS–) as anchoring groups: MeS-CCM (1), the free-ligand organic molecule, and two coordination compounds, MeS-CCM-BF2 (2) and MeS-CCM-Cu (3), where ligand 1 coordinates to a boron center (BF2 group) and to a CuII moiety, respectively. We found that the three molecules present stable molecular junctions allowing detailed statistical analysis of their electronic properties. Compound 3 shows a slight increase in the conductance with respect to free ligand 1, whereas incorporation of BF2 (compound 2) promotes the presence of two conductance states in the measurements. Additional experiments with control molecules point out that this bistability is related to the combination of MeS– anchoring groups and the BF2 moiety within the structure of the molecules. Theoretical calculations show that this can be explained by the presence of two conformers once compound 2 is anchored between the gold electrodes. An energy minimum is found for a flat structure but there is a dramatic change in the magnitude and orientation of dipole moment (favouring a non-flat conformer in the presence of an external electric field) due to a conformational change of one of the terminal MeS– groups. The results thus point to an intricate interplay between the applied bias voltage and the molecule dipole moment which could be the basis for designing new molecules aiming at controlling their conformation in devices.
Introduction
Over the past few decades, the field of single-molecule electronics has evidenced tremendous experimental and theoretical advances. It is accepted that experimental techniques that provide reliable charge transport measurements, on a single-molecule level, are based on various types of break junctions.1–4 Their strength lies in providing measurement protocols5–9 based on extensive data analysis5 and they allow the study of structure–conductivity relationships in a large variety of molecular systems with different functionalities,5–9 which include rectifiers, diodes, switches and transistors, and functionalities based on physical phenomena with no classical analogue, such as quantum interference effects.10–12The essential molecular units governing charge transport on a single-molecule level are the anchoring groups of the molecule under study, the properties of the molecular backbone and the electrodes; their variation can affect the charge transport properties of the junction. For instance, the inclusion of metal or metalloid ions in organic backbones or the presence of molecular dipole moments may influence the electronic properties. Both aspects are highly relevant in coordination compounds with biocompatibility, since they may play an important role in protein charge transport processes.13 Although the influence of anchoring groups and electrodes on molecular conductance has been extensively studied in the past,1,14–16 the influence on the conductance when incorporating a metal ion is less clear; in some cases, the presence of the metal ion can be seen as an effective gate but it is not a priori known if incorporation would lead to a conductance increase or decrease. Experiments by Liu et al.17 using metallo-porphyrins show a downshift in the conductance values when a metal atom is included in the structure; however, in other studies, coordination to a metal has been shown to improve electron transport.18 Similarly, the role of the molecular dipole moments in single-molecule transport has also not been studied in great detail; it has only been reported in a few cases.19
Here, we present experimental and theoretical studies on the single-molecule conductance behaviour of a family of curcuminoid molecules (CCMs, Fig. 1) using the mechanically controllable break junction (MCBJ) technique. Synthetic CCMs mimic the structure of the natural compound curcumin, found in the ribosomes of the Curcuma longa plant.20 These bio-inspired molecules are diarylheptanoid systems with a skeleton that has a central β-diketone group able to coordinate metal ions and metalloids,21,22 and two terminal aromatic groups functioning as anchoring groups. We report on charge transport in three methylthio (MeS–) terminated CCM compounds, namely the free-ligand (1, MeS-CCM) and two coordination compounds (2, MeS-CCM-BF2, and 3, MeS-CCM-Cu) achieved by the reaction of the free ligand (1) with boron and copper sources, in that order (Fig. 1). MeS– anchoring groups were chosen due to their well-established affinity toward Au substrates and electrodes.23 The Cu(II) ion in compound 3 may in addition exhibit interesting spin properties as reported in measurements of a related compound with Co ions;24 such studies, however, require low-temperature characterization which is not the main focus of this paper.
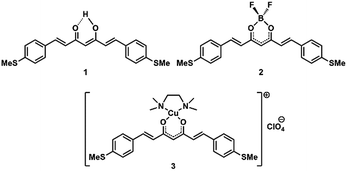 | ||
| Fig. 1 Schematic representation of the free and coordinated curcuminoid molecules (CCMs, 1–3): MeS-CCM (1), MeS-CCM-BF2 (2) and MeS-CCM-Cu (3). | ||
For all three molecules clear conductance signatures are observed and interestingly, compound 2 shows a pronounced conductance bistability. To gain insight into the nature of the findings we performed additional conductance measurements on related compounds (Fig. 2) and employed two different theoretical approaches based on DFT and post-Hartree–Fock methods to analyse conformations of the compounds. It is shown that for molecules with a MeS– anchor and BF2 substitution, the electric field favours a conformation with a large dipole moment directed almost along the gradient of the electric field.
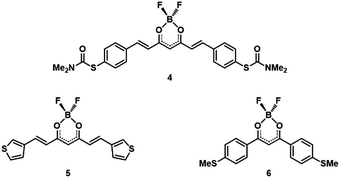 | ||
| Fig. 2 Schematic representation of the BF2 coordinated molecules: S-CCM-BF2 (4), Thph-CCM-BF2 (5), and MeS-dbm-BF2 (6). | ||
Results and discussion
Synthetic procedures
The synthetic path used to obtain CCM 1 is based on a methodology reported initially by Pabon,25 based on single-pot reactions with straightforward purification processes, affording the desired systems in the scale of grams. Such versatile chemistry allows the insertion of a variety of aromatic units on both sides of the molecule to function as anchoring groups, making CCMs attractive compounds for use as molecular components in nanodevices.26Regarding the β-diketone group, at the centre of the CCM structure, we have demonstrated its coordination with 3d and 4f metal centers,27,28 including some CCM-CuII compounds.29 On the other hand, the affinity of curcumin for boron is well known to provide coloured materials such as rosocyanine, used for detection of trace amounts of boron in various media.30 CCMs require CCM-boron intermediates toward their synthesis25 and there are examples in the literature, such as the CRANAD derivatives, that are used as sensors in the near-IR area, mainly for Alzheimer's disease studies.31
The two coordination compounds (MeS-CCM-BF2 (2) and MeS-CCM-Cu (3), Fig. 1) were synthesized by the reaction of free ligand 1 with BF3·Et2O and [CuOH(TMEDA)]2(ClO4)2, respectively (see the ESI†). The complete characterization of 1–3 is described in the ESI,† including their crystallographic data (Fig. S1–S7, S20–S22, S45, S48, and S49 and Tables S1–S6†). As part of the basic characterization of these molecules, we determined the HOMO–LUMO energy gaps using UV-Vis absorption spectroscopy in the solid state and electrochemical studies (cyclic voltammetry (CV) and differential pulse voltammetry (DPV)) (Fig. S28–S30, S36–S38 and S44†).32
To support our experimental and theoretical findings, we synthesized additional molecules for control experiments. The additional BF2-coordinated compounds are shown in Fig. 2. They include (i) a family of CCMs with different anchoring groups, namely S-thiocarbamate (depicted as S-CCM-BF2 (4) because the end group leaves once the molecule comes into contact with the gold electrodes) and thiophene (Thph-CCM-BF2 (5)), and (ii) a family of shorter molecules, acac derivatives (dibenzoylmethane systems, dbm), with the same MeS– anchoring group (MeS-dbm-BF2 (6)).33 The additional BF2-coordinated compounds are shown in Fig. 2. The synthesis and characterization of 4–6 together with their corresponding free ligands, 4a and 6a, are given in the ESI (Fig. S8–S19, S23–S27, S31–S35, S39–S44 and S46–S48†). Overall, coordination through the β-diketone group induces bathochromic shifts in the UV-Vis absorption in the solid state and shorter HOMO–LUMO gaps with respect to the free ligands (Fig. S44†).
Conductance measurements
Single-molecule conductance measurements were performed in a mechanically controllable break junction (MCBJ) setup under ambient conditions, explained in more detail in the ESI.†34 Before depositing the molecule of interest, a control experiment is performed: one of the four junctions on a chip is broken and at least a thousand conductance vs. displacement traces are measured (ESI Fig. S50†). A solution (>50 μM) of target molecules dissolved in CH2Cl2 is drop-cast onto the device (∼2 μL) only if clear tunnelling traces, without signs of contamination, are observed. The data are represented in one- and two-dimensional conductance vs. electrode displacement histograms such as the ones displayed in Fig. 3. The colour code in the panels on the left-hand side (2D histograms) represents how often a particular value of conductance occurs at a particular value of electrode distance.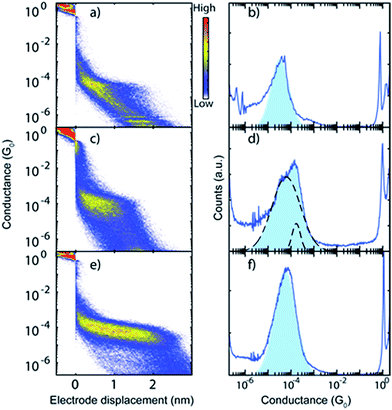 | ||
| Fig. 3 (a, c and e) Two-dimensional conductance vs. displacement histograms constructed from 2000 consecutive traces of representative samples of (a) MeS-CCM (1), (c) MeS-CCM-BF2 (2) and (e) MeS-CCM-Cu (3). Experimental conditions: bias voltage of 0.1 V under ambient conditions; electrode separation speed between 3 and 8 nm s−1. (b, d and f) One-dimensional histograms of selected traces (see the ESI†) of 1–3. The conductance axis is logarithmically binned with 80 bins per decade. | ||
To quantify the most probable conductance value of each molecule, we selected the traces that show molecular features (method detailed in the ESI†) and constructed one-dimensional conductance histograms, presented in Fig. 3, right panels. The most probable conductance value of each molecule is obtained by fitting a log-normal distribution to the selected conductance histograms. The conductance values and the full width at half maximum (FWHM) of these fits are averaged among the different samples. The obtained values are presented in Table 1. Note that Cu complex 3 possesses a particularly high molecular junction formation yield, which may be connected to the fact that the backbone of this molecule is charged.
| Molecule | G (G0) | Std (G0) | FWHM |
|---|---|---|---|
| a The considered datasets were measured at a bias voltage of 0.1 V and an electrode speed between 3 and 8 nm s−1. The standard deviations were calculated using the data of two devices for 1, six devices for 2, and two devices for 3. | |||
| MeS-CCM (1) | 3.9 × 10⁻⁵ | 4.0 × 10⁻⁶ | 1.0 |
| MeS-CCM-BF2 (2) | 1.4 × 10⁻⁴ | 2.2 × 10⁻⁵ | 1.1 |
| 5.4 × 10⁻⁵ | 1.6 × 10⁻⁵ | 0.5 | |
| MeS-CCM-Cu (3) | 6.2 × 10⁻⁵ | 1.0 × 10⁻⁵ | 1.1 |
As seen in Fig. 3 and Table 1, molecules 1 and 3 have a single conductance peak situated at 3.9 × 10⁻⁵G0 and 6.2 × 10⁻⁵G0, respectively, where G0 is the conductance quantum (2e2/h = 77 μS). In contrast, molecule 2 represents a double-peak structure, a lower one similar to the ones of molecules 1 and 3 at 5.4 × 10⁻⁵G0 and a higher one at 1.4 × 10⁻⁴G0.
We studied the double-peak structure of 2 in more detail. Fig. 4a depicts the 1D conductance histograms of five different samples using a bias voltage of 0.2 V, a voltage at which the double-peak structure is clearly seen in most of the cases. Fig. 4b displays an example of the evolution of the peak structure as the bias voltage increases from 0.05 to 0.3 V. Interestingly, the statistical weight of the high conductance peak increases as the bias voltage increases. This observation hints towards a relation between the dipolar nature of the molecule (see below) and its electronic properties. We note that this systematic trend with bias voltage was not observed for 1 and 3 (see ESI Fig. S51†).
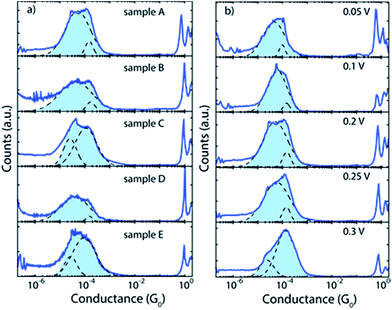 | ||
| Fig. 4 (a) One-dimensional histograms of selected traces of five different samples of 2 measured using a bias voltage of 0.2 V. (b) Series of measurements on a single junction (sample A) with the bias voltages indicated by the labels. Two thousand consecutive breaking traces were recorded for each bias voltage measurement. The histograms are built from selected traces incorporating 9.8% (0.05 V), 13.1% (0.1 V), 23.3% (0.2 V), 25.6% (0.25 V) and 57.3% (0.3 V) of the traces. Light-blue shaded areas represent fits of two-log-normal distributions to the data. Black dashed lines depict the individual log-normal distributions. The values of the fits are used to obtain the numbers shown in Table 1. | ||
It is important to stress that the ratio between the conductance values of the two peaks varies from sample to sample and is not exactly two as expected if two molecules were to be trapped at the same time.35–37 In addition, previously reported bistability features due to different anchoring groups or rectification38–42 can be disregarded; as for the former one, one would expect plateaus of different lengths (which is not observed) and with respect to the latter one that the molecule should present a clear asymmetric structure (which is not the case).
Further examination of the individual conductance traces of 2 (Fig. 5) reveals that, within a single trace, the conductance switches back and forth between two values that are consistent with the two conductance values obtained from the fitting procedure. We also measured conductance traces at other electrode speeds and bias voltages. Note that the stability of the MCBJ technique allows for long junction life up to hundreds of seconds. We found that the switching behaviour within the same breaking trace is a common feature of 2, not present in traces of the other compounds (1 and 3). The switching time shows a large variation: for some traces no switch is observed for time intervals as long as 10 s, while in other traces abrupt switches occur on time scales as fast as the millisecond scale. Furthermore, the switching time did not show a clear dependence on bias voltage. From these observations, we conclude that the junction configuration most likely plays an important role in the switching event appearance.
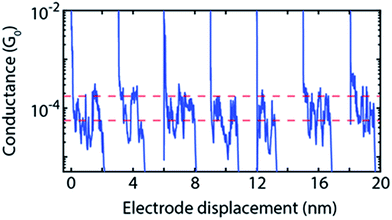 | ||
| Fig. 5 Examples of individual breaking traces of 2 in which switching events are observed; traces are measured at 0.1 V and at an electrode speed of 4 nm s−1. Traces switch up and down regardless of the distance. The average high and low conductance values of 2 from Table 1 are highlighted by the two red dashed lines. Traces have been offset in the x-direction for clarity. | ||
To get a better understanding of the double peak structure of 2, we performed similar conductance studies with molecules 4–6 (Fig. 2) consisting of additional BF2 compounds with different anchoring groups to identify the molecular elements responsible for the bistable response. The two-dimensional conductance vs. displacement histograms and one dimensional-conductance histograms of these reference molecules with their fitting procedures and detailed discussion are presented in Fig. S51 and S52.†
Importantly, only compound 6 reproduced the bistable electronic behaviour similar to 2 (Fig. S54†); this dibenzoylmethane derivative also presents the BF2 and MeS– moieties but with a shorter skeleton than compound 2. On the other hand, conductance measurements of CCM-BF2 compounds 4 and 5 (both anchored through S atoms as well, Fig. 2) display single conductance peaks in the histograms (Table 2). Therefore, the bistable conductance switching in 2 and 6 seems to be associated with the combination of the coordination to the BF2 group and the presence of MeS– anchoring groups in the CCM.
| Molecule | G (G0) | Std (G0) | FWHM (dec) |
|---|---|---|---|
| a The considered datasets were measured at a bias voltage of 0.1 V and an electrode speed between 3 and 8 nm s−1. The standard deviations were calculated using the data of two devices for 4, one device for 5 and two devices for 6, respectively. | |||
| S-CCM-BF2 (4) | 4.3 × 10⁻⁴ | 1.1 × 10⁻⁴ | 0.9 |
| Thph-CCM-BF2 (5) | 4.3 × 10⁻⁴ | — | 0.6 |
| MeS-dbm-BF2 (6) | 4.7 × 10⁻⁴ | 6.4 × 10⁻⁵ | 0.6 |
| 8.8 × 10⁻⁵ | 3.1 × 10⁻⁵ | 1.4 | |
Theoretical studies
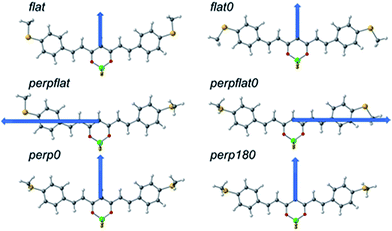
To gain more insight into the transport features of compound 2, Density Functional Theory (DFT) and post-Hartree–Fock calculations in different scenarios were performed, supplemented by calculations on compounds 1 and 3, considering the molecules alone and the situation in which they are connected to gold (see Computational details in ESI† Section 1 and additional theoretical results in Section 10).Compound 2, like the rest of the CCMs, is essentially planar but presents certain flexibility, as can be seen in its reported structure (Cambridge Structural Database refcode RUXFIB)43 and the structures of 1 and 3, respectively (ESI†). Different conformers can thus be proposed (Fig. 6). In this regard, the relative stability of MeS-CCM (1), MeS-CCM-BF2 (2) and MeS-CCM-Cu (3) has been analysed by using B3LYP-D3 and MP2 geometry optimizations. Single-point energy calculations were performed by employing DLPNO-CCSD(T) using the optimized structures from B3LYP and MP2 (see the Computational details section†). Fig. 6 shows the conformers and proposed names for 2, which can be extrapolated for 1 and 3; the final results are included in Table S7.†
The conformers differ in the relative orientation of the two terminal MeS– groups, being either in the plane of the molecule (flat) or perpendicular to that plane (perp). Fig. 6 displays the dipole moment of each conformer. We noticed that in most of the CCMs the dipole moment is oriented in the plane of the molecule (symmetric endings) perpendicular to its long axis. When both MeS– groups are in different orientations (perpflat or perpflat0 conformers) the dipole moment is oriented more towards the long axis of the molecule, showing a larger value, a factor of around 3–4, in comparison with the other conformers.
A rather large discrepancy between the B3LYP+D3 method and MP2 is observed when looking for the stability of the different conformers for the three molecules (1, 2 or 3). In the case of MeS-CCM-BF2 (2) and using the B3LYP+D3 method, flat and flat0 conformers appear as minima but the most stable conformer is the perpflat one, where one MeS– group is in the plane of the molecule and the other perpendicular to it. However, for 1 and 3, the results using this DFT method indicate the flat0 conformer as the most stable, where both MeS– moieties are in the plane of the molecule. From an experimental point of view, the crystal structure of 2, as is also the case for 1 and 3, shows a distorted flat0 conformer that differs from theory, although here packing effects may be of importance. At the same time, calculations at the MP2 level do not agree with these DFT results, since the MP2 methods favour the stability of perpendicular conformers (see Table S7†). Fig. S55† shows the main differences among the optimized structures for 2 with the two methods and the available experimental structures. The molecules optimized by the B3LYP+D3 method show a molecular framework that is almost perfectly flat while at the MP2 level the molecule loses its planarity to avoid repulsions among the hydrogen atoms.
High-level DLNPO-CCSD(T) calculations, using B3LYP-D3 and MP2 optimized geometries, were performed in an attempt to clarify the discrepancies between the two methods. Overall, two main conclusions were obtained: (i) the calculations did not fully agree with B3LYP-D3 or with MP2, presenting large differences among the relative stabilization energies (Table S7†) and (ii) considering the whole set of optimized geometries for compounds 1, 2 and 3, the flat0 conformer optimized at the B3LYP-D3 level is the most stable one at the DLNPO-CCSD(T) level, a fact that agrees with the available experimental X-ray data for compound 2.
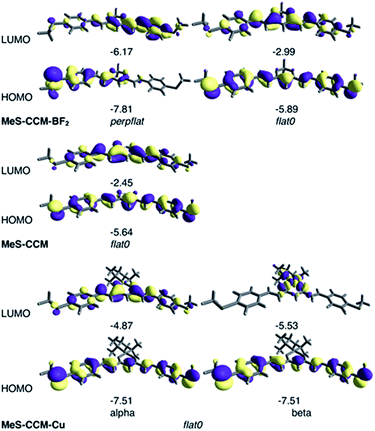
The molecular orbitals calculated with B3LYP-D3 for the most stable conformers of the three molecules are represented in Fig. 7. It is worth noting that the open shell electronic structure of MeS-CCM-Cu (3) is clearly manifested in the different natures of the alpha and beta frontier orbitals with the empty beta CuII dx2−y2 orbital as the beta LUMO of such a system. More importantly, rotation of one terminal methyl group in the perpflat conformer of compound 2 results in a large localization of the orbitals on one side of the molecule. Hence, the rotated methyl, despite the fact that it is not present in the conduction pathway of the molecule, can have important consequences on it.
We also analysed the stability of the conformers under an electric field, to mimic the effect in the molecules when they are connected between two Au electrodes at non-zero bias. The study was performed with systems 1 and 2 using B3LYP and MP2 calculations, in a similar manner as before (this approach is not available with coupled-cluster calculations and therefore calculation of 3 was omitted). We assumed that once a MeS-CCM-X molecule (X = H in 1 or BF2 in 2) is attached to the electrodes, it is aligned in the S…S direction with the electric field generated by the electrodes. As most of the conformers have a relatively large dipole moment perpendicular to the molecule (Fig. 6), it is expected that the influence of the electric field of these molecules may play a role in their electron transport properties.
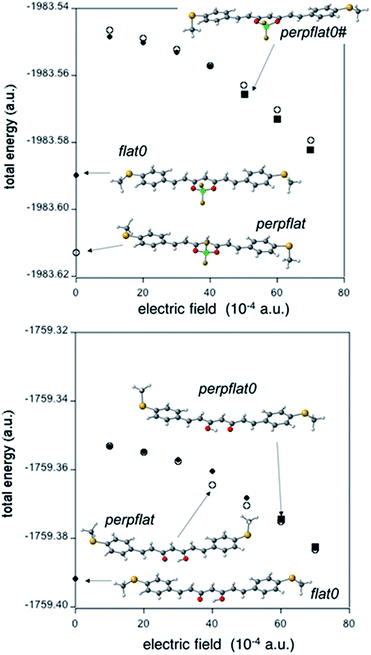
Fig. 8 shows the total energy corresponding to the optimal geometries for 1 and 2 under an electric field of the order of magnitude expected in the MCBJ experiment. To quantify the magnitude of an electric field, we consider the bias employed in our MCBJ experiments (0.05 V) and an approximate distance between the electrodes; for instance, 1 nm will result in an electric field of 5 × 10⁶ V cm−1 (around 10−3 a.u.) in the S…S direction. At the DFT level, for all calculated external electric fields, the perpflat conformers (Fig. 8, white symbols), which have their dipole moments closely aligned to the external field (Fig. 6), retain their conformational structures (for 1 and 2).
Under external electric fields higher than 40 × 10−4 a.u., the flat0 conformer in the case of 2 (Fig. 8 top, black symbols) adopts a different structure with a large dipole moment (22.9 D, while it is only 5.1 D for flat0) in a better alignment with respect to the external electric field (Fig. S56†). The new conformer for 2 is different from the rest of the conformers described until now (see Fig. 6, it is not a minimum for the isolated molecule); it is closely related to the perpflat0 conformer (see Fig. 8 top) but now with the perpendicular MeS– group in the same direction as the out-of-plane B–F bond (hereafter called perpflat0# conformer, black squares, Fig. 8 top). Our calculations show that the dipole moment is slightly better aligned in the perpflat0# case than in the perpflat0 conformer, justifying its large stability under strong external electric fields (Fig. S56†). For free ligand 1, we need to apply a higher field, almost 60 × 10−4 a.u., to transform the flat0 conformer into the perpflat0 conformer (black squares in Fig. 8 bottom).
Thus, the DFT approach studies show a strong tendency for 2 to change its conformation from planar to perpendicular due to the effect of electric fields that may also be favoured by the interaction of 2 with the gold electrodes (see Fig. S57 and Table S8†). Results equivalent to those in Fig. 8 at the MP2 level are presented in Fig. S58.†
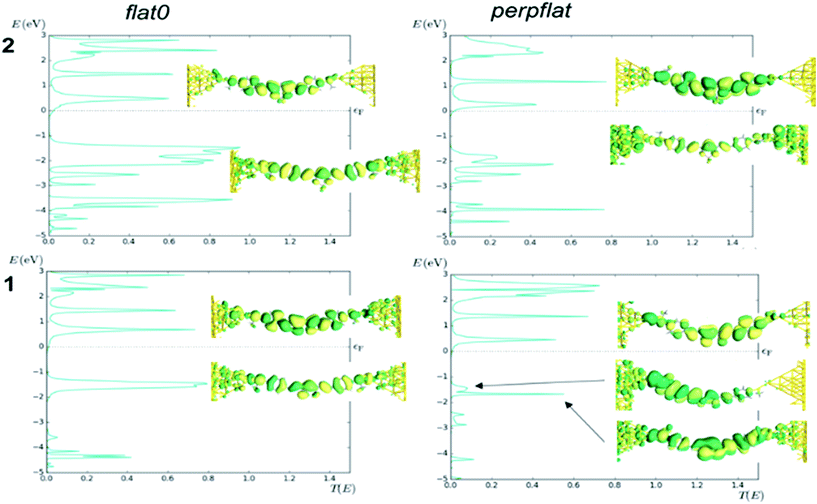
Finally, we calculated the transport properties of the flat0 and perpflat conformers of 1 and 2 using non-equilibrium Green functions (NEGF) combined with DFT (see the Computational details section†). The analysis of the transmission curves (Fig. 9, see Fig. S59† for transmission curves of 3) indicates that the LUMO level of 2 shows peaks at lower energies, with a larger contribution of the tail at the Fermi level of the gold than in the case of 1, resulting in a higher conductance value (Table S9†). It is worth noting the decrease of the HOMO–LUMO gap of 2 and 3 in comparison with 1, which is in agreement with the lowest conductance value of 1 found in the experiment. In addition, the calculation for diradical S-CCM-BF2 (4) shows a higher value than that calculated for 2 and 3, one order of magnitude larger, matching well the trend in experimental data (see the transmission curve, Fig. S60†), albeit with a completely different distribution of the peaks in the transmission curve.
To conclude this theoretical section, the calculations follow the trends in the experiments regarding the conductance values and furthermore indicate that MeS-CCM-BF2 (2) has a greater tendency to exhibit conformational changes, showing planar and perpendicular conformers that could explain the presence of two peaks with different conductance values in the MCBJ experiments.
Conclusions
We have studied the molecular conductance behaviour of a family of curcuminoid molecules (MeS-CCM (1), MeS-CCM-BF2 (2), and MeS-CCM-Cu (3)) by comparing the electronic properties of the free ligand (1) with those of the coordination compounds that contain a metalloid ion (2) and a 3d metal centre (3). Coordination of a CuII ion in 3 leads to a slight increase in the conductance with respect to free ligand 1, whereas incorporation of the BF2 group promotes bistability in the conductance measurements. The studies also indicate that within a single conductance vs. displacement trace, the conductance can switch back and forth between the two observed values. Experiments on additional CCM-BF2 compounds (S-CCM-BF2 (4) and Thph-CCM-BF2 (5)) and a dbm derivative (MeS-dbm-BF2 (6)) point out that the bistability is related to the combination of MeS– and BF2 moieties incorporated in the backbone of the molecules. Theoretical calculations show that 2 presents this bistable electron transport feature due to conformational changes between flat and non-flat molecular structures. The large difference in the dipole moment between these conformers can modify its relative stability when an external electric field is applied in the MCBJ experiments. This electrically induced bistability may thus provide a new pathway to design molecular switches based on the interaction between molecular dipole moments and external applied electric fields.Conflicts of interest
There are no conflicts to declare.Acknowledgements
MS and DD acknowledge support through FONDECYT grants numbers 1161775 and 1181080, respectively. NAA thanks MEC for grant MAT2016-77852-C2-1-R, and the ‘‘Severo Ochoa’’ Program for Centers of Excellence in R&D (SEV-2015-0496). ER acknowledges MEC for grant CTQ2015-64579-C3-1-P (MINECO/FEDER, UE), the computer resources, technical expertise and assistance provided by the Barcelona Supercomputing Centre and CSUC and the Generalitat de Catalunya for an ICREA Academia award and grant 2017SGR1289. NAA and WQ thank the Generalitat de Catalunya (FI-DGR 2014). AEB, MS and NAA thank the CSIC (project iCOOP20162). AEB acknowledges Conicyt PFCHA 21140734 for a PhD scholarship. Financial support was also received from the EU through a RISE project (DAFNEOX SEP-210165479; DD and HvdZ) and the Dutch funding agency NWO (IOC, HvdZ). Concerning the conductance measurements, we thank M. L. Perrin for his help. ECS acknowledges financial support from the Spanish Government Ministerio de Economía y Competitividad via FEDER funding (CTQ2015-68370-P) and the Catalan Government agency AGAUR (project SGR-2014-129). CGC acknowledges Conicyt/Fondecyt Postdoctoral Project 3150674.References
- R. Frisenda, S. Tarkuç, E. Galán, M. L. Perrin, R. Eelkema, F. C. Grozema and H. S. J. van der Zant, Beilstein J. Nanotechnol., 2015, 6, 1558 CrossRef PubMed.
- M. T. González, S. Wu, R. Huber, S. J. van der Molen, C. Schönenberger and M. Calame, Nano Lett., 2006, 6, 2238 CrossRef PubMed.
- M. Kamenetska, M. Koentopp, A. C. Whalley, Y. S. Park, M. L. Steigerwald, C. Nuckolls, M. S. Hybertsen and L. Venkataraman, Phys. Rev. Lett., 2009, 102, 126803 CrossRef PubMed.
- A. Mishchenko, D. Vonlanthen, V. Meded, M. Bürkle, C. Li, I. V. Pobelov, A. Bagrets, J. K. Viljas, F. Pauly, F. Evers, M. Mayor and T. Wandlowski, Nano Lett., 2010, 10, 156 CrossRef PubMed.
- R. Frisenda, M. L. Perrin, H. Valkenier, J. C. Hummelen and H. S. J. van der Zant, Phys. Status Solidi B, 2013, 250, 2431 CrossRef.
- M. L. Perrin, E. Galan, R. Eelkema, F. Grozema, J. M. Thijssen and H. S. J. van der Zant, J. Phys. Chem. C, 2015, 119, 5697 CrossRef.
- M. A. Ratner, Nat. Nanotechnol., 2013, 8, 378 CrossRef PubMed.
- M. Tsutsui and M. Taniguchi, Sensors, 2012, 12, 7259 CrossRef PubMed.
- L. Wang, L. Wang, L. Zhang and D. Xiang, Top. Curr. Chem., 2017, 375, 61 CrossRef PubMed.
- N. Darwish, I. Díez-Pérez, P. Da Silva, N. Tao, J. J. Gooding and M. N. Paddon-Row, Angew. Chem., Int. Ed., 2012, 51, 3203 CrossRef PubMed.
- C. M. Guédon, H. Valkenier, T. Markussen, K. S. Thygesen, J. C. Hummelen and S. J. van der Molen, Nat. Nanotechnol., 2012, 7, 305 CrossRef PubMed.
- D. Z. Manrique, C. Huang, M. Baghernejad, X. Zhao, O. A. Al-Owaedi, H. Sadeghi, V. Kaliginedi, W. Hong, M. Gulcur, T. Wandlowski, M. R. Bryce and C. J. Lambert, Nat. Commun., 2015, 6, 6839 CrossRef PubMed.
- N. Amdursky, D. Marchak, L. Sepunaru, I. Pecht, M. Sheves and D. Cahen, Adv. Mater., 2014, 26, 7142 CrossRef PubMed.
- I. S. Kristensen, D. J. Mowbray, K. S. Thygesen and K. W. Jacobsen, J. Phys.: Condens. Matter, 2008, 20, 374101 CrossRef PubMed.
- F. Chen, X. Li, J. Hihath, Z. Huang and N. Tao, J. Am. Chem. Soc., 2006, 128, 15874 CrossRef PubMed.
- L. A. Zotti, T. Kirchner, J.-C. Cuevas, F. Pauly, T. Huhn, E. Scheer and A. Erbe, Small, 2010, 6, 1529 CrossRef PubMed.
- Z.-F. Liu, S. Wei, H. Yoon, O. Adak, I. Ponce, Y. Jiang, W.-D. Jang, L. M. Campos, L. Venkataraman and J. B. Neaton, Nano Lett., 2014, 14, 5365 CrossRef PubMed.
- J. Ponce, C. R. Arroyo, S. Tatay, R. Frisenda, P. Gaviña, D. Aravena, E. Ruiz, H. S. J. van der Zant and E. Coronado, J. Am. Chem. Soc., 2014, 136, 8314 CrossRef PubMed.
- G. D. Harzmann, R. Frisenda, H. S. J. van der Zant and M. Mayor, Angew. Chem., Int. Ed., 2015, 54, 13425 CrossRef PubMed.
- R. Sharma, A. Gescher and W. Steward, Eur. J. Cancer, 2005, 41, 1955 CrossRef PubMed.
- S. Wanninger, V. Lorenz, A. Subhan and F. T. Edelmann, Chem. Soc. Rev., 2015, 44, 4986 RSC.
- Z. Sui, R. Salto, J. Li, C. Craik and P. R. O. de Montellano, Bioorg. Med. Chem., 1993, 1, 415 CrossRef PubMed.
- H. Vazquez, R. Skouta, S. Schneebeli, M. Kamenetska, R. Breslow, L. Venkataraman and M. Hybertsen, Nat. Nanotechnol., 2012, 7, 663 CrossRef PubMed.
- S. Wagner, F. Kisslinger, S. Ballmann, F. Schramm, R. Chandrasekar, T. Bodenstein, O. Fuhr, D. Secker, K. Fink, M. Ruben and H. B. Weber, Nat. Nanotechnol., 2013, 8, 575 CrossRef PubMed.
- H. Pabon, Recl. Trav. Chim. Pays-Bas, 1964, 83, 379 CrossRef.
- E. Burzurí, J. O. Island, R. Díaz-Torres, A. Fursina, A. González-Campo, O. Roubeau, S. J. Teat, N. Aliaga-Alcalde, E. Ruiz and H. S. J. van der Zant, ACS Nano, 2016, 10, 2521 CrossRef PubMed.
- M. Menelaou, F. Ouharrou, L. Rodríguez, O. Roubeau, S. J. Teat and N. Aliaga-Alcalde, Chem.–Eur. J., 2012, 18, 11545 CrossRef PubMed.
- R. Díaz-Torres, M. Menelaou, O. Roubeau, A. Sorrenti, G. Brandariz-de-Pedro, E. C. Sañudo, S. J. Teat, J. Fraxedas, E. Ruiz and N. Aliaga-Alcalde, Chem. Sci., 2016, 7, 2793–2803 RSC.
- N. Aliaga-Alcalde, P. Marqués-Gallego, M. Kraaijkamp, C. Herranz-Lancho, H. den Dulk, H. Görner, O. Roubeau, S. J. Teat, T. Weyhermüller and J. Reedijk, Inorg. Chem., 2010, 49, 9655 CrossRef PubMed.
- R. Sah and P. Brown, Microchem. J., 1997, 56, 285 CrossRef.
- E. Kim, A. Felouat, E. Zaborova, J.-C. Ribierre, J. W. Wu, S. Senatore, C. Matthews, P.-F. Lenne, C. Baffert and A. Karapetyan, Org. Biomol. Chem., 2016, 14, 1311 RSC.
- A. Etcheverry-Berríos, I. Olavarría, M. L. Perrin, R. Díaz-Torres, D. Jullian, I. Ponce, J. H. Zagal, J. Pavez, S. O. Vásquez and H. S. J. van der Zant, Chem.–Eur. J., 2016, 22, 12808 CrossRef PubMed.
- T. Lu, Y.-T. Jiang, F.-P. Ma, Z.-J. Tang, L. Kuang, Y.-X. Wang and B. Wang, Org. Lett., 2017, 19, 6344 CrossRef PubMed.
- A. M. Christian, M. v. R. Jan and H. S. J. van der Zant, Nanotechnology, 2010, 21, 265201 CrossRef PubMed.
- B. Xu and N. J. Tao, Science, 2003, 301, 1221 CrossRef PubMed.
- Y. Zang, A. Pinkard, Z.-F. Liu, J. B. Neaton, M. L. Steigerwald, X. Roy and L. Venkataraman, J. Am. Chem. Soc., 2017, 139, 14845 CrossRef PubMed.
- B. Capozzi, J. Z. Low, J. Xia, Z.-F. Liu, J. B. Neaton, L. M. Campos and L. Venkataraman, Nano Lett., 2016, 16, 3949 CrossRef PubMed.
- I. Díez-Pérez, J. Hihath, Y. Lee, L. Yu, L. Adamska, M. A. Kozhushner, I. I. Oleynik and N. Tao, Nat. Chem., 2009, 1, 635 CrossRef PubMed.
- S. Y. Quek, M. Kamenetska, M. L. Steigerwald, H. J. Choi, S. G. Louie, M. S. Hybertsen, J. Neaton and L. Venkataraman, Nat. Nanotechnol., 2009, 4, 230 CrossRef PubMed.
- E. Lortscher, B. Gotsmann, Y. Lee, L. P. Yu, C. Rettner and H. Riel, ACS Nano, 2012, 6, 4931 CrossRef PubMed.
- T. A. Su, H. Li, M. L. Steigerwald, L. Venkataraman and C. Nuckolls, Nat. Chem., 2015, 7, 215 CrossRef PubMed.
- T. A. Su, H. Li, V. Zhang, M. Neupane, A. Batra, R. S. Klausen, B. Kumar, M. L. Steigerwald, L. Venkataraman and C. Nuckolls, J. Am. Chem. Soc., 2015, 137, 12400 CrossRef PubMed.
- D. Anthony, E. Zaborova, F. Frederic and G. Michel, CSD communication (private communication) 2015.
Footnotes |
| † Electronic supplementary information (ESI) available: Synthetic details and spectra of all synthesized compounds. X-ray crystal data for 1 and 3. Details and further discussion of MCBJ measurements and computational details. CCDC 1833305 and 1840934. For ESI and crystallographic data in CIF or other electronic format see DOI: 10.1039/c8sc02337a |
| ‡ These authors contributed equally. |
| This journal is © The Royal Society of Chemistry 2018 |

