 Open Access Article
Molybdenum sulfide–reduced graphene oxide p–n heterojunction nanosheets with anchored oxygen generating manganese dioxide nanoparticles for enhanced photodynamic therapy†
Sutanu
Kapri
and
Sayan
Bhattacharyya
 *
*
Department of Chemical Sciences, Centre for Advanced Functional Materials, Indian Institute of Science Education and Research (IISER) Kolkata, Mohanpur – 741246, India. E-mail: sayanb@iiserkol.ac.in
First published on 1st October 2018
Abstract
In an unprecedented approach, p–n heterojunction nanosheets comprising ∼5 nm thick p-type MoS2 nanoplates integrated onto n-type nitrogen doped reduced graphene oxide (n-rGO) have been employed for photodynamic therapy (PDT). When near infrared (NIR) light with 980 nm wavelength was irradiated on this nanocomposite, effective electron–hole separation was obtained across the heterojunction. The nanosheets were modified with lipoic acid functionalized poly(ethylene glycol) to provide better biocompatibility and colloidal stability in physiological solution. The surface decorated 3–5 nm MnO2 nanoparticles (NPs) triggered the disproportionation of intracellular H2O2 which improved generation of reactive oxygen species (ROS) for enhanced PDT cancer therapy, studied in vitro. The role of N-doping in rGO and the effect of immobilization of MnO2 NPs were systematically investigated by control experiments. Our smartly designed p-MoS2/n-rGO–MnO2–PEG nanosheets outperform conventional PDT agents by overcoming limitations such as low absorption band, unfavourable bioavailability and limitations in tissue oxygenation.
Introduction
The p–n heterojunction between semiconductor materials of dissimilar band gaps can be used to engineer the electronic energy bands and therefore provide real time control over the electronic conductivity across graded or abrupt interfaces.1 Apart from electronic and optoelectronic device applications ranging from transistors2 and solar cells3 to lasers,4 where the p–n junction acts as the basic building block, the unorthodox use of heterostructures consisting of multiple heterojunctions is highly intriguing whereby the separated charge carriers can be utilized for chemical and biochemical transformations. For instance NIR light absorbing p–n heterostructures can be employed in PDT with the advantages of minimal side effect.5 In general PDT employs NIR light with far more penetration depth inside soft biological tissues than UV/visible light, where the photosensitizer subsequently transfers its energy to molecular oxygen to create ROS for selective destruction of key cellular components via apoptosis and necrosis mediated pathways.6,7 In the case of the p–n heterojunction, the excited electrons in the conduction band can react with O2 to form superoxide anion radicals (O2−˙) and holes in the valence band can react with H2O to form hydroxyl radicals,8 both of which are extremely cytotoxic towards cancer cells. Recently Au–CuS heterojunction NPs have been employed to produce cytotoxic ROS,9 and BiOI@Bi2S3@bovine serum albumin heterojunction NPs were reported as radio/photo-sensitizers for cancer therapy.10 Although Tian, Bezanilla and co-workers have demonstrated free-standing coaxial p-type/intrinsic/n-type silicon nanowires in neuromodulation via a photoelectrochemical process,11 to the best of our knowledge, the strategy of employing a nanoscale p–n heterojunction in photodynamic cancer therapy has not been explored. In the past, n-type nitrogen doped reduced graphene oxide (n-rGO) supported p-type MoS2 nanoplates have been used in photochemical/photoelectrochemical hydrogen generation.8 This particular system has remarkable potential in PDT; however their large size restricts the intended biomedical applications. Moreover, the development of a photosensitizing nanosystem that can alleviate tumour hypoxia is extremely challenging.We use the p–n heterojunction concept to develop a PDT agent consisting of poly(ethylene glycol) modified (PEGylated), MnO2 NP decorated p-MoS2/n-rGO nanosheets (p-MoS2/n-rGO–MnO2–PEG). The nanosheet structure has the advantages of a large surface area and rapid absorption of NIR light.12 While the coordination of a semiconductor like p-MoS2 on n-rGO improves photogeneration of electron–hole pairs,8,13 the heterojunction promotes the migration of electrons and holes, and enhances the separation of charge carriers upon NIR light irradiation. The role of MnO2 is to overcome the hypoxic conditions prevalent within the tumour microenvironment, by generating O2 in the presence of a high level of H2O2 (100 μM to 1 mM) via the Fenton reaction.14–17In vitro studies clearly demonstrate the PDT efficacy of this nanosystem that can overcome the basic limitations of common photosensitizers such as absorption of light in the UV-visible region, low photostability, low cellular uptake, non-uniform distribution within cancerous tissues, poor hydrophilicity and poor resistance to enzymatic degradation.18 ROS generation within the tumour tissues could be controllably achieved by this O2 self-sufficient nanoplatform under 980 nm NIR irradiation at 0.4 W cm−2 power density.
Results and discussion
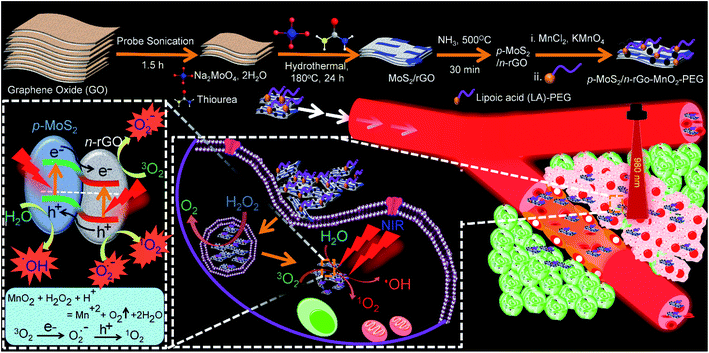
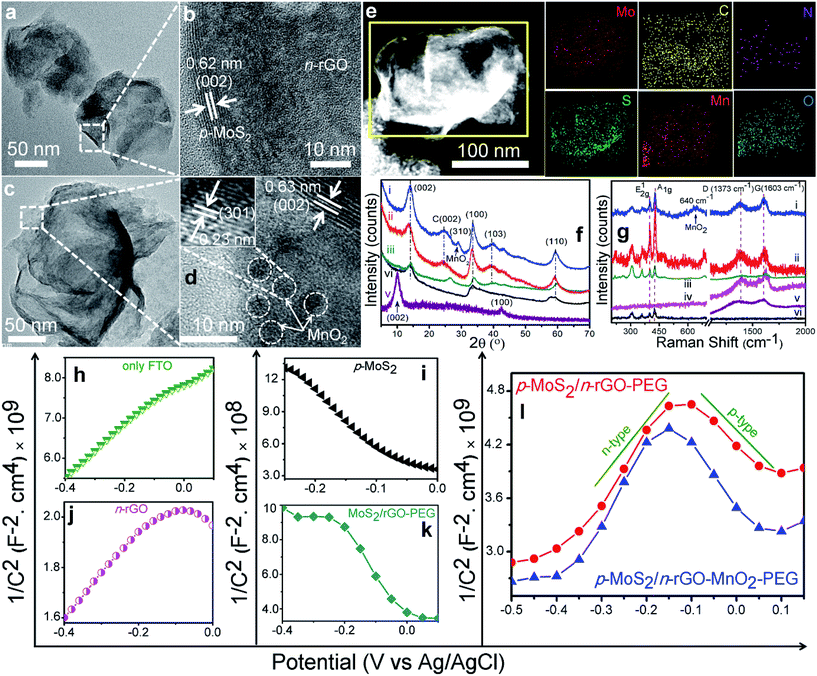
The top panel in Scheme 1 shows the synthesis methodology of p-MoS2/n-rGO–MnO2–PEG heterojunction nanosheets through liquid exfoliation of GO and hydrothermal reaction with Na2MoO4·2H2O and thiourea, followed by nitrogen doping and subsequent anchoring of MnO2 NPs. Herein thiourea not only acts as a source of sulphur to form MoS2 but also acts as a reducing agent for GO to rGO conversion (see the Experimental section, ESI†). In the fourth step, lipoic acid termination of PEG (LA–PEG2000) provides better biocompatibility and colloidal stability in physiological solution (Fig. S1†).19 The lower panel of Scheme 1 shows the conceptual basis of this work whereby the PEGylated p–n heterojunction nanosheets serve as an NIR light triggered photosensitizer equipped with the capability to separate electrons and holes. Once the surface modulated nanosheets are internalized within the blood vessel and accumulated at the tumour area, endogenous H2O2 influenced and MnO2 NP triggered O2 generation is balanced by its transformation into cytotoxic ROS components such as hydroxyl radicals (·OH) and singlet oxygen (1O2) by the separated charge carriers, analogous to photocatalytic water splitting.In order to understand the relevance of each component in the designed PDT agent, three PDT nanosystems were studied, (i) MoS2/rGO–PEG nanosheets, where MoS2 nanoplates are grown in situ on undoped rGO, (ii) p-MoS2/n-rGO–PEG nanosheets, where p-type MoS2 nanoplates are grown in situ on nitrogen doped n-rGO, and finally (iii) p-MoS2/n-rGO–MnO2–PEG, where MnO2 NPs are decorated onto p-MoS2/n-rGO heterojunction nanosheets. Exfoliation of GO nanosheets reduces its average length and thickness from ∼500 nm and 5 nm for the as-synthesized free-standing GO to ∼170 nm and ∼2.8 nm for the exfoliated GO nanosheets, respectively (Fig. S2†). While nitrogen doping in rGO does not significantly alter the above dimensions, the rGO/n-rGO nanosheets suppress the aggregation of MoS2 nanoplates which otherwise aggregate in flower-like clusters (Fig. S2†). Similarly Fig. 1a shows that the p-MoS2/n-rGO–PEG nanosheets have a mean lateral dimension of ∼180 nm, along with 5–12 nm long strips of p-MoS2 nanoplates grown on n-rGO, as seen from the lattice fringes in Fig. S2h.† The crystalline p-MoS2 nanoplates with an interplanar spacing of 0.62 nm grow in the [002] direction (Fig. 1b). 3–5 nm diameter MnO2 NPs are immobilized on n-rGO through electrostatic interaction between the positively charged Mn2+ ions and negatively charged oxygen containing functional groups present on the rGO surface (Fig. 1c and d). The interplanar spacing of crystalline MnO2 is 0.23 nm corresponding to the (211) reflection, consistent with bare MnO2 NPs (Fig. S2†).20 Moreover, the uniform elemental distribution over the nanosheets attests to the successful design of p-MoS2/n-rGO–MnO2–PEG (Fig. 1e). While the atomic ratio of Mo![[thin space (1/6-em)]](https://www.rsc.org/images/entities/char_2009.gif) :
:![[thin space (1/6-em)]](https://www.rsc.org/images/entities/char_2009.gif) S is 4
S is 4![[thin space (1/6-em)]](https://www.rsc.org/images/entities/char_2009.gif) :
:![[thin space (1/6-em)]](https://www.rsc.org/images/entities/char_2009.gif) 9.4 in p-MoS2, the nearly equivalent weight fraction of C and Mo (Table S1†) shows a uniform distribution of the p-MoS2 nanoplates on n-rGO with ∼8.7 wt% N. The desired nanosheets retain their average lateral dimension of ∼190 nm and thickness of 5–6 nm while retaining high monodispersity (Fig. S3†), suitable for cellular internalization. The nanosheets possess a decent surface area and the pore size distribution is between 3 and 3.6 nm (Fig. S4†). For instance the specific surface area increases from 94 ± 4 to 106 ± 3 m2 g−1 after nitrogen doping and decreases to 55 ± 2 m2 g−1 after MnO2 NP incorporation (Table S2†). The mesoporous nature, showing capillary condensation,21 provides active catalytic sites, enhancing their photocatalytic performance. Fourier transform infrared (FTIR) spectral analysis (Fig. S5†) and zeta potential measurements (Fig. S6†) suggest the presence of graphitic domains of rGO,22 and efficient grafting and conjugation of lipoic acid and PEG onto the nanosheets.
9.4 in p-MoS2, the nearly equivalent weight fraction of C and Mo (Table S1†) shows a uniform distribution of the p-MoS2 nanoplates on n-rGO with ∼8.7 wt% N. The desired nanosheets retain their average lateral dimension of ∼190 nm and thickness of 5–6 nm while retaining high monodispersity (Fig. S3†), suitable for cellular internalization. The nanosheets possess a decent surface area and the pore size distribution is between 3 and 3.6 nm (Fig. S4†). For instance the specific surface area increases from 94 ± 4 to 106 ± 3 m2 g−1 after nitrogen doping and decreases to 55 ± 2 m2 g−1 after MnO2 NP incorporation (Table S2†). The mesoporous nature, showing capillary condensation,21 provides active catalytic sites, enhancing their photocatalytic performance. Fourier transform infrared (FTIR) spectral analysis (Fig. S5†) and zeta potential measurements (Fig. S6†) suggest the presence of graphitic domains of rGO,22 and efficient grafting and conjugation of lipoic acid and PEG onto the nanosheets.
Structural information on the nanosheets at different stages was obtained from powder X-ray diffraction (PXRD; Fig. 1f) and Raman spectral analysis (Fig. 1g). Both the bare and GO immobilized MoS2 crystallize in the hexagonal phase (JCPDS card no. 37-1492). The successful conversion of GO to rGO by thiourea is evident from the shift of the (002) reflection from 2θ = 10° to 24.6°, respectively.23 In p-MoS2/n-rGO–MnO2–PEG, MnO2 can be distinguished from MoS2 by its distinct (310) reflection at 2θ = 29°.24 Similarly in the Raman spectra, the 640 cm−1 vibrational band of MnO2 is prominent within the characteristic bands of MoS2 at 377 and 403 cm−1 for in-plane E1g and out-of-plane A1g vibration modes, respectively.25 In rGO, the sp2 graphitic (G) band at 1603 cm−1 is more intense than the disordered (D) band at 1373 cm−1 facilitating a conducting channel for movement of charge carriers.26 To investigate the semiconducting nature, the nanosheets were deposited on fluorine doped tin oxide (FTO) glass substrates (see the Experimental section for details†) and electrochemical impedance spectroscopy (EIS) measurements were performed at an AC frequency of 10 kHz in 1 M NaOH electrolyte solution using three-electrode electrochemical cells. As shown from the Mott–Schottky (M–S) plots in Fig. 1h to 1, both MoS2 and MoS2/rGO–PEG show a negative slope in the M–S plot (1/C2vs. potential (V), C stands for capacitance) suggesting p-type character of the nanosheets whereas n-rGO shows a positive slope indicating n-type behaviour. With p-MoS2/n-rGO–PEG and p-MoS2/n-rGO–MnO2–PEG nanosheets, the M–S plots represent an inverted “V-shape” behaviour validating their p–n heterojunction characteristics.8,13
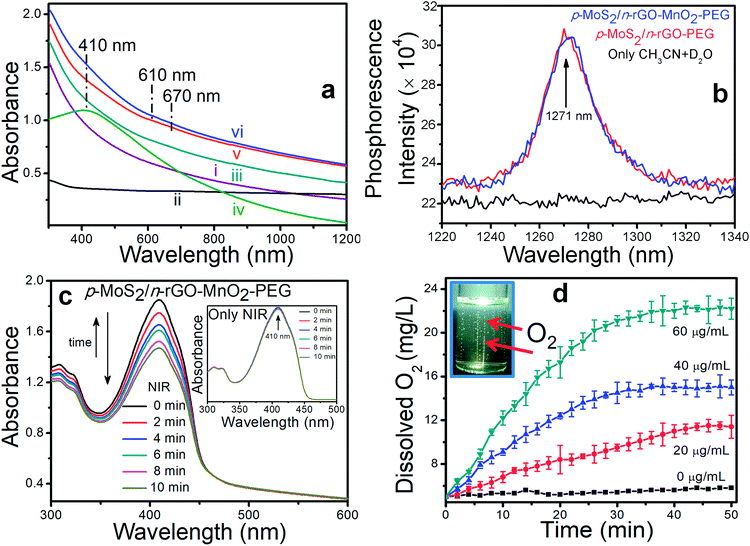
The befitting optical properties of these nanosheets attest to their eligibility to act as a PDT agent, the most important being their absorption in the NIR region, 700–1100 nm. At an equivalent concentration of 60 μg mL−1, the initial observation from the optical absorbance spectra in Fig. 2a is the widening of absorbance from GO to rGO in the composite nanosheets, due to improved π-conjugation. Nitrogen doping in rGO further enhances the NIR absorbance because heteroatoms create more energy states which absorb lower energy photons.27 Dispersion of MoS2 nanoplates results in a weak absorption band at 610–670 nm whereas the decoration of MnO2 NPs is evident from the weak absorption peak at 410 nm. The other condition to become an efficient PDT agent is the ability to generate ROS namely 1O2 under NIR light irradiation. With 980 nm light excitation, the 1O2 phosphorescence quantum yield (Φ) of p-MoS2/n-rGO–MnO2–PEG was calculated to be 37% in acetonitrile (CH3CN)–D2O solvent with respect to Rose Bengal (RB, Φ = 0.76) as a reference photosensitizer.28 The broad peak near 1271 nm due to radiative decay of 1O229 remains unaltered irrespective of MnO2 NP decoration (Fig. 2b). 1O2 can be monitored from its absorption by a trapping probe, 1,3-diphenylisobenzofuran (DPBF), which upon absorption degrades to an endoperoxide product via a Diels–Alder 1,4-cycloaddition process30 that decreases the absorption intensity of DPBF. While NIR irradiation alone cannot produce 1O2, which keeps the absorption intensity of DPBF at 410 nm unchanged (Fig. 2c, inset), p-MoS2/n-rGO–MnO2–PEG nanosheets gradually decrease the absorption intensity with prolonged laser irradiation confirming the continuous generation of 1O2 (Fig. 2c). When H2O2 is added to the medium under NIR irradiation, the higher O2 generation from H2O2 decomposition leads to more 1O2 production which decreases the DPBF absorbance (Fig. S7†). Adding NaN3 as a radical scavenger removes the produced ROS, keeping the DPBF absorbance unchanged. ROS generation is further evaluated from the hydrolysis of non-fluorescent dye 2′,7′-dichlorofluorescein diacetate (DCFH-DA) to the fluorescent 2′,7′-dichlorofluorescein (DCF) via deacetylation reaction.30,31 Under NIR irradiation at 980 nm, the DCF fluorescence intensity at 522 nm increases 19 fold with p-MoS2/n-rGO–MnO2–PEG as compared to MoS2/rGO–PEG nanosheets (Fig. S7†), suggesting an effective ROS production. Since the concentration range of endogenous H2O2 in most tumour tissues is 10–100 μM, the dissolved oxygen (DO) production by p-MoS2/n-rGO–MnO2–PEG nanosheets in 100 μM H2O2 solution was measured with a portable DO meter (Fig. 2d). Since MnO2 NPs can catalytically trigger the decomposition of intracellular H2O2 to O2 and H2O, upon adding different concentrations of the nanosheets, oxygen is produced rapidly (Fig. 2d inset); thus DO increases proportionally with nanosheet concentration. In order to simulate a cellular hypoxic environment, the oxygen generating properties of these nanosheets were also evaluated in N2 saturated solutions at different pH (Fig. S8a and b†). Among these nanosheets, p-MoS2/n-rGO–MnO2–PEG efficiently generates enough oxygen that could alleviate the hypoxia conditions inside tumour tissues. With 20 μg mL−1 p-MoS2/n-rGO–MnO2–PEG nanosheets, the amount of dissolved O2 is 6.4 mg L−1 under normoxic conditions (Fig. 2d) as compared to 4.9 mg L−1 when the solution is saturated with N2 (Fig. S8a†). The O2 generation triggered by p-MoS2/n-rGO–MnO2–PEG is faster at pH 5.5 than at pH 7.4 (Fig. S8b†) since in an acidic environment, MnO2 can better react with H2O2.
In vitro cytotoxicity and PDT
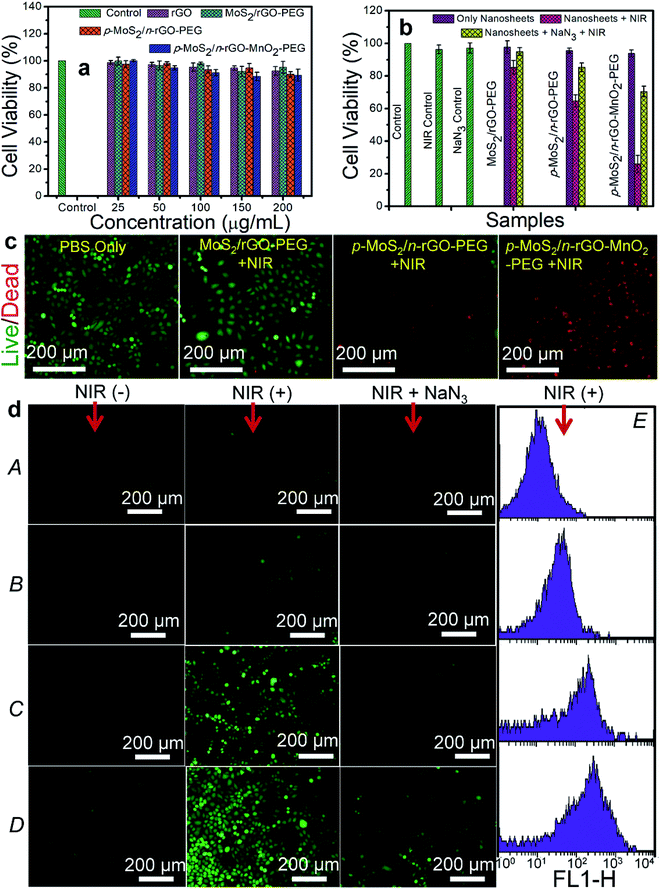
In the absence of NIR illumination, all the nanosheets starting from rGO and MoS2/rGO–PEG to p-MoS2/n-rGO–PEG and p-MoS2/n-rGO–MnO2–PEG at different concentrations (25, 50, 100, 200 μg mL−1) demonstrate excellent cell viability for 48 h both with HeLa cells (human cervical carcinoma cells) and HEK 293 cells (human embryo kidney cells) as shown by standard methyl thiazolyl tetrazolium (MTT) assay,32 in Fig. 3a and S9.† Specifically, the cell viability at a high concentration of 200 μg mL−1 p-MoS2/n-rGO–MnO2–PEG nanosheets is ∼85% against both HeLa and HEK 293 cells. An efficient PDT agent should exhibit notable cytotoxicity towards cancer cells only under light irradiation whereas in the absence of light it is supposed to be benign in all types of cells. When HeLa cells are incubated for 12 h with 60 μg mL−1 p-MoS2/n-rGO–MnO2–PEG nanosheets accompanied by 980 nm NIR laser irradiation (0.4 W cm−2, 5 min), cell viability reduces to 30% after 24 h incubation (Fig. S10†). The cell viability reduces further to 14% at 120 μg mL−1, which is a usual occurrence with increasing concentration of the PDT agents. The presence of MnO2 NPs helps to overcome tumour hypoxia,10 such that at 120 μg mL−1 concentration, the in vitro cell killing efficacy is 3-fold and more than 5-fold as compared to that of MoS2/rGO–PEG and p-MoS2/n-rGO–PEG, respectively. Cell killing can be further enhanced by increasing the laser power density (Fig. S11†). However since the threshold temperature for cell apoptosis is about 43 °C,29 temperature elevation was controlled to less than 40 °C by tuning the concentration, limiting the laser power density and irradiation time in order to minimize the photothermal effect and maximize the PDT effect. Accordingly, the nanosheet concentration was fixed at 60 μg mL−1 with 5 min laser irradiation at 0.4 W cm−2 power density (Fig. 3b) where the cell killing efficiency of p-MoS2/n-rGO–MnO2–PEG is still 3.3 and 2.5 times higher than that of MoS2/rGO–PEG and p-MoS2/n-rGO–PEG, respectively. However a mild photothermal effect can increase the efficiency of nanosheet uptake by the cells,33 as well as enhancing the photocatalysis process through improved mobility of photogenerated charge carriers.34 When a 1O2 quencher such as 50 μM NaN3 is added, cell viability shows an improving trend even in the presence of laser irradiation, highlighting the importance of 1O2 induced oxidative damage for cancer cell death.35The promising therapeutic PDT efficacy of these nanosheets was evaluated by monitoring the fluorescence microscope images obtained by co-staining with fluorescein diacetate for live cells and propidium iodide (PI) for dead cells (Fig. 3c and S12†). Without NIR irradiation the cells are not visibly damaged by the biocompatible nanosheets as evident from the vivid green fluorescence. With NIR irradiation the merged fluorescence images show a substantial increase in red fluorescence. From the fluorescence microscopy images of 1500 cells it is observed that more than 90% of the cells are damaged by p-MoS2/n-rGO–MnO2–PEG as compared to ∼25% and ∼8% damaged cells for p-MoS2/n-rGO–PEG and MoS2/rGO–PEG, respectively. Furthermore, the intracellular ROS production was investigated by fluorescence microscopy with cell permeable green fluorescent ROS indicator DCFDA. As observed in Fig. 3d, both NIR irradiation and the p–n heterojunction nanosheets are required to increase the intracellular ROS yield in HeLa cells by intracellular electron–hole pair separation. A remarkable green fluorescence of DCF is observed with p-MoS2/n-rGO–MnO2–PEG and p-MoS2/n-rGO–PEG whereas the green fluorescence is negligible for control cells and MoS2/rGO–PEG. Obviously, upon adding the NaN3 scavenger the fluorescence intensity decreases. Flow cytometry reveals a remarkable shift in the DCF fluorescence intensity (Fig. 3d(E)) wherein the quantified fluorescence intensities of DCF with NIR treated p-MoS2/n-rGO–MnO2–PEG, p-MoS2/n-rGO–PEG, and MoS2/rGO–PEG nanosheets are 14, 8, and 3-fold more as compared to only NIR treated samples, respectively.
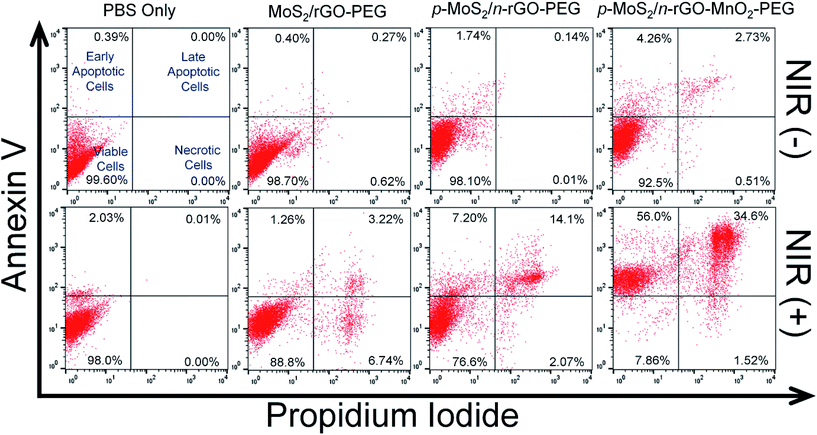
To understand the mechanistic cell death either by apoptotic or necrotic pathways, flow cytometry was employed with an Alexa Fluor 488 Annexin V/dead cell apoptosis kit. The involvement of dual staining, green emission from Alexa Fluor 488-Annexin V, affinity to bind phosphatidyl serine and DNA binding PI dye with red emission combine to identify the cellular apoptotic (early or late) or necrotic pathways. During the early stage of apoptosis, cells bind to Alexa Fluor 488-Annexin V and change their phospholipid asymmetry to display green fluorescence while necrotic cells bind only with PI. In late apoptosis the cells lose their membrane integrity and display dual positive emission. Under NIR irradiation for 5 min, the population of apoptotic and dead cells for p-MoS2/n-rGO–MnO2–PEG is ∼90%, much higher than ∼21% for p-MoS2/n-rGO–PEG and ∼5% for MoS2/rGO–PEG (Fig. 4). The minimal cell population in the necrosis stage suggests that the decrease in cell membrane integrity occurs via an apoptosis pathway. The statistical data of cell population at various stages of cellular damage validate the effectiveness of p-MoS2/n-rGO–MnO2–PEG nanosheets in producing ROS in HeLa cells activated by intracellular H2O2 and NIR irradiation. Most importantly these p–n heterojunction nanosheets act as active photosensitizers wherein the charge carriers can be separated and along with the advantage of MnO2 NPs in producing intracellular ROS, together make this system an exceptional PDT agent, as demonstrated in vitro.
Notwithstanding the unprecedented efficacy of p–n heterojunction nanosheets towards PDT, demonstrated in vitro, there are complexities that abound within the biomicroenvironment of animal systems, primarily associated with the dynamic non-specific interactions between the nanostructures and biological entities. Starting from in vivo cellular internalization to bioclearance, the complicacies associated with the designed PDT agent involve their size, shape, agglomeration, dissolution, doses, protein adsorption, biodegradation, surface reactivity and macrophage uptake.36 At the foremost, precise nanosheet doses are required to prevent heart blockage. Moreover due to formation of a protein corona complex, the nanosheets might be engulfed by macrophage cells. Also bioclearance of the nanosheets through excretion and biodegradation processes will depend on the appropriate nanosheet dimensions and surface chemistry wherein rapid clearance may lead to overaccumulation in non-targeted organs. Taking these perplexities into account, the in vivo experiments will be the topic of our future study in order to evaluate the toxicity, biodistribution, body clearance and mechanistic PDT efficacy of p–n heterojunction nanosheets in the native biomicroenvironment.
Conclusions
In summary, we successfully designed a unique two-dimensional hybrid nanoplatform based on PEGylation of MnO2 decorated p-MoS2/n-rGO heterojunction nanosheets (p-MoS2/n-rGO–MnO2–PEG). These hybrid nanosheets show unprecedented performance as an O2 self-sufficient NIR light-triggered PDT agent. The as-synthesized nanosheets retain their excellent colloidal stability in water, phosphate buffered saline with different pH and in biological media. While the p–n heterojunction directs NIR light triggered generation and separation of electron–hole pairs that could increase the production of ROS via photocatalysis, MnO2 NPs increase intracellular O2 by the reaction with endogenous H2O2 to overcome the hypoxic conditions in the cellular microenvironment. Compared to p-MoS2/n-rGO–PEG and MoS2/rGO–PEG, the p-MoS2/n-rGO–MnO2–PEG nanosheets show enhanced DCF fluorescence and reveal hypoxia induced increased apoptosis under NIR light irradiation. Since the p-MoS2/n-rGO–MnO2–PEG nanosheets have been demonstrated in vitro to be an efficient PDT photosensitizer for cancer therapy, our strategy can be applied in developing other nanoscale heterojunction materials for biomedical applications.Conflicts of interest
There are no conflicts to declare.Acknowledgements
The authors thank Dr Sankar Maiti for providing the cell culture facilities, and Arikta Biswas and Dr Bidisha Sinha for fluorescence microscopy imaging under the Wellcome Trust/DBT India Alliance fellowship (grant number IA/I/13/1/500885) awarded to Dr Sinha. The Department of Science and Technology-Science and Engineering Board (DST-SERB), Government of India is duly acknowledged for the financial support under grant no. EMR/2016/001703. S. K. thanks the Council of Scientific and Industrial Research (CSIR), New Delhi for his fellowship (award number 09/921 (0089)/2013-EMR-I). The authors acknowledge Dr M. Venkataramanan for providing access to the laser setup. S. K. acknowledges the help of Atharva Sahasrabudhe for impedance spectroscopy measurements and discussions, and Rahul Majee for STEM-HAADF imaging.References
- J. T. Calow, P. J. Deasley, S. J. T. Owen and P. W. Webb, J. Mater. Sci., 1967, 2, 88–96 CrossRef CAS.
- P. J. Jeon, Y. T. Lee, J. Y. Lim, J. S. Kim, D. K. Hwang and S. Im, Nano Lett., 2016, 16, 1293–1298 CrossRef CAS PubMed.
- M.-L. Tsai, M.-Y. Li, J. R. D. Retamal, K.-T. Lam, Y.-C. Lin, K. Suenaga, L.-J. Chen, G. Liang, L.-J. Li and J.-H. He, Adv. Mater., 2017, 29, 1701168 CrossRef PubMed.
- D. Saxena, N. Jiang, X. Yuan, S. Mokkapati, Y. Guo, H. H. Tan and C. Jagadish, Nano Lett., 2016, 16, 5080–5086 CrossRef CAS PubMed.
- J. Hu, Y. Tang, A. H. Elmenoufy, H. Xu, Z. Cheng and X. Yang, Small, 2015, 11, 5860–5887 CrossRef CAS PubMed.
- A. P. Castano, P. Mroz and M. R. Hamblin, Nat. Rev. Cancer, 2006, 6, 535–545 CrossRef CAS PubMed.
- D. E. J. G. J. Dolmans, D. Fukumura and R. K. Jain, Nat. Rev. Cancer, 2003, 3, 380 CrossRef CAS PubMed.
- F. Meng, J. Li, S. K. Cushing, M. Zhi and N. Wu, J. Am. Chem. Soc., 2013, 135, 10286–10289 CrossRef CAS PubMed.
- Y. Chang, Y. Cheng, Y. Feng, H. Jian, L. Wang, X. Ma, X. Li and H. Zhang, Nano Lett., 2018, 2, 886–897 CrossRef PubMed.
- Z. Guo, S. Zhu, Y. Yong, X. Zhang, X. H. Dong, J. F. Du, J. N. Xie, Q. Wang, Z. J. Gu and Y. L. Zhao, Adv. Mater., 2017, 29(1–12), 1704136 CrossRef PubMed.
- R. Parameswaran, J. L. Carvalho-de-Souza, Y. Jiang, M. J. Burke, J. F. Zimmerman, K. Koehler, A. W. Phillips, J. Yi, E. J. Adams, F. Bezanilla and B. Tian, Nat. Nanotechnol., 2018, 13, 260–266 CrossRef CAS PubMed.
- D. Chimene, D. L. Alge and A. K. Gaharwar, Adv. Mater., 2015, 27, 7261–7284 CrossRef CAS PubMed.
- K. Zhang, W. J. Kim, M. Ma, X. J. Shi and J. H. Park, J. Mater. Chem. A, 2015, 3, 4803–4810 RSC.
- J. Kim, H. R. Cho, H. Jeon, D. Kim, C. Song, N. Lee, S. H. Choi and T. Hyeon, J. Am. Chem. Soc., 2017, 139, 10992–10995 CrossRef CAS PubMed.
- W. Zhang, S. Li, X. Liu, C. Yang, N. Hu, L. Dou, B. Zhao, Q. Zhang, Y. Suo and J. Wang, Adv. Funct. Mater., 2018,(1–9), 1706375 CrossRef.
- G. Yang, L. Xu, Y. Chao, J. Xu, X. Sun, Y. Wu, R. Peng and Z. Liu, Nat. Commun., 2017, 8, 902 CrossRef PubMed.
- J. Liu, Q. Chen, W. Zhu, X. Yi, Y. Yang, Z. Dong and Z. Liu, Adv. Funct. Mater., 2017, 27, 1605926 CrossRef.
- L. Cheng, C. Wang, L. Feng, K. Yang and Z. Liu, Chem. Rev., 2014, 114, 10869–10939 CrossRef CAS PubMed.
- K. Susumu, B. C. Mei and H. Mattoussi, Nat. Protoc., 2009, 4, 424 CrossRef CAS PubMed.
- B. Debnath, A. S. Roy, S. Kapri and S. Bhattacharyya, ChemistrySelect, 2016, 1, 4265–4273 CrossRef CAS.
- A. Datta, S. Kapri and S. Bhattacharyya, Green Chem., 2015, 17, 1572–1580 RSC.
- D. Ghosh, G. Halder, A. Sahasrabudhe and S. Bhattacharyya, Nanoscale, 2016, 8, 10632–10641 RSC.
- K. Moon, J. Lee, R. S. Ruoff and H. Lee, Nat. Commun., 2010, 1, 73 Search PubMed.
- T. Jiang, L. Zhang, H. Jin, X. Wanga and J. Zhou, Dalton Trans., 2015, 44, 7606–7612 RSC.
- D. H. Youn, J.-W. Jang, J. Y. Kim, J. S. Jang, S. H. Choi and J. S. Lee, Sci. Rep., 2014, 4, 5492 CrossRef CAS PubMed.
- A. Sahasrabudhe, S. Kapri and S. Bhattacharyya, Carbon, 2016, 107, 395–404 CrossRef CAS.
- C. Lee, W. Kwon, S. Beack, D. Lee, Y. Park, H. Kim, S. K. Hahn, S. W. Rhee and C. Kim, Theranostics, 2016, 6, 2196–2208 CrossRef CAS PubMed.
- J. Ge, M. Lan, B. Zhou, W. Liu, L. Guo, H. Wang, Q. Jia, G. Niu, X. Huang, H. Zhou, X. Meng, P. Wang, C.-S. Lee, W. Zhang and X. Han, Nat. Commun., 2014, 5, 4596 CrossRef CAS PubMed.
- P. Kalluru, R. Vankayala, C. S. Chiang and K. C. Hwang, Biomaterials, 2016, 95, 1–10 CrossRef CAS PubMed.
- H. Wang, X. Yang, W. Shao, S. Chen, J. Xie, X. Zhang, J. Wang and Y. Xie, J. Am. Chem. Soc., 2015, 137, 11376–11382 CrossRef CAS PubMed.
- H. J. Zhu, J. C. Li, X. Y. Qi, P. Chen and K. Y. Pu, Nano Lett., 2018, 18, 586–594 CrossRef CAS PubMed.
- S. Kapri, S. Maiti and S. Bhattacharyya, Carbon, 2016, 100, 223–235 CrossRef CAS.
- J. Wei, J. Li, D. Sun, Q. Li, J. Ma, X. Chen, X. Zhu and N. Zheng, Adv. Funct. Mater., 2018, 1706310 CrossRef.
- Z. X. Gan, X. L. Wu, M. Meng, X. B. Zhu, L. Yang and P. K. Chu, ACS Nano, 2014, 8, 9304 CrossRef CAS PubMed.
- L. Huang, Z. Li, Y. Zhao, Y. Zhang, S. Wu, J. Zhao and G. Han, J. Am. Chem. Soc., 2016, 138, 14586–14591 CrossRef CAS PubMed.
- B. Wang, X. He, Z. Zhang, Y. Zhao and W. Feng, Acc. Chem. Res., 2013, 46, 761–769 CrossRef CAS PubMed.
Footnote |
| † Electronic supplementary information (ESI) available: Experimental section; FESEM, AFM and TEM images; N2 sorption isotherms; Mott–Schottky plots; FTIR spectra; zeta potential; fluorescence spectra; cell viabilities; photothermal heating curves; comparison of fluorescence intensities; and live–dead cell assay. See DOI: 10.1039/c8sc02508h |
| This journal is © The Royal Society of Chemistry 2018 |

