 Open Access Article
Visualization of oxidative injury in the mouse kidney using selective superoxide anion fluorescent probes†
Yun
Lv‡
a,
Dan Cheng‡
a,
Dongdong Su
c,
Mei
Chen
d,
Bin-Cheng
Yin
 b,
Lin
Yuan
 *a and
Xiao-Bing
Zhang
 a
a
aState Key Laboratory of Chemo/Biosensing and Chemometrics, College of Chemistry and Chemical Engineering, Hunan University, Changsha, 410082, PR China. E-mail: lyuan@hnu.edu.cn
bLab of Biosystem and Microanalysis, State Key Laboratory of Bioreactor Engineering, East China University of Science and Technology, Shanghai, 200237, China
cLaboratory of Bioimaging Probe Development, Singapore Bioimaging Consortium, Agency for Science, Technology and Research (A*STAR), 11 Biopolis Way, Helios #02-02, 138667, Singapore
dCollege of Materials Science and Engineering, Hunan University, Changsha 410082, PR China
First published on 13th September 2018
Abstract
Drug-induced acute kidney injury (AKI), caused by renal drug metabolism, has been regarded as a main problem in clinical pharmacology and practice. However, due to the lack of effective biomarkers and noninvasive real-time tools, the early diagnosis of drug-induced AKI is still a crucial challenge. The superoxide anion (O2˙−), the preliminary reactive oxidative species, is closely related to drug-induced AKI. In this paper, we reported two new mitochondria-targeted fluorescent probes for investigating AKI via mapping the fluctuation of O2˙− with high sensitivity and selectivity by the combination of rational design and a probe-screening approach. Small-molecule fluorescent probes (Naph-O2˙− and NIR-O2˙−) with high accuracy and excellent selectivity were successfully applied to detect endogenously produced O2˙− in living cells and tissues by dual-model confocal imaging, and to trap the fluctuation of the O2˙− level during the drug-induced nephrotoxicity. Moreover, probe NIR-O2˙− was also used to elucidate the protective effects of L-carnitine (LC) against drug-induced nephrotoxicity for the first time. Therefore, these probes may be potential chemical tools for exploring the roles of O2˙− in complex nephrotoxicity disease systems.
Introduction
The kidney plays an essential role in metabolism and clearance of numerous hydrophilic xenobiotics and endogenous compounds.1 As a consequence, the kidney is often exposed to drugs with high concentrations and is more susceptible to damage by drugs, which may ultimately cause acute kidney injury (AKI).2 In fact, drug-induced AKI is a long-term concern in clinical pharmacology and accounts for 19% to 26% of cases of AKI in clinical practice,3 which is a major reason for post-marketing withdrawals of medicinal products.4,5 At present, serum creatinine (SCr) and blood urea nitrogen (BUN) are conventional nephrotoxicity biomarkers for the evaluation of drug-induced AKI,6 but they are not available for early diagnosis7,8 and usually affected by a variety of other diseases.9 Moreover, a limited number of early biomarkers have been explored during the AKI process. For these reasons, innovative preclinical nephrotoxicity screening methods are required to evaluate early nephrotoxicity for drug development and clinical application.Reactive oxygen species (ROS), mainly produced in mitochondria, have been revealed as the inevitable by-products in renal drug metabolism, which may lead to cell apoptosis and other acute kidney damage.10,11 For example, cisplatin, a commonly used chemotherapeutic drug for treatment of numerous human cancers, is known to cause serious nephrotoxicity among certain populations.12 In general, cisplatin can preferentially accumulate in renal tubular cells and induce mitochondrial dysfunction due to the increase of endogenous ROS level via depletion of GSH and inactivation of antioxidant enzymes,12–14 which results in the induction of tubular epithelial cell damage.15 Hence the superoxide anion radical (O2˙−), the precursor of most ROS,16 can therefore act as an early symptom of nephrotoxicity for detecting and studying drug-induced AKI. Hence, the development of noninvasive detection of O2˙− in mitochondria would be an efficient way to evaluate and predict drug-induced AKI.
Fluorescence imaging techniques, as a noninvasive tool, create enormous possibilities and provide new opportunities for the detection of small-molecules and real-time evaluation of cellular damage in preclinical studies.17–23 Fluorescent probes with two-photon (TP) excitation or near-infrared (NIR) emission (650–900 nm) are more attractive because of weak specimen photodamage, low background fluorescence and deep tissue penetration in living systems.24,25 At present, some TP or NIR fluorescent probes have been developed for the detection of O2˙− in biological systems.26–32 However, desirable TP or NIR fluorescent probes with high selectivity and sensitivity for investigating the role of O2˙− in drug-induced nephrotoxicity are still lacking.
In this work, we reported two mitochondria-targeted fluorescent probes, one two-photon fluorescent probe (Naph-O2˙−) and one NIR fluorescent probe (NIR-O2˙−) for investigating AKI through mapping the fluctuation of O2˙− by the combination of rational design and a screening approach. These probes showed excellent sensitivity and high selectivity toward O2˙− in physiological environments without interference from other species. Moreover, these probes were successfully applied for imaging of endogenous O2˙− in living cells and tissues and visualizing the small fluctuation of the O2˙− level in drug-induced pathological nephrotoxicity for the first time.
Results and discussion
Screening and design of probes
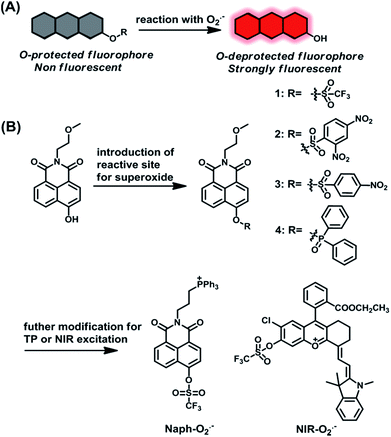
Up to now, many small molecule fluorescent probes for O2˙− have been reported by utilizing the oxidizability and nucleophilicity of O2˙−.33–40 And some of these probes that are based on a nucleophilic reaction mechanism possess high sensitivity toward O2˙−. However, distinguishable detection of O2˙− remains a big challenge due to the disturbance from other biological species with similar properties, such as H2O2 and GSH, especially in a multiple species coexisting physiological context.41,42 To address this issue, we prepared a series of compounds as candidate probes and examined the response of these probes to O2˙− by a screening method. Inspired by previous studies, the protection–deprotection strategy of hydroxyl groups on fluorophores is employed for O2˙− sensing, such as O2˙−-induced deprotection of trifluoromethanesulfonate,43 2,4-dinitrobenzenesulfonyl36,38 or diphenyl phosphinated39,40 groups. In general, the protection of the hydroxyl group of fluorophores weakens their π-conjugation, leading to the weak fluorescence of caged fluorophores. Whereas, upon reaction with O2˙−, the uncaged fluorophores will recover their fluorescence, resulting in an “off–on” fluorescence response toward O2˙− (Scheme 1A). The hydroxyl naphthalimide chromophore was selected as a signal platform due to its high fluorescence quantum yield, outstanding photostability and excellent two-photon properties.44 Accordingly, some potential protective groups were introduced into the hydroxyl group of chromophores as the reaction site of O2˙−, including trifluoromethanesulfonate, 2,4-dinitrobenzenesulfonyl, 4-nitrobenzenesulfonyl, and diphenyl phosphinated, to afford compounds 1–4 (Scheme 1B).With compounds 1–4 in hand, we first evaluated the reactivity of these probes towards O2˙− under physiological conditions. As shown in Fig. S1,† compounds 2 and 3 displayed minor fluorescence enhancement after addition of O2˙−, while compound 1 exhibited a significantly substantial fluorescence increase. These results indicate that compound 1 is more sensitive to O2˙− than compounds 2 and 3. We then further investigated the selectivity of compounds 1–3 to various oxidant/nucleophilic species. As shown in Fig. S2,† compound 1 showed excellent selectivity for O2˙−, whereas, compound 2 and 3 were susceptible by other related biological agents (e.g. GSH and H2S2). Compared with 1, compound 4 also showed relatively good sensitivity and high selectivity toward O2˙− (Fig. S1 and S2†); however, compound 4 itself is relatively unstable in PBS solution, as shown in Fig. S3.† Therefore, the above results revealed that the trifluoromethyl group is a competent candidate reaction site for O2˙− with high sensitivity and selectivity. To obtain the mitochondria targeting ability, the hydroxylnaphthalimide chromophore was further modified with a triphenylphosphine (TPP)45,46 group to construct mitochondria-targeted probe Naph-O2˙− with two-photon excitation potential. Furthermore, to investigate mitochondrial O2˙− at different tissues and in vivo levels in a drug-induced nephrotoxicity model, a NIR probe NIR-O2˙− was also constructed based on a positively charged merocyanine NIR dye47,48 through simple chemical synthesis (Scheme 1B) (for synthetic and characterization details, see the ESI†).
Spectral response of the probes to O2˙−
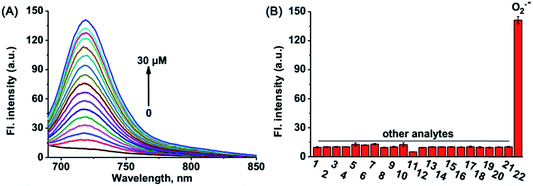
The capability of probes to respond to O2˙− was evaluated at room temperature. Before that, the stability of NIR-O2˙− and Naph-O2˙− was first measured (Fig. S4†), showing that they were latent for O2˙− recognition. As shown in Fig. 1A, NIR-O2˙− shows feeble fluorescence (Φ < 0.01) in the absence of O2˙−. Upon incubation with various concentrations (0–30 μM) of O2˙−, the fluorescence intensity (with a maximum at 719 nm) increased with the increase of O2˙− concentration (Φ = 0.55). In addition, the fluorescence intensity showed an excellent linear relationship (R2 = 0.999) in the concentration range of 0–5 μM O2˙− (Fig. S5†), and a detection limit of 0.24 μM was calculated (S/N = 3), which was significantly lower than that of O2˙− in healthy individuals.49 And the maximum absorption of NIR-O2˙− centered at 548/576 nm gradually decreased, while a new absorption peak at 698 nm appeared after addition of O2˙− (Fig. S6†). These results imply that probe NIR-O2˙− displays superior sensitivity to O2˙− and has the capability to monitor trace amounts of intracellular O2˙− in AKI in vivo. Additionally, the spectral response of Naph-O2˙− to O2˙− was also examined. As shown in Fig. S7,†Naph-O2˙− (Φ = 0.008) showed a dramatic fluorescence enhancement (Φ = 0.51) of more than 25-fold centered at 554 nm upon the addition of O2˙−. The fluorescence intensity at 554 nm reaches a plateau when the amount of O2˙− is greater than 50 μM (Fig. S8†). The detection limit was calculated to be 0.39 μM (Fig. S9†), the high sensitivity of Naph-O2˙− ensures its application in detecting endogenous O2˙− in biological systems.To simulate the physiological mitochondrial environment, spectra fluorometric titrations of probes NIR-O2˙− and Naph-O2˙− were performed in buffer solution at pH = 7.8. The results showed a more notable change with the increase in the dose of O2˙− (Fig. S10 and S11†). Then the fluorescence response of NIR-O2˙− and Naph-O2˙− to O2˙− was also evaluated at different pH values. As shown in Fig. S12 and S13,† the fluorescence intensity of NIR-O2˙− and Naph-O2˙− is stable over the range of pH 6.0 to 8.5, while obvious fluorescence enhancement is observed upon addition of O2˙− in the range of mitochondria-relevant pH from 7.0 to 8.5. In addition, the fluorescence intensity of NIR-OH and Naph-OH did not change when pH > 6.5 (Fig. S14 and S15†). The above results indicate that NIR-O2˙− and Naph-O2˙− have potential applications for the detection of mitochondrial O2˙−.
The selectivity of the probes was evaluated in detail by testing the fluorescence changes after exposure to panels of ROS, RNS, RSS and other relevant biological analytes. As shown in Fig. 1B and S16,† a striking enhancement of fluorescence intensity is triggered only by O2˙−, and there is no obvious change in the fluorescence intensity when adding other ROS, RNS, RSS (H2O2, O2˙−, NO, ONOO−, HOCl, H2S, H2S2, HSO3−, SO32−, Cys, and GSH), and biorelevant anions and cations (NO2−, SO42−, CH3COO−, Na+, K+, Mg2+, Fe2+, and Cu2+). These results collectively demonstrated the excellent selectivity of probes NIR-O2˙− and Naph-O2˙− toward O2˙−.
Proposed mechanism
According to previous reports,43 O2˙− might induce the release of a trifluoromethyl group from the hydroxyl group on the fluorophores via a nucleophilic addition reaction, and finally yield a hydroxyl-deprotected product (Scheme S2†). To verify this hypothesis, the reaction mixture of Naph-O2˙−/NIR-O2˙− and O2˙− was analyzed by mass spectrometry. The peaks of two products with m/z = 515.2 and m/z = 565.1 were observed, respectively (Fig. S17 and S18†). Furthermore, high-performance liquid chromatography (HPLC) analysis also confirmed the reaction mechanism of NIR-O2˙− and Naph-O2˙− with O2˙− (Fig. S19 and S20†). The probe NIR-O2˙− (or Naph-O2˙−) only gives a single peak at 22.1 min (or 19.5 min); however, the proposed product 7 (or Naph-OH) shows a single peak at 13.3 min (or 8.5 min). Upon the addition of O2˙− to the probe solution for 30 min, a peak corresponding to the compound 7 (or Naph-OH) appeared at 13.3 min (or 8.5 min) and the peak of the probe at 22.1 min (or 19.5 min) decreased in the meantime. Therefore, the results are in good agreement with the proposed mechanism (Scheme S2†).Fluorescence imaging of O2˙− in living cells
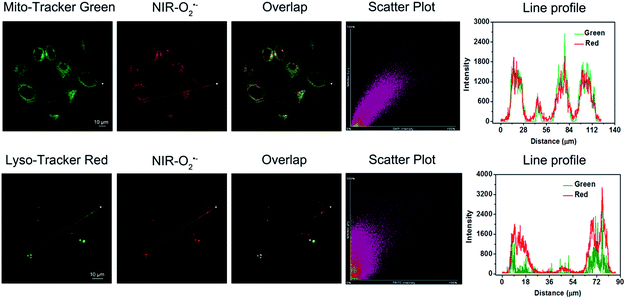
Then, we examined the potential of Naph-O2˙− and NIR-O2˙− for monitoring endogenous O2˙− in living cells by two/one-photon microscopy imaging. In order to avoid underlying interference caused by other biological oxidants and nucleophilic reagents, the selectivity assay of probes to detect O2˙− was further carried out in cells. H2O2 and SO32− were selected as the representative interfering oxidants and nucleophilic reagents in this experiment. As shown in Fig. 2A and B, HepG2 cells incubated with free probes Naph-O2˙− or NIR-O2˙− showed negligible fluorescence in the green channel or in the red channel. However, a dramatic enhancement of fluorescence could be observed when the cells were pretreated with LPS/IFN-γ before incubation with probes Naph-O2˙− or NIR-O2˙−. In contrast, the cells displayed minor fluorescence enhancement in both channels when pretreated with H2O2 or SO32− before incubation with probes, which meant that the probes were especially capable of monitoring endogenous O2˙− and had little interference in living cells. Moreover, the cells were first incubated with 2,2,6,6-tetramethylpiperidine-N-oxyl (TEMPO)50 and tiron,26 before the addition of probes as negative control groups. However, there was no obvious fluorescence increase observed for the LPS/IFN-γ-pretreated HepG2 cells when stimulated with TEMPO or titron. The main reason probably comes from the scavenging effect of TEMPO and titron on cellular O2˙− production. It is worth noting that in HepG2 and HeLa cells, Naph-O2˙− can also be used for O2˙− imaging by confocal fluorescence microscopy (Fig. S21 and S22†). In addition, these probes exhibited low cytotoxicity to live HepG2 cells when evaluated by MTT assays (Fig. S23†). Taken together, these results demonstrated that Naph-O2˙− and NIR-O2˙− show great potential for specific imaging of endogenously produced O2˙− in living cells.To confirm the target specificity of NIR-O2˙− at a subcellular level, colocalization experiments were performed in HepG2 cells using the commercial fluorescent probes Mito-Tracker Green and Lyso-Tracker Red. The cells were pre-treated with LPS/IFN-γ for 12 h and subsequently treated with Mito-Tracker Green or Lyso-Tracker Red (1 μM) for another 10 min. As shown in Fig. 3, the fluorescence of NIR-O2˙− in the red channel overlapped well with that of Mito-Tracker Green (Pearson's correlation coefficient: 0.92). In contrast, a poor overlap between the fluorescence of probeNIR-O2˙− and Lyso-Tracker Red was observed (Pearson's correlation coefficient: 0.54). We also confirmed that NIR-O2˙− can target mitochondria in HK-2 cells (Fig. S24†). Similar results were found in the case of Naph-O2˙− (Pearson's correlation coefficient: 0.91) (Fig. S25†). Thus, both probes NIR-O2˙− and Naph-O2˙− are latent tools for distinguished imaging of mitochondrial O2˙−.
Fluorescence imaging of O2˙− in drug-induced nephrotoxicity in living HK-2 cells
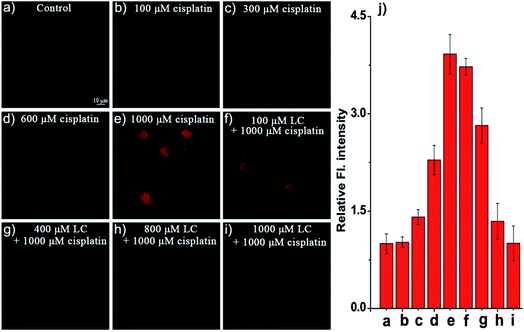
Encouraged by the results described above, we then examined the potential use of NIR-O2˙− and Naph-O2˙− to visualize O2˙− in cisplatin-induced living kidney cells, a commercially available drug antitumor, which is known to trigger acute kidney damage.12 The protective effect of antioxidants against cisplatin-induced oxidative stress would occur in experimental nephrotoxicity,51,52 such as L-carnitine (LC), an L-lysine derivative. We observed that human kidney 2 (HK-2) cells only display feeble fluorescence when incubated with NIR-O2˙− for 30 min (Fig. 4a). In contrast, HK-2 cells gave bright fluorescence and dose-dependent enhancement when the cells were pre-incubated with different concentrations of cisplatin (100–1000 μM) for 12 h and then treated with NIR-O2˙− for another 30 min (Fig. 4a–e). A 3.7-fold fluorescence enhancement was observed after incubation with 1000 μM cisplatin (Fig. 4j). However, the fluorescence is significantly reduced (Fig. 4f–j) in a dose-dependent way by the pretreatment with L-carnitine (LC), a known antioxidant that could against cisplatin-induced oxidative stress in experimental nephrotoxicity.53 Moreover, a similar fluorescence change could be observed by using probe Naph-O2˙− in a two-photon model in HK-2 cells in cisplatin-induced nephrotoxicity (Fig. S26†). In short, these observations indicate that NIR-O2˙− and Naph-O2˙− are promising probes for the detection of endogenous O2˙− in live cells. In addition, the increase of O2˙− level is closely related to the drug induced AKI process in living HK-2 cells.Living kidney tissues imaging of O2˙− in drug-induced nephrotoxicity
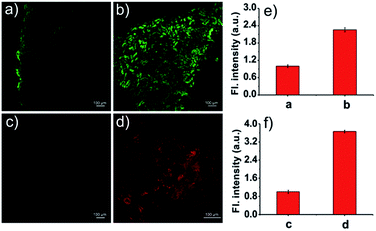
Next, the capability of probes for monitoring O2˙− in live tissues was evaluated in a drug-induced AKI mouse model. BALB/c mice were first intraperitoneally injected with cisplatin (20 mg kg−1) to generate an AKI model and PBS was used as the control group. After 48 h, the mice were sacrificed and the kidneys were sectioned for tissue fluorescence imaging. The kidney slices were treated with probe Naph-O2˙− (10 μM) or NIR-O2˙− (5 μM) for 30 min. As shown in Fig. 5, compared to the control group, the kidney tissues from cisplatin-induced AKI mice exhibited a distinctly enhanced fluorescence in the green or red channel, which indicated that probes Naph-O2˙− and NIR-O2˙− are efficient in evaluating cisplatin-induced AKI. Moreover, the fluorescence signal changes can be detected in kidney tissue-incubated Naph-O2˙− at a depth of 130 μm in the two-photon mode (Fig. S27†). The imaging depth can be detected to be 50 μm deeper than that in the one-photon mode (Fig. S28†). The changes of the detectable fluorescence signal were also observed in AKI kidney tissues within 110 μm by using probe NIR-O2˙− (Fig. S29†). In summary, these results demonstrated that both Naph-O2˙− and NIR-O2˙− are capable of visualization of O2˙− in living kidney tissues by using two/one photon fluorescence imaging, further showing their capability in renal injury studies.Fluorescence imaging of O2˙− in drug-induced nephrotoxicity in vivo
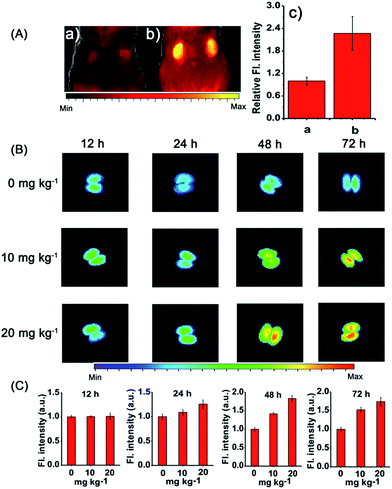
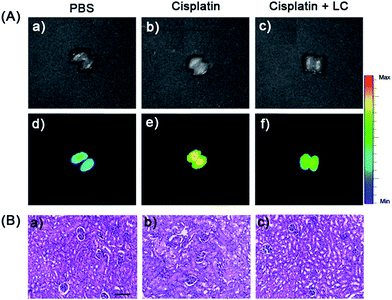
Afterwards, we applied probe NIR-O2˙− to trace the endogenous O2˙− level in vivo, which is due to drug-induced AKI. As shown in Fig. 6A, the cisplatin treated intact mice exhibited a substantial enhancement of fluorescence, indicating an increased level of O2˙− in AKI. Interestingly, increased fluorescence signals in the liver region were observed in cisplatin-treated mice (Fig. S30†). We proposed that this may be due to other side effects of cisplatin, which can lead to liver injury to a less serious extent.54 To further verify the possibility of monitoring cisplatin-induced nephrotoxicity in vivo by using NIR-O2˙−, intraperitoneal injection of cisplatin in dose-dependent (0, 10 and 20 mg kg−1) and time-dependent (12, 24, 48 and 72 h) manners were carried out, and then the probe (100 μL of 100 μM stock solution) was injected through the tail vein of the mice. After 45 min, the kidneys were harvested from the mice for fluorescence imaging. As shown in Fig. 6B, the images captured from the cisplatin-stimulated mice exhibited remarkable enhancement of signals in the kidney, while no change of fluorescence intensity was observed for the control samples that were only treated with the probe. The results indicated that the cisplatin could cause severe acute kidney injury at a 20 mg kg−1 dose and 48 h treatment time (Fig. 6C). Consequently, it is conceivable that NIR-O2˙− is appropriate for evaluating cisplatin-induced nephrotoxicity in response to oxidative stress.Finally, probe NIR-O2˙− was employed to evaluate cisplatin-induced nephrotoxicity and L-carnitine (LC) remediation in vivo (Fig. 7A). The experiment was divided into three groups. One group was injected with PBS (320 μL) in the peritoneal cavity, followed by intravenous injection with NIR-O2˙− (100 μL, 100 μM) as the negative control group; the second group was intraperitoneally injected with cisplatin (320 μL, 20 mg kg−1), followed by intravenous injection with the probe NIR-O2˙− (100 μL, 100 μM) 48 h later; while the third group was intraperitoneally injected with LC (60 μL, 400 mg kg−1) 48 h before cisplatin (320 μL, 20 mg kg−1), followed by intravenous injection with the probe NIR-O2˙− (100 μL, 100 μM). As shown in Fig. 7A, the kidney of the mice pretreated with cisplatin exhibited a distinct fluorescence increase (Fig. 7A(e)) compared to the control group (Fig. 7A(d)). Excitingly, the fluorescence of the LC pretreatment group was dramatically suppressed compared with that of the group without LC, which should be ascribed to the alleviation of the kidney injury caused by the drug LC (Fig. 7A(f)). It is worth noting that a similar phenomenon can be observed in the liver with a smaller variation degree of fluorescence (Fig. S31†), which may be a slight liver injury caused by the side effects of drug cisplatin.54 In addition, the protective effect of LC was also identified by hematoxylin–eosin (H&E) staining. Compared with the cisplatin treated kidney, the proportion of injured kidney tissues is much smaller when pretreated with LC (Fig. 7B). The results indicated that LC could reduce the injury caused by cisplatin to the kidney, which was consistent with fluorescence imaging (Fig. 7A). To the best of our knowledge, NIR-O2˙− is the first NIR fluorescent probe for the imaging of O2˙− in drug induced nephrotoxicity.
Conclusions
In summary, we have constructed a two-photon fluorescent probe Naph-O2˙− and a NIR fluorescent probe NIR-O2˙− with mitochondria-targeting ability by probe-screening strategies, which are used for highly selective monitoring of O2˙−in vitro and in vivo. The utility of these reaction-based probes for O2˙− detection has been fully verified in terms of their excellent sensitivity and selectivity to various biological oxidants and nucleophilic reagents. Moreover, the excellent performance in cell and tissue imaging illustrated that probes Naph-O2˙− and NIR-O2˙− could be used to monitor endogenous O2˙− by two-photon or one-photon fluorescence confocal microscopy. Furthermore, probe NIR-O2˙− was further demonstrated to be able to visualize the cisplatin-induced acute kidney injury and LC remediation related to O2˙− levels in vivo for the first time. We anticipate that these probes can serve as promising fluorescent tools for facilitate biomedical study on the roles of O2˙− in various kidney injury diseases.Conflicts of interest
There are no conflicts to declare.Acknowledgements
This work was financially supported by the NSFC (21622504, 21735001, and 21877029), the Science and Technology Project of Hunan Province (2017RS3019), and the Open Funding Project of the State Key Laboratory of Bioreactor Engineering. All animal procedures were performed in accordance with the Guidelines for Care and Use of Laboratory Animals of Hunan University and experiments were approved by the Animal Ethics Committee of College of Biology (Hunan University).Notes and references
- K. Hosohata, Int. J. Mol. Sci., 2016, 17, 1826–1836 CrossRef PubMed.
- K. I. Inui, S. Masuda and H. Saito, Kidney Int., 2000, 58, 944–958 CrossRef PubMed.
- H. Izzedine and M. A. Perazella, Kidney International Reports, 2017, 2, 504–514 CrossRef PubMed.
- R. D. Beger, J. Sun and L. K. Schnackenberg, Toxicol. Appl. Pharmacol., 2010, 243, 154–166 CrossRef PubMed.
- G. Benedetti, B. van de Water and M. de Graauw, Toxicogenomics-Based Cellular Models, Academic Press, 2014 Search PubMed.
- D. Sasaki, A. Yamada, H. Umeno, H. Kurihara, S. Nakatsuji, S. Fujihira, K. Tsubota, M. Ono, A. Moriguchi, K. Watanabe and J. Seki, Biomarkers, 2011, 16, 553–566 Search PubMed.
- P. Espandiari, J. Zhang, B. A. Rosenzweig, V. S. Vaidya, J. Sun, L. Schnackenberg, E. H. Herman, A. Knapton, J. V. Bonventre, R. D. Beger, K. L. Thompson and J. Hanig, Toxicol. Sci., 2007, 99, 637–648 CrossRef PubMed.
- Y. Zhou, V. S. Vaidya, R. P. Brown, J. Zhang, B. A. Rosenzweig, K. L. Thompson, T. J. Miller, J. V. Bonventre and P. L. Goering, Toxicol. Sci., 2008, 101, 159–170 CrossRef PubMed.
- C. Gluhovschi, G. Gluhovschi, L. Petrica, R. Timar, S. Velciov, I. Ionita, A. Kaycsa and B. Timar, J. Diabetes Res., 2016, 2016, 4626125–4626137 Search PubMed.
- R. P. Miller, R. K. Tadagavadi, G. Ramesh and W. B. Reeves, Toxins, 2010, 2, 2490–2518 CrossRef PubMed.
- N. A. Santos, C. S. Catao, N. M. Martins, C. Curti, M. L. Bianchi and A. C. Santos, Arch. Toxicol., 2007, 81, 495–504 CrossRef PubMed.
- R. W. Schrier, J. Clin. Invest., 2002, 110, 743–745 CrossRef PubMed.
- İ. Durak, H. Özbek, M. Karaayvaz and H. S. Öztürk, Drug and Chemical Toxicology, 2002, 25, 1–8 CrossRef PubMed.
- R. Baliga, N. Ueda, P. D. Walker and S. V. Shah, Am. J. Kidney Dis., 1997, 29, 465–477 CrossRef PubMed.
- B. H. Ali, M. S. Al Moundhri, M. Tag Eldin, A. Nemmar and M. O. Tanira, Fundam. Clin. Pharmacol., 2007, 21, 547–553 CrossRef PubMed.
- B. C. Dickinson, V. S. Lin and C. J. Chang, Nat. Protoc., 2013, 8, 1249–1259 CrossRef PubMed.
- W. Xu, Z. Zeng, J.-H. Jiang, Y.-T. Chang and L. Yuan, Angew. Chem., Int. Ed., 2016, 55, 13658–13699 CrossRef PubMed.
- Y. Liu, K. Li, K.-X. Xie, L.-L. Li, K.-K. Yu, X. Wang and X.-Q. Yu, Chem. Commun., 2016, 52, 3430–3433 RSC.
- H. Zhang, R. Liu, J. Liu, L. Li, P. Wang, S. Q. Yao, Z. Xu and H. Sun, Chem. Sci., 2016, 7, 256–260 RSC.
- X. Chen, T. Pradhan, F. Wang, J. S. Kim and J. Yoon, Chem. Rev., 2012, 112, 1910–1956 CrossRef PubMed.
- H. Zhu, J. Fan, J. Du and X. Peng, Acc. Chem. Res., 2016, 49, 2115–2126 CrossRef PubMed.
- M. Gao, R. Wang, F. Yu and L. Chen, Biomaterials, 2018, 160, 1–14 CrossRef PubMed.
- J. Zhang, X.-Y. Zhu, X.-X. Hu, H.-W. Liu, J. Li, L.-L. Feng, X. Yin, X.-B. Zhang and W. Tan, Anal. Chem., 2016, 88, 11892–11899 CrossRef PubMed.
- F. Helmchen and W. Denk, Nat. Methods, 2005, 2, 932–940 CrossRef PubMed.
- X. Li, X. Gao, W. Shi and H. Ma, Chem. Rev., 2014, 114, 590–659 CrossRef PubMed.
- X. Yang, Y. Zhou, X. Zhang, S. Yang, Y. Chen, J. Guo, X. Li, Z. Qing and R. Yang, Chem. Commun., 2016, 52, 10289–10292 RSC.
- W. Zhang, X. Wang, P. Li, F. Huang, H. Wang, W. Zhang and B. Tang, Chem. Commun., 2015, 51, 9710–9713 RSC.
- F. Yu, M. Gao, M. Li and L. Chen, Biomaterials, 2015, 63, 93–101 CrossRef PubMed.
- R. Liu, L. Zhang, Y. Chen, Z. Huang, Y. Huang and S. Zhao, Anal. Chem., 2018, 4452–4460 CrossRef PubMed.
- J. Zhang, C. Li, R. Zhang, F. Zhang, W. Liu, X. Liu, S. M. Lee and H. Zhang, Chem. Commun., 2016, 52, 2679–2682 RSC.
- X. Han, R. Wang, X. Song, F. Yu, C. Lv and L. Chen, Biomaterials, 2018, 156, 134–146 CrossRef PubMed.
- R.-Q. Li, Z.-Q. Mao, L. Rong, N. Wu, Q. Lei, J.-Y. Zhu, L. Zhuang, X.-Z. Zhang and Z.-H. Liu, Biosens. Bioelectron., 2017, 87, 73–80 CrossRef PubMed.
- S. Ma, W. Mu, J. Gao and J. Zhou, J. Fluoresc., 2009, 19, 487–493 CrossRef PubMed.
- S. T. Manjare, S. Kim, W. D. Heo and D. G. Churchill, Org. Lett., 2014, 16, 410–412 CrossRef PubMed.
- J. J. Gao, K. H. Xu, B. Tang, L. L. Yin, G. W. Yang and L. G. An, FEBS J., 2007, 274, 1725–1733 CrossRef PubMed.
- F. Si, Y. Liu, K. Yan and W. Zhong, Chem. Commun., 2015, 51, 7931–7934 RSC.
- H. K. D. P. Murale, W. S. Choi and D. G. Churchill, Org. Lett., 2013, 15, 3946–3949 CrossRef PubMed.
- K. Y. H. Maeda, Y. Nomura, I. Kohno, L. Hafsi, N. Ueda, S. Yoshida, M. Fukuda, Y. Fukuyasu and Y. Yamauchi, J. Am. Chem. Soc., 2005, 127, 68–69 CrossRef PubMed.
- K. Xu, X. Liu, B. Tang, G. Yang, Y. Yang and L. An, Chem. –Eur. J., 2007, 13, 1411–1416 CrossRef PubMed.
- K. Xu, X. Liu and B. Tang, ChemBioChem, 2007, 8, 453–458 CrossRef PubMed.
- G. V. G. Rothe, J. Leukocyte Biol., 1990, 47, 440–448 CrossRef PubMed.
- H. Maeda, H. Matsuno, M. Ushida, K. Katayama, K. Saeki and N. Itoh, Angew. Chem., Int. Ed., 2005, 44, 2922–2925 CrossRef PubMed.
- J. J. Hu, N. K. Wong, S. Ye, X. Chen, M. Y. Lu, A. Q. Zhao, Y. Guo, A. C. Ma, A. Y. Leung, J. Shen and D. Yang, J. Am. Chem. Soc., 2015, 137, 6837–6843 CrossRef PubMed.
- D. Cheng, W. Xu, L. Yuan and X. Zhang, Anal. Chem., 2017, 89, 7693–7700 CrossRef PubMed.
- J. Zielonka, J. Joseph, A. Sikora, M. Hardy, O. Ouari, J. Vasquez-Vivar, G. Cheng, M. Lopez and B. Kalyanaraman, Chem. Rev., 2017, 117, 10043–10120 CrossRef PubMed.
- Z. Xu and L. Xu, Chem. Commun., 2016, 52, 1094–1119 RSC.
- Y. Wei, D. Cheng, T. Ren, Y. Li, Z. Zeng and L. Yuan, Anal. Chem., 2016, 88, 1842–1849 CrossRef PubMed.
- X. Xiong, F. Song, G. Chen, W. Sun, J. Wang, P. Gao, Y. Zhang, B. Qiao, W. Li, S. Sun, J. Fan and X. Peng, Chem. –Eur. J., 2013, 19, 6538–6545 CrossRef PubMed.
- C. C. Winterbourn, M. B. Hampton, J. H. Livesey and A. J. Kettle, J. Biol. Chem., 2006, 281, 39860–39869 CrossRef PubMed.
- D. Cheng, Y. Pan, L. Wang, Z. Zeng, L. Yuan, X. Zhang and Y. T. Chang, J. Am. Chem. Soc., 2017, 139, 285–292 CrossRef PubMed.
- C. A. Davis, H. S. Nick and A. Agarwal, J. Am. Soc. Nephrol., 2001, 12, 2683–2690 Search PubMed.
- A. Kuhad, N. Tirkey, S. Pilkhwal and K. Chopra, BioFactors, 2006, 26, 1–12 CrossRef.
- S. Zambrano, A. J. Blanca, M. V. Ruiz-Armenta, J. L. Miguel-Carrasco, M. Arevalo, A. Mate and C. M. Vazquez, Am. J. Hypertens., 2014, 27, 460–470 CrossRef PubMed.
- M. A. Dkhil, S. Al-Quraishy, A. M. Aref, M. S. Othman, K. M. El-Deib and A. E. Abdel Moneim, Oxid. Med. Cell. Longevity, 2013, 2013, 741817–741826 Search PubMed.
Footnotes |
| † Electronic supplementary information (ESI) available: Experimental procedures, characterization data, and additional spectra. See DOI: 10.1039/c8sc03308k |
| ‡ These authors contributed equally to this work. |
| This journal is © The Royal Society of Chemistry 2018 |

