Synthesising chain-like, interconnected Pt nanoparticles using a tubular halloysite clay template for an efficient counter electrode in dye-sensitised solar cells†
S.
Nagarajan
ab,
Sudhagar
Pitchaimuthu
 *ac and
Yong Soo
Kang
 *a
*a
aDepartment of Energy Engineering, Hanyang University, Seoul, South Korea. E-mail: Kangys@hanyang.ac.kr
bDepartment of Chemistry, Manonmaniam Sundaranar University, Tamilnadu, India
cMultifunctional Photocatalyst and Coating Group, SPECIFIC, College of Engineering, Swansea University (Bay Campus), Fabian way, Crymlyn Burrows, Swansea SA1 8EN, UK. E-mail: S.Pitchaimuthu@swansea.ac.uk; vedichi@gmail.com
First published on 16th November 2017
Abstract
We report an inexpensive fabrication route of a mesoporous counter electrode made of chain-like Pt nanoparticles using a tubular halloysite clay template. The pre-coated halloysite tubes (HTs) on a conducting substrate act as a material synthesising platform for a highly interconnected chain-like Pt nanostructure. The Pt-HT composite counter electrode shows effective electrolyte interaction and high catalytic activity towards tri-iodide reduction. As a result, Pt-HT counter electrode based dye-sensitised solar cells exhibit a higher energy conversion efficiency of 9.5% compared to the flat-type Pt film based counter electrode (8.2%) using liquid-type electrolyte.
Nanoscale catalytic substances possess high specific surface areas and surface energies, which lead to high catalytic activity. Recently, nanostructured catalyst electrodes have been of interest in several industrial applications including energy conversion, energy storage, biomedical applications, and water purification systems.1–3 Numerous synthetic routes have been proposed to prepare nanoscale catalysts physically or chemically. However, simple and low-cost synthetic routes have been ever in demand to reduce fabrication costs and avoid complex experimental procedures in the move towards large scale industrial deployment. A template-assisted method is a cutting edge chemical route for synthesising nanoscale catalysts on a large scale.4 The soft templates involved in the material syntheses offer a platform to obtain the desired morphology, selective crystalline facets, and mesoporous structures. To date, a wide range of soft templates, including organic polymers,5,6 carbon nanotubes,7 metal oxides,8 and clay,9 have been proposed. Among them, naturally available clay material is easy to handle and low-cost for large scale syntheses.
Halloysite clay [Al2Si2O5(OH)4·2H2O], a hydrated, layered aluminosilicate, is a natural mineral consisting of hollow cylinders with multiple layers and submicrometer dimensions.10 The mismatch between the oxygen-sharing tetrahedral SiO4 sheet and its adjacent octahedral AlO6 sheet drives the multi-roll wrapping and thus forms tubular shaped halloysite clay.11 These naturally available nanoscale halloysite tubes (HTs) exhibit the unique physical and chemical features of relatively high specific surface area, high porosity, and high cation-exchange capacity. Owing to their biocompatible nature, they have been widely applied in biomedical drug delivery applications.12–14 The other interesting features, such as high porosity, large surface area, and strong absorbability, make HTs promising soft templates for various applications, such as nanoparticle synthesis,9,15 water treatment,16 oil-spill recovery,17 and energy storage devices.18 Despite the advantages of HTs, less attention has been paid to them in nanoparticle synthesis because an additional process is required to separate the resultant nanoparticles from their mixture with the template. However, we can revisit the implementation of HTs in nanomaterial synthesis where the removal of the template is not necessary. For instance, pre-coated HTs on a conducting substrate can serve as a thick mesoporous scaffold for supporting spatially distributed nanoparticle synthesis. Compared to flat type nanoparticle thin film coating, these spatially distributed nanoparticles could result in high electrode/electrolyte interfaces in electrochemistry based devices. In this view, a HT clay and Pt nanoparticle coated electrode could be an appropriate choice for application as a counter electrode in dye-sensitised solar cells (DSSCs). It is anticipated that the spatially distributed HT clay framework affords a large pore channel that could act as the backbone scaffold for the spatial growth of the target Pt catalyst material compared to a conventional flat-type counter electrode. In addition, the mesoporous HT backbone scaffold may facilitate electrolyte percolation through the entire counter electrode.
The noble metal Pt has been extensively utilised as a counter electrode component in DSSCs.19 The unique features of Pt are its high catalytic activity, excellent chemical stability, and lower redox potential for tri-iodide reduction, and these therefore promote Pt as a ubiquitous electrocatalyst in DSSCs.20 In general, Pt has been applied in the form of thin films mostly 2–5 nm thick as this is enough to perform effective trioxide reduction in liquid electrolytes. The less viscous nature of the liquid electrolyte eventually results in more feasible interaction with the thin Pt surface. But, in the case of a highly viscous solid electrolyte, filling of the narrow pores in the nano-structured photoanode with redox carriers (I−/I3−) is often difficult. This could severely hinder the improvement of the overall conversion efficiency of the DSSCs. To enhance the counter electrode/solid electrolyte interfacial interactions, impregnated or mesoporous structured catalysts are introduced in DSSCs. For instance, Li et al. demonstrated a vertically grown Pt nano-grass counter electrode. It exhibited 12% higher photoconversion efficiency than a conventional flat type Pt film based counter electrode.21 Similarly, 1-D nanostructure (nanofiber, nanoflower, and nano-urchin) based Pt counter electrodes have been demonstrated in DSSCs.22–24 These reports clearly explored spatially grown or elongated Pt nanostructures promoting interfacial contact with the electrolyte. However, the complicated synthesis route and low quantity of yield often challenges their large-scale synthesis.
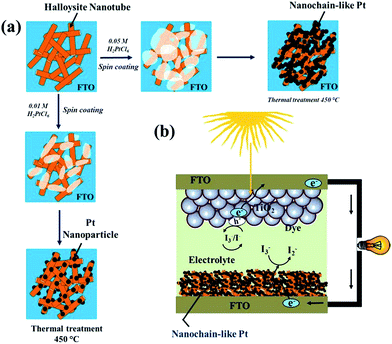
Herein, we propose a facile synthesis of chain-like Pt nanoparticles using a HT backbone template. To understand the Pt nanoparticle growth mechanism, the concentration of the Pt precursor (H2PtCl6) was varied from 0.01 to 0.05 M (see the Experimental details in ESI S1†). The different experimental stages of HT-assisted Pt nanoparticle synthesis are illustrated in Scheme 1. The Pt precursor solution was first deposited onto the HT layer pre-coated on the fluorinated tin oxide (FTO) substrate (Scheme 1a). Subsequently, this film was sintered at 450 °C and under ambient atmosphere. During the sintering process, the Pt precursor was reduced into a nanoparticle on the HT surface.
 | ||
| Scheme 1 A schematic illustration of the different experimental stages in HNT-PT composite synthesis; (b) the DSSC device architecture with a HNT-Pt counter electrode. | ||
The detailed electrocatalytic performance of the Pt-HT composite was studied and compared with a HT-free Pt film. In addition, the counter electrode performances were examined in liquid electrolyte based dye-sensitised solar cells. The schematic structure of DSSCs using a Pt-HT counter electrode is depicted in Scheme 1b. It is anticipated that the thick (∼3 micron), mesoporous Pt-HT counter electrode might allow more electrolytic species into the entire electrode geometry, thus increasing the electrode/electrolyte interfaces, compared to a flat, HT-free Pt film. In addition, the travelling distance of redox shuttle (I−/I3−) between the photoanode and counter electrode can be reduced by a thick Pt-HT counter electrode, which may support the dye-regeneration rate at the photoanode.
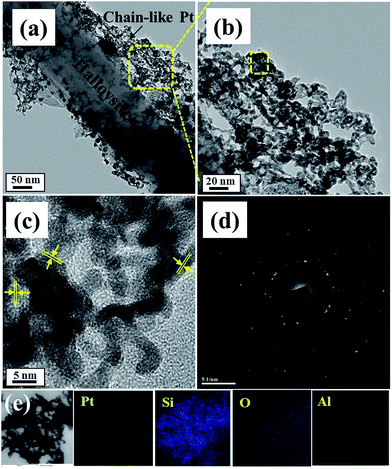
The surface morphology of the Pt-HT composite for different Pt precursor concentrations was studied by scanning electron microscopy (Fig. S2†). From Fig. S2(a)–(c)†, it is observed that the density of spatial distribution of the Pt nanoparticles directly depends on the Pt precursor concentration (Fig. S2†). At a high concentration of 0.03 M, highly interconnected chain-like Pt nanoparticles are visible in the Pt-HT sample. This reveals the influence of the Pt precursor concentration on the morphology of the Pt nanoparticle. To further understand the growth mechanism of the Pt nanoparticle onto the HT surface, we have recorded high-resolution transmission electron microscopy (HRTEM) images (Fig. 1 and S3†).
Fig. S2 and S3† show the Pt nanoparticles deposited on the HT surface. Their sizes are in the range of ∼5 nm to ∼50 nm at a low Pt precursor concentration (0.01 M). Further increasing the Pt precursor concentration (0.03 M), the size and amount of the Pt nanoparticles were increased significantly, suggesting that they may be spatially interconnected to form chain-like structures on the HT surface (Fig. 1(a) and (b)). In close proximity at the 5 nm scale (Fig. 1(c)), the lattice fringe of the Pt nanoparticles was shown to be 0.19 nm in diameter between the two lattice channels,25 implying a (101) crystalline plane of Pt. The SAED pattern (Fig. 1(d)) further endorses the highly crystalline nature of Pt. The elemental mappings for the chain-like nanoparticles are presented in Fig. 1(e). The observed Pt, Al, Si, and O elements support the chain-like particles being Pt nanocrystals. From these observations, we believe that the HT surface acts as a substrate for Pt seed layer growth, which also facilitates adjacent Pt particles to fuse into each other and thus stabilise the chain-like structure. Furthermore, the Pt precursor concentration increases to 0.05 M and the resultant Pt nanoparticles will agglomerate (Fig. S3(c)†).
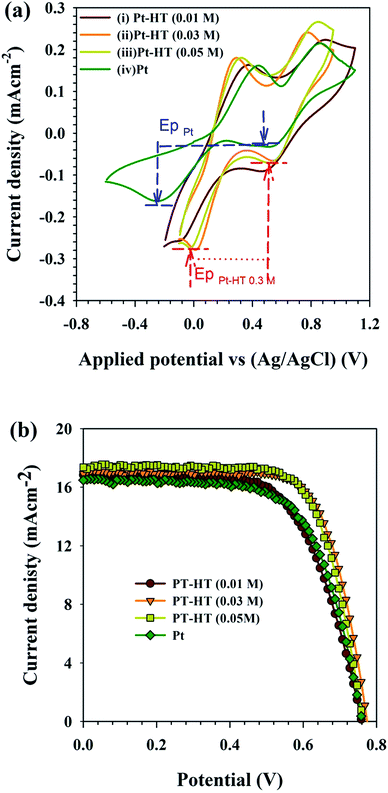
Prior to DSSC assembly, the electrocatalytic activity of the as-synthesised Pt-HT composite counter electrode was evaluated in the tri-iodide reduction reaction. The cyclic voltammetry (CV) results are presented in Fig. 2(a). The conventional Pt thin film counter electrode coated on a FTO electrode exhibited two peaks.
The peak at a lower potential ∼−0.24 V vs. Ag/AgCl is attributed to the reduction of tri-iodide.26
| I3− + 2e− ↔ 3I− | (1) |
The peak exhibited at a positive potential of ∼0.43 V vs. Ag/AgCl is associated with the oxidation reaction.
| 3I2− + 2e− → 2I3− | (2) |
A distinguished peak observed in the negative potential region ∼−0.02 V vs. Ag/AgCl of a Pt-HT (0.03 M) electrode reveals that less operating potential is adequate to drive trioxide reduction (eqn (1)), compared to the conventional Pt film. In the case of the Pt-HT (0.01 M) electrode, the reduction potential is slightly increased to −0.1 V vs. Ag/AgCl. As shown by the TEM results, the Pt-HT (0.01 M) film encompasses the lower quantity of Pt nanoparticle loading, as well as the randomly coated inhomogeneous Pt nanoparticles on the HT surface. This could result in relatively less electron conductivity and thus poorer electrocatalytic activity, compared to the Pt-HT (0.03 M) electrode. On the other hand, the Pt-HT (0.05 M) electrode with the highest Pt concentration also had poorer electrocatalytic activity, presumably due to the aggregation of the Pt nanoparticles and thus a reduced active surface area for catalytic reaction. In general, the catalytic activity of the counter electrode can be qualitatively evaluated from two parameters from the C–V plots: (a) the “peak separation” (ΔEp) and (b) the “cathodic peak current density” (IP) observed at a more negative potential. The ΔEp value is related to the kinetic redox capability of the cathode for I−/I3−. Therefore, a smaller ΔEp infers better electrocatalytic ability of the counter electrode. From Fig. 2(a), the estimated ΔEp value of the Pt-HT (0.03 M) electrode is ∼0.303 V, which is twofold lower than that of the conventional Pt film (ΔEp ∼ 0.70 V). These results imply an advantage of the Pt-HT composite as an electro-catalytic counter electrode in DSSCs.
The photovoltaic performance of the Pt-HT composite counter electrodes was characterized in dye-sensitized solar cells (DSSCs) (Scheme 1b). First, these electrodes were examined with a liquid-type electrolyte as it has less complexity for understanding the device performance. The J–V measurement results are presented in Fig. 2(b). The photovoltaic parameters derived from Fig. 2(b) are listed in Table 1. Under identical experimental conditions, the Pt-HT (0.03) counter electrode showed a higher photocurrent density of Jsc = 16.9 mA cm−2 than the other Pt-HT composite electrodes, as well as the HT-free Pt film. This enhancement can be attributed to several advantages of the Pt-HT (0.03) counter electrode, such as the high catalytic activity in tri-iodide reduction, as discussed in Fig. 2(a) and (b), and also effective electrolyte/electrolyte interaction. As a result, the Pt-HT (0.03) cell performed with a high photo conversion efficiency (PCE) of η = 9.5%, an open circuit voltage (Voc) of 0.77 V, and a fill factor (FF) of 0.72. Compared to the HT-free Pt film, the Pt-HT (0.03) composite showed 115% improvement in PCE. This is mainly ascribed to the enhancement of FF by modifying the Pt nanoparticle growth condition and the counter electrode architecture (Scheme 1b). The reproducibility of these counter electrodes was tested in three batches and the photovoltaic results were summarised in Fig. S4.† It is worth discussing how the fill factor plays a key role in determining the PCE of the device.
| Counter electrode | V oc (V) | J sc (mA cm−2) | FF | η (%) |
|---|---|---|---|---|
| Pt-HT (0.01) | 0.759 | 16.42 | 0.709 | 8.8 |
| Pt-HT (0.03) | 0.774 | 16.93 | 0.728 | 9.5 |
| Pt-HT (0.05) | 0.766 | 16.75 | 0.716 | 9.1 |
| Pt | 0.759 | 16.82 | 0.643 | 8.2 |
In general, the fill factor of the DSSCs is governed by the internal series resistance (Rse) of the device, which associates the sheet resistance of both the electrode substrates (Rsub), the charge transfer resistance at both of the electrode/electrolyte interfaces (Rct), as well as the diffusion resistance through the electrolyte (Rdiff).27,28
| Rse = Rsub + Rct + Rdiff | (3) |
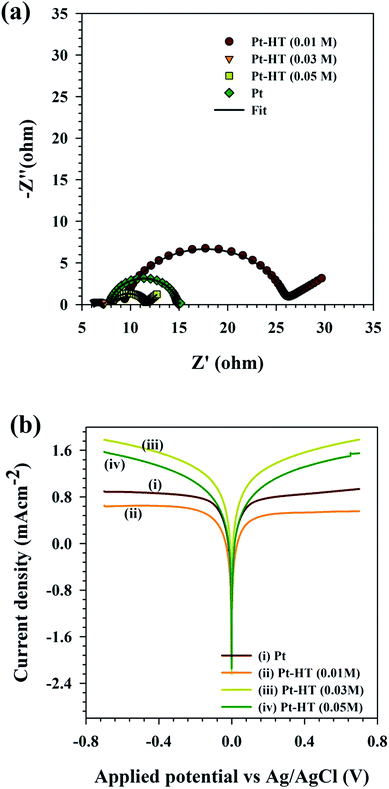
By following eqn (3), the Rct value of the counter electrode can explain the influence of its structure on the fill factor of the device. Electrochemical impedance spectroscopy is a unique tool to study the charge transfer characteristics, origin of traps, and stability of the electrode, while keeping the electrolyte unchanged.29–32 The Nyquist plots for different counter electrodes (dummy cell configuration) are obtained in a frequency range of 1 Hz to 1 MHz at 0.75 V vs. Ag/AgCl with an AC amplitude of 10 mV under AM 1.5G illumination. The Nyquist plot is further simulated with the equivalent circuit presented in Fig. S5.† In the equivalent circuit, Rs indicates the sheet resistance of the charge collector (FTO), CPE indicates the constant phase element, and Rct indicates twice the time of charge transfer resistance. Strikingly, the Pt-HT (0.03) electrode showed Rct ∼ 0.5 Ω cm−2, which is six fold lower than that of the conventional HT-free Pt film (Rct ∼ 3.5 Ω cm−2). It is clear that the chain-like Pt nanoparticles on the mesoporous HT framework promote interconnectivity between the Pt nanoparticles, which enhances the electron conductivity of the electrode and thus reduces the charge transfer resistance at the electrode/electrolyte interfaces. In accordance with eqn (1), the extremely reduced Rct value of Pt-HT (0.03 M) seems to be responsible for the high fill factor in this device. The lower loading of the Pt nanoparticles for Pt-HT (0.01 M) resulted in a high value of Rct ∼ 8.3 Ω cm−2, as expected, which slightly reduced both the Jsc and FF of the device.
The interfacial charge-transfer properties of the I3−/I− redox shuttle at different counter electrodes were studied using the Tafel plots. The Tafel plots were recorded using symmetric cell configuration (electrode/electrolyte/electrode). The resultant Tafel plots in Fig. 3(b) show that the Pt-HT (0.03) electrode showed higher exchange current density (J0) than the conventional HT-free Pt film, as well as the other Pt-HT electrodes. The higher the J0 value, the better the catalytic activity towards I3− reduction. This is in good agreement with the CV and EIS results in Fig. 2(a) and 3(a). Due to Pt-HT (0.01) showing apparently high charge transfer resistance and lower exchange current density, this results in a slightly higher photoelectric conversion efficiency than Pt. This discrepancy may arise from the difference in the experiment environment. For instance, the J–V plots were measured using the DSSC device architecture (photoanode/electrolyte/Pt). In this case, the Tafel and impedance (Nyquist) plots were obtained from a dummy cell (Pt/electrolyte/Pt).
From the above discussion, it is clear that the Pt-HT (0.03 M) electrode showed multiple advantages, such as high electrocatalytic activity, effective electrolyte interaction, and less interfacial charge-transfer resistance at the electrode/electrolyte interfaces than the conventional counter electrode of the HT-free Pt film. These results encourage further application of this counter electrode to solid-state electrolytes. It is anticipated that the mesoporous channels at the counter electrode facilitate the percolation of even a highly viscous electrolyte33 and also better interfacial contact with even a solid state electrolyte.34–38
Conclusions
In summary, we have demonstrated chain-like Pt nanoparticles using a tubular halloysite clay template. The method to prepare Pt nanoparticles grown onto a pre-coated HT clay mesoporous electrode showed a promising route for enhanced interaction between the electrolyte/counter electrode with higher electrocatalytic activity and less charge transfer resistance. This Pt-HT composite electrode can be widely applied as an anode/cathode component for energy conversion and storage devices. In addition, the generic synthesis route of highly interconnected catalytic nanoparticles can also be utilized in deriving nanoscale metal, metal oxide, metal sulphide and carbonaceous materials.Conflicts of interest
There are no conflicts to declare.Acknowledgements
S. N. would like to acknowledge the Ramalingaswami re-entry Fellowship from DBT (BT/RLF/Re-entry/40/2015), India, for supporting the PI. S. P. acknowledges the Welsh Government and European Regional Development Fund (ERDF) for partial support through the Sêr Cymru II-Rising Star Fellowship program.Notes and references
- Y. Li and G. A. Somorjai, Nano Lett., 2010, 10, 2289–2295 CrossRef CAS PubMed.
- G. G. Wallace, J. Chen, A. J. Mozer, M. Forsyth, D. R. MacFarlane and C. Wang, Mater. Today, 2009, 12, 20–27 CrossRef CAS.
- N. Sharma, H. Ojha, A. Bharadwaj, D. P. Pathak and R. K. Sharma, RSC Adv., 2015, 5, 53381–53403 RSC.
- C. R. Martin, Chem. Mater., 1996, 8, 1739–1746 CrossRef CAS.
- J. R. Capadona, O. Van Den Berg, L. A. Capadona, M. Schroeter, S. J. Rowan, D. J. Tyler and C. Weder, Nat. Nanotechnol., 2007, 2, 765–769 CrossRef CAS PubMed.
- J. Liu, T. Yang, D.-W. Wang, G. Q. Lu, D. Zhao and S. Z. Qiao, Nat. Commun., 2013, 4, 2798 Search PubMed.
- P. M. Ajayan, O. Stephan, P. Redlich and C. Colliex, Nature, 1995, 375, 564–567 CrossRef CAS.
- X. Xiao, H. Song, S. Lin, Y. Zhou, X. Zhan, Z. Hu, Q. Zhang, J. Sun, B. Yang, T. Li, L. Jiao, J. Zhou, J. Tang and Y. Gogotsi, Nat. Commun., 2016, 7, 11296 CrossRef CAS PubMed.
- E. Abdullayev, K. Sakakibara, K. Okamoto, W. Wei, K. Ariga and Y. Lvov, ACS Appl. Mater. Interfaces, 2011, 3, 4040–4046 CAS.
- E. Joussein, S. Petit, J. Churchman, B. Theng, D. Righi and B. Delvaux, Clay Miner., 2006, 40, 383 CrossRef.
- P. Yuan, P. D. Southon, Z. Liu, M. E. R. Green, J. M. Hook, S. J. Antill and C. J. Kepert, J. Phys. Chem. C, 2008, 112, 15742–15751 CAS.
- Y. Lvov, W. Wang, L. Zhang and R. Fakhrullin, Adv. Mater., 2016, 28, 1227–1250 CrossRef CAS PubMed.
- M. Hanif, F. Jabbar, S. Sharif, G. Abbas, A. Farooq, M. Aziz and J. Churchman, Clay Miner., 2016, 51, 469–477 CrossRef CAS.
- M. Liu, Y. Chang, J. Yang, Y. You, R. He, T. Chen and C. Zhou, J. Mater. Chem. B, 2016, 4, 2253–2263 RSC.
- Y. Zhang, X. He, J. Ouyang and H. Yang, Sci. Rep., 2013, 3, 2948 CrossRef PubMed.
- M. Makaremi, R. T. De Silva and P. Pasbakhsh, J. Phys. Chem. C, 2015, 119, 7949–7958 CAS.
- E. Nyankson, O. Olasehinde, V. T. John and R. B. Gupta, Ind. Eng. Chem. Res., 2015, 54, 9328–9341 CrossRef CAS.
- J. Jin, L. Fu, H. Yang and J. Ouyang, Sci. Rep., 2015, 5, 12429 CrossRef PubMed.
- A. Hagfeldt, G. Boschloo, L. Sun, L. Kloo and H. Pettersson, Chem. Rev., 2010, 110, 6595–6663 CrossRef CAS PubMed.
- S. Thomas, T. G. Deepak, G. S. Anjusree, T. A. Arun, S. V. Nair and A. S. Nair, J. Mater. Chem. A, 2014, 2, 4474–4490 CAS.
- L.-L. Li, C.-W. Chang, H.-H. Wu, J.-W. Shiu, P.-T. Wu and E. Wei-Guang Diau, J. Mater. Chem., 2012, 22, 6267–6273 RSC.
- T.-L. Hsieh, H.-W. Chen, C.-W. Kung, C.-C. Wang, R. Vittal and K.-C. Ho, J. Mater. Chem., 2012, 22, 5550–5559 RSC.
- V.-D. Dao and H.-S. Choi, ACS Appl. Mater. Interfaces, 2016, 8, 1004–1010 CAS.
- H. Seo, M. Shiratani, K. Seneekatima and R. Pornprasertsuk, J. Nanosci. Nanotechnol., 2016, 16, 3332–3337 CrossRef CAS.
- T.-T. Duong, J.-S. Choi, A.-T. Le and S.-G. Yoon, J. Electrochem. Soc., 2014, 161, H166–H171 CrossRef CAS.
- P. Sudhagar, S. Nagarajan, Y.-G. Lee, D. Song, T. Son, W. Cho, M. Heo, K. Lee, J. Won and Y. S. Kang, ACS Appl. Mater. Interfaces, 2011, 3, 1838–1843 CAS.
- L. Y. Han, N. Koide, Y. Chiba, A. Islam, R. Komiya, N. Fuke, A. Fukui and R. Yamanaka, Appl. Phys. Lett., 2005, 86, 213501–213503 CrossRef.
- J. Bisquert and I. Mora-Sero, J. Phys. Chem. Lett., 2010, 1, 450–456 CrossRef CAS.
- T. Lopes, L. Andrade, F. Le Formal, M. Gratzel, K. Sivula and A. Mendes, Phys. Chem. Chem. Phys., 2014, 16, 16515–16523 RSC.
- T. Lopes, L. Andrade, H. A. Ribeiro and A. Mendes, Int. J. Hydrogen Energy, 2010, 35, 11601–11608 CrossRef CAS.
- P. Sudhagar, A. Devadoss, K. Nakata, C. Terashima and A. Fujishima, J. Electrochem. Soc., 2015, 162, H108–H114 CrossRef CAS.
- C. Y. Lee, L. Wang, Y. Kado, M. S. Killian and P. Schmuki, Chemsuschem, 2014, 7, 934–940 CrossRef CAS PubMed.
- D. Song, W. Cho, J. H. Lee and Y. S. Kang, J. Phys. Chem. Lett., 2014, 5, 1249–1258 CrossRef CAS PubMed.
- W. S. Chi, J. W. Han, S. Yang, D. K. Roh, H. Lee and J. H. Kim, Chem. Commun., 2012, 48, 9501–9503 RSC.
- A. Apostolopoulou, A. Margalias and E. Stathatos, RSC Adv., 2015, 5, 58307–58315 RSC.
- M.-S. Kang, J. H. Kim, Y. J. Kim, J. Won, N.-G. Park and Y. S. Kang, Chem. Commun., 2005, 889–891, 10.1039/b412129p.
- E. Ramasamy and J. Lee, Chem. Commun., 2010, 46, 2136–2138 RSC.
- W. Cho, Y. R. Kim, D. Song, H. W. Choi and Y. S. Kang, J. Mater. Chem. A, 2014, 2, 17746–17750 CAS.
Footnote |
| † Electronic supplementary information (ESI) available: Experimental details, SEM, TEM, and equivalent circuit. See DOI: 10.1039/c7se00292k |
| This journal is © The Royal Society of Chemistry 2018 |


