Reassessing the bulk ionic conductivity of solid-state electrolytes†
Md-Jamal
Uddin
and
Sung-Jin
Cho
 *
*
Joint School of Nanoscience and Nanoengineering, North Carolina A&T State University, Greensboro, NC 27401, USA. E-mail: scho1@ncat.edu; Tel: +1-336-285-2857
First published on 9th May 2018
Abstract
The ionic conductivity of solid-state electrolytes is a crucial factor for futuristic battery applications. It is measured via the bulk resistance of the pellet, which not only depends on the properties of the materials but also on the physical parameters including frequency. It is shown in this study that the high-frequency point affects the ionic conductivity more than other variables. With a growing number of solid-state battery studies, we believe that now is the time to establish a common standard to measure ionic conductivity of the solid-state electrolytes for Li-ion batteries.
Solid state electrolytes (SSEs) are considered to be the most promising solution to the high energy density requirements for next-generation Li-ion batteries (LIB). Most SSEs have high dimensional and electrochemical stability, which provide the necessary safety and energy density, but the main challenge is the low ionic conductivity.1,2 The fast ion conductivity has been the core of SSE research for LIB for the past few years (Fig. 1). There have been few reports on SSEs, namely, Li10GeP2S12 (∼10−2 S cm−1)3 and the garnet-type4 Li7La3Zr2O12 (∼10−3 S cm−1), which have superionic conductivity. However, we believe that there are still unanswered questions that need to be addressed before going into the next stage of SSE research.
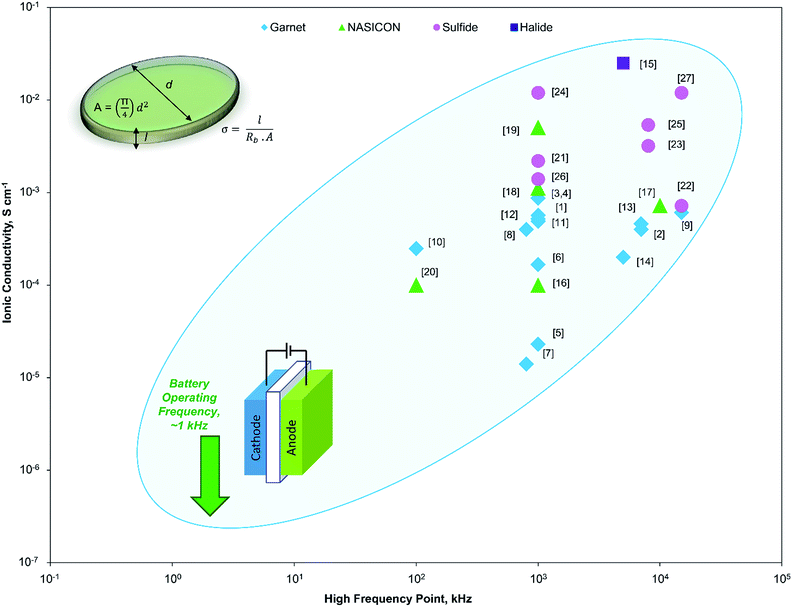 | ||
| Fig. 1 Variation in the high frequency point in impedance spectroscopy measurements by different published works and their corresponding ionic conductivities (the corresponding works are marked with the reference number as shown in Table S1 from ESI†). All the reported works have used much higher frequency than the practical battery testing frequency of 1 kHz (marked with a down arrow). | ||
The ionic conductivity of SSEs depends on many factors including the materials and physical parameters.1–5 Among the properties of the materials, efforts have been made to improve the ionic conductivity by tuning the lattice parameter, particle size, and relative density. Physical parameters include temperature, relaxation time, and frequency. In the previous literature, the focus was almost exclusively given on the material properties. Table S1† provides a list of some of these studies that have measured the ionic conductivities of SSEs. However, the range of such measured ionic conductivities is quite large. As has been established by the previous studies, the ionic conductivity of SSE indeed depends on the lattice parameter, particle size, and relative density. However, the effects of the physical parameters are often ignored. While the structure of SSEs and their basic mechanism of ionic conduction is studied more rigorously,6–11 the effect of different variables such as temperature, relaxation time, and frequency on the ionic conductivity is often ignored. Herein, we want to draw attention to the variations of high-frequency points used in the impedance spectroscopy setup to calculate the ionic conductivity.
The ionic conductivity of solid state electrolytes is usually calculated using electrochemical impedance spectroscopy by analyzing the Nyquist plot. A typical simple equivalent circuit of (Rbulk)(RgbQgb)(Qelectrode) gives the bulk resistance from the starting point of the semicircle, which is the high-frequency point.5 From that bulk resistance (Rb), the ionic conductivity (σ) is calculated by using the equation σ = d/(Rb × A), where d is the thickness, and A is the area of the solid electrolyte pellet.
In previous studies, different high-frequency points (HFPs) have been adopted in different researches (Fig. 1). More importantly, the variation of the ionic conductivity is quite high (sometimes even an order) depending on the high frequency. Even for the same SSE by the same research group, a completely different HFP is sometimes used. There is no set standard for HFP and other parameters used in the impedance spectroscopy for SSE ionic conductivity measurements. Different researchers use different frequencies without considering that the high-frequency point could play a role in the ionic conductivity measurement. More importantly, HFP, which is used to calculate the ionic conductivity in these studies, is much higher than the practical battery testing condition of 1 kHz.
The effect of frequency on the ionic conductivity is a common study in solid-state physics research.12–14 The ac conductivity of the dielectric material is primarily a function of frequency. According to the Debye–Falkenhagen theory,15 the conductance is a complex function where each of the terms also depend on frequency (ω). Further derivation leads to the conductance dispersion being centered around a critical frequency.16 Thus, the frequency-dependent conductivity is σ′(ω) = σ[1 + (ω/ωC)n], where σ is the ionic conductivity, ω is the angular frequency, ωC is the critical frequency, and the value of n is usually 0 < n < 1.
Although the frequency dependence of the ac conductivity of dielectric materials is an interesting field, its exact mathematical formulation does not pose enough importance for the ionic conductivity measurements of solid-state electrolytes in lithium-ion batteries because of the ion-blocking model of electrochemical impedance spectroscopy (EIS) measurements.17–19 For the ionic conductivity measurements in SSE assuming a typical (Rbulk)(RgbQgb)(Qelectrode) equivalent circuit, we only consider the bulk resistance of the pellet, which occurs at the starting point of the semi-circle at the high-frequency zone. Therefore, the HFP in EIS measurements can mostly affect the bulk resistance and thereby the ionic conductivity.
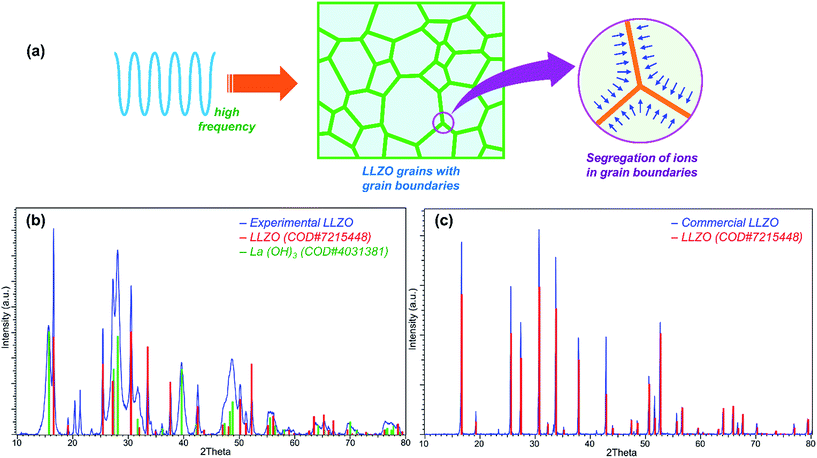
When the frequency is varied from low to high, the actual physical phenomenon in the material that affects the ionic conductivity varies. For dielectric materials, the high frequency possibly causes some effect on the grain boundaries.20 When the frequency is high enough, it might cause the segregation of some ions in the grain boundary (Fig. 2a), which is similar to the segregation of Si in Y2O3-stabilized zirconia.21
In this study, we have varied HFP in EIS from 1 kHz to 7 MHz keeping the lower side at 10 Hz, and we have recorded the corresponding bulk resistance and ionic conductivity of the Li7La3Zr2O12 solid electrolyte. We have also studied the effects of relaxation time and temperature on the high-frequency point variations. We have found that HFP affects the ionic conductivity significantly; the ionic conductivity varies as a function of HFP, and the real (true) conductivity at 1 kHz HFP is much lower than typical >1 MHz HFP.
Results and discussion
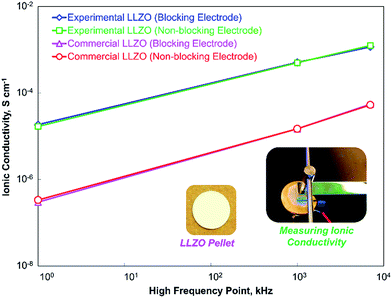
To study the effect of the high-frequency point on ionic conductivity of the solid electrolyte, we have employed two Li7La3Zr2O12 (LLZO) – one commercial (phase pure, from Toshima, Japan) and one experimentally synthesized by low-temperature single-step calcination after spray drying (details in Experimental section). The XRD pattern of commercial LLZO (Fig. 2c) shows that the material is the Garnet cubic phase of LLZO, and the result can be matched with the crystallographic open database, COD# 7215448. On the other hand, the experimental LLZO is a mixture of two different phases, as shown in the XRD pattern (Fig. 2b). Fig. 2b confirms that the cubic phase of LLZO – the Al-doped LLZO (COD# 7215448), along with another phase – La(OH)3 (COD# 4031381) is present in the experimental LLZO. Previous studies have shown that the tetragonal phase of LLZO usually results in certain splitting of the peaks, especially in the 2θ range of 25° to 60°.17,22 The absence of splitting in the peaks of the experimental pattern confirms that the material is in the cubic phase. The existence of the cubic phase in low-temperature calcination, such as in 900 °C, is very rare; however, it is not uncommon.23 The low-temperature calcination may also be responsible for the other major phase La(OH)3 found in the structure. There are also a few minor peaks at 19–22°, which may have been produced by excess lithium content added to remedy the lithium loss during calcination.10,24The effect of HFP is shown in Fig. 3. For all of the measurements, the low-frequency point was 10 Hz. For the experimental LLZO, for a typical EIS measurement with lithium blocking electrode at the 1 MHz to 10 Hz range, the ionic conductivity was found to be 4.8 × 10⁻⁴ S cm−1. However, at 7 MHz to 10 Hz, the ionic conductivity increased to 1.2 × 10⁻³ S cm−1, which was the highest ionic conductivity found at room temperature. For a typical battery testing system, the maximum frequency supplied is usually ∼1 kHz. For such a case, the measurement (1 kHz to 10 Hz) shows an ionic conductivity of 2.2 × 10⁻⁵ S cm−1. When we used the non-ion blocking lithium electrode in an Argon environment, we found a similar trend, which showed that (Fig. 3) the ionic conductivity increased with the increasing HFP. The same trend was also seen with the commercial LLZO with or without the lithium ion-blocking electrode in air and argon environments, respectively. The experimental LLZO showed higher ionic conductivity compared to the commercial one, which was probably because of its nanosize that helped compacting the pellet (Fig. S1†). Nonetheless, the increase was almost linear in a log–log plot. If given a chance to increase the high frequency even further, it could lead to the critical highest point of ionic conductivity, which was out of the range of our instrument. All in all, the ionic conductivity at the practical operating condition of the battery (1 kHz) was quite low. Given that high ionic conductivity occurs at a higher frequency, as shown in Fig. 3 (our work) and Fig. 1 (previous works), one might suggest the use of higher frequency for battery operation. However, that would be realistically impossible because of the technical issues involved in generating such high frequency (1000 times more), which include excessive noise, probable burn-out of the system and ultimately, high cost. We thus need to find another way of solving this issue.
Another important parameter for dielectric materials is their relaxation time.25 Since the actual variation of relaxation time with frequency is complicated and out of scope in our case, we have studied the effect by measuring the bulk resistance at a constant interval of time using different HFPs. The result is plotted in Fig. 4. Measurements are taken at 1 min intervals for 10 min, after which 2 more data points are taken at 10 min intervals. Three different HFPs are used: 7 MHz, 1 MHz, and 1 kHz, and 30 min of wait time is given in between the measurements at different HFPs. Fig. 4a shows that at a lower value of HFP, bulk resistance decreases with time within our observed window of time, and Fig. 4b shows the percentage change in bulk resistance after 30 min. The impedance measurements are more sensitive at a lower value of HFP. Hence, it is important to set a specific time interval in each HFP of EIS measurements if we want the results to be reproducible.
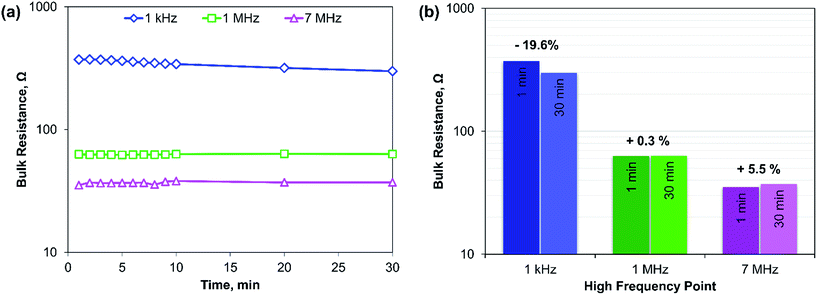 | ||
| Fig. 4 (a) Effect of relaxation time on the conductivity measurement at different HFL, (b) amount changes of bulk resistance in a bar chart with time at different HFPs. | ||
Finally, to see the effect of temperature, measurements were taken at different temperatures and at different HFPs. The ionic conductivity of the commercial LLZO pellet at different temperatures was measured with each HFP and was plotted in an Arrhenius plot (Fig. 5a). The activation energy (Ea) of conductivity can be calculated from the Arrhenius equation σT = A![[thin space (1/6-em)]](https://www.rsc.org/images/entities/char_2009.gif) exp(−Ea/kT), where σ is the conductivity at temperature T, A is a given constant, Ea is the activation energy, and k is the Boltzmann constant. Fig. 5b shows the Arrhenius plot of our experimental LLZO with same HFPs. Overall, Fig. 5 shows that the activation energy is lower at a higher value of HFP. With a lower value of HFP, the ionic conductivity decreases.
exp(−Ea/kT), where σ is the conductivity at temperature T, A is a given constant, Ea is the activation energy, and k is the Boltzmann constant. Fig. 5b shows the Arrhenius plot of our experimental LLZO with same HFPs. Overall, Fig. 5 shows that the activation energy is lower at a higher value of HFP. With a lower value of HFP, the ionic conductivity decreases.
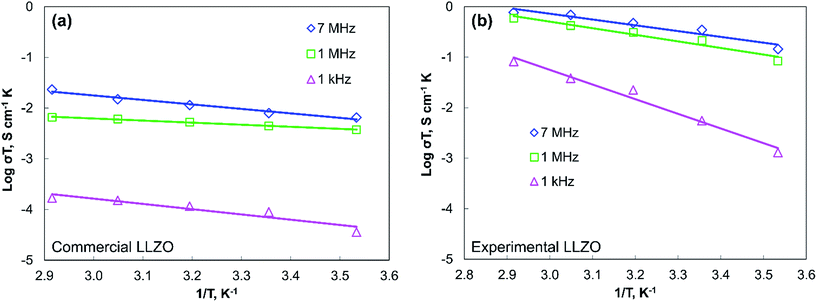 | ||
| Fig. 5 Arrhenius plots of (a) commercial LLZO and (b) experimental LLZO at different HFL; the activation energy is highest for a practical battery operation frequency of ∼1 kHz. | ||
The reduced value of activation energy and high ionic conductivity of the LLZO pellet at higher HFP suggests that the physical phenomenon occurring inside LLZO due to high frequency helps the ion conduction (Fig. 2a). The knowledge of the exact nature of such physical phenomenon requires further studies. However, as a possible hypothesis, we can say that the high frequency might help induce segregation of some entity in the grain boundaries similar to the Si segregation in Y2O3, which could have helped to increase the ion mobility and thus the ion conduction.5,26
Conclusions
Ionic conductivity and bulk resistance of LLZO solid electrolytes have shown strong dependency on the high-frequency point, relaxation time, and temperature. Within the reported range, the ionic conductivity increases as the high-frequency point increases. Moreover, the effect is quite large compared to the effects of other material properties such as lattice parameters, particle size, density, etc. This effect is found to be independent of the crystallinity or the purity of the LLZO solid electrolyte as well as the blocking or non-blocking electrode and the environment used. This helps understand why the reported ionic conductivities in previous research studies are not comparable to each other. At practical frequency (∼1 kHz) of the real battery system, the ionic conductivity is quite low. Thus, the current scenario of ionic conductivity measurement is very unclear; we need to rethink about the effect of high-frequency point on the ionic conductivity of the real battery operation. Due the growing volume of SSE research, we need to find a common standard to measure the ionic conductivity of solid-state electrolytes.Conflicts of interest
There are no conflicts to declare.Acknowledgements
The authors gratefully acknowledge the financial support from the Ministry of Trade, Industry & Energy, Republic of Korea (10080314). The authors also acknowledge support from Joint School of Nanoscience and Nanoengineering, a member of Southeastern Nanotechnology Infrastructure Corridor (SENIC) and National Nanotechnology Coordinated Infrastructure (NNCI), which is supported by the National Science Foundation (ECCS-1542174).References
- L. Cheng, C. H. Wu, A. Jarry, W. Chen, Y. Ye, J. Zhu, R. Kostecki, K. Persson, J. Guo, M. Salmeron, G. Chen and M. Doeff, ACS Appl. Mater. Interfaces, 2015, 7, 17649–17655 Search PubMed.
- J. G. Kim, B. Son, S. Mukherjee, N. Schuppert, A. Bates, O. Kwon, M. J. Choi, H. Y. Chung and S. Park, J. Power Sources, 2015, 282, 299–322 CrossRef.
- N. Kamaya, K. Homma, Y. Yamakawa, M. Hirayama, R. Kanno, M. Yonemura, T. Kamiyama, Y. Kato, S. Hama, K. Kawamoto and A. Mitsui, Nat. Mater., 2011, 10, 682–686 CrossRef PubMed.
- V. Thangadurai, S. Narayanan and D. Pinzaru, Chem. Soc. Rev., 2014, 43, 4714 RSC.
- J. van den Broek, S. Afyon and J. L. M. Rupp, Adv. Energy Mater., 2016, 6, 1600736 CrossRef.
- M. D. Ingram, P. Maass and A. Bunde, Berichte der Bunsengesellschaft für Phys. Chemie, 1991, vol. 95, pp. 1002–1006 Search PubMed.
- A. Chandra and B. Bagchi, J. Chem. Phys., 2000, 112, 1876–1886 CrossRef.
- R. A. McKee, Solid State Ionics, 1981, 5, 133–136 CrossRef.
- J. Salardenne, Appl. Phys. A: Solids Surf., 1993, 57, 61–65 CrossRef.
- R. H. Chen, C. S. Shern and T. Fukami, J. Phys. Chem. Solids, 2002, 63, 203–212 CrossRef.
- I. Płowaś, J. Świergiel and J. Jadzyn, Electrochim. Acta, 2015, 178, 511–516 CrossRef.
- M. Wien, Ann. Phys., 1928, 85, 795 CrossRef.
- M. Wien, Ann. Phys., 1927, 388, 327–361 CrossRef.
- P. Debye and H. Falkenhagen, Dispersion of the Conductivity and Dielectric Constants of Strong Electrolytes, Phys. Z., 1928, 29, 121 Search PubMed.
- J. E. Anderson, J. Non-Cryst. Solids, 1994, 172–174, 1190–1194 CrossRef.
- Y. D. Kolekar, L. Sanchez, E. J. Rubio and C. V. Ramana, Solid State Commun., 2014, 184, 34–39 CrossRef.
- R.-J. Chen, M. Huang, W.-Z. Huang, Y. Shen, Y.-H. Lin and C.-W. Nan, Solid State Ionics, 2014, 265, 7–12 CrossRef.
- J. Tan and A. Tiwari, Electrochem. Solid-State Lett., 2012, 15, A37 CrossRef.
- J. Wolfenstine, E. Rangasamy, J. L. Allen and J. Sakamoto, J. Power Sources, 2012, 208, 193–196 CrossRef.
- P. Mondal, Solid State Ionics, 1999, 118, 331–339 CrossRef.
- C. Yu, S. Ganapathy, E. R. H. V. Eck, H. Wang, S. Basak, Z. Li and M. Wagemaker, Nat. Commun., 2017, 8, 1086 CrossRef PubMed.
- I. Kokal, M. Somer, P. H. L. Notten and H. T. Hintzen, Solid State Ionics, 2011, 185, 42–46 CrossRef.
- Y. Shimonishi, A. Toda, T. Zhang, A. Hirano, N. Imanishi, O. Yamamoto and Y. Takeda, Solid State Ionics, 2011, 183, 48–53 CrossRef.
- S. Das and A. Ghosh, Electrochim. Acta, 2015, 171, 59–65 CrossRef.
- L. Cheng, J. S. Park, H. Hou, V. Zorba, G. Chen, T. Richardson, J. Cabana, R. Russo and M. Doeff, J. Mater. Chem. A, 2014, 2, 172–181 Search PubMed.
- R. Murugan, V. Thangadurai and W. Weppner, Angew. Chem., Int. Ed., 2007, 46, 7778–7781 CrossRef PubMed.
Footnote |
| † Electronic supplementary information (ESI) available. See DOI: 10.1039/c8se00139a |
| This journal is © The Royal Society of Chemistry 2018 |

