Comprehensive insights into cellulose structure evolution via multi-perspective analysis during a slow pyrolysis process†
Jiajin
Liang
 ab,
Jiao
Chen
ab,
Shubin
Wu
ab,
Jiao
Chen
ab,
Shubin
Wu
 *a,
Chao
Liu
ac and
Ming
Lei
a
aState Key Laboratory of Pulp and Paper Engineering, South China University of Technology, Guangzhou 510640, PR China. E-mail: shubinwu@scut.edu.cn
bGraduate School at Shenzhen, Tsinghua University, Shenzhen 518055, PR China
cKey Laboratory of Energy Thermal Conversion and Control of Ministry of Education, School of Energy and Environment, Southeast University, Nanjing, 210096, P. R. China
First published on 10th July 2018
Abstract
Comprehensive understanding of cellulose pyrolysis is critical to valuable chemical and liquid fuel generation in biomass-based biorefining processes. Herein, a specific tubular reactor was designed to observe the cellulose appearance alteration corresponding to the chemical structure evolution in various pyrolysis stages. The appearance of cellulose changed from white powder to light brown powder below 300 °C as its crystal lattice thermal expansion and the degree of crystallinity decrease. Cellulose began to depolymerize at 300 °C accompanied with the dehydration of pinacol and primary product levoglucosan generation. 325–350 °C was the critical pyrolysis stage for cellulose. The intermediate state was formed accompanied with a series of thermochemical reactions. All the typical signals from FTIR, 13C CP/MAS NMR disappeared when the temperature was up to 350 °C. The percentages of C, H, and O conversion to the volatile products were up to 35%, 55% and 60%, respectively, along with β-1,4-glycosidic bond cleavage, decarboxylation, and decarbonylation reactions. Meanwhile, CO2, CO, and CH4 were measured using a thermogravimetric analyzer coupled with a Fourier transform infrared spectrometer (TG-FTIR) in the slow pyrolysis process. The increasing C/H and C/O ratios in the carbonation stage enhanced the aromaticity of biochar. Furthermore, electron paramagnetic resonance (EPR) analysis indicated that it tended to form carbon-centered radicals.
1. Introduction
To develop a new sustainable energy technology for overcoming the challenge of fossil fuel depletion and environmental protection, biomass is the ideal renewable source to achieve these objectives. Pyrolysis, as an appealing thermochemical conversion technology for renewable liquid fuel and chemical production from lignocellulosic biomass, has attracted widespread interest.1,2 The quality of the liquid fuel and the value of the chemicals are dependent upon the kinds of molecules produced during the pyrolysis process. It is well known that cellulose (40–50 wt%), hemicellulose (25–35 wt%), and lignin (16–33 wt%) are the building blocks of lignocellulosic biomass.3 Cellulose, the most principal component of lignocellulose, plays a critical role in biomass utilization.4 The abundant hydroxyl group (–OH) of cellulose generally leads to high moisture content and a low calorific value of bio-oil derived from biomass pyrolysis.5 The simple composition and structure of cellulose (glucose units linked by β-1,4-glycosidic bonds) suggests that cellulose has potential to enrich chemicals via pyrolysis. In current practice, the complexity of pyrolysis chemistry has been a barrier to achieve this goal.6 Thus, understanding the fundamental mechanisms of cellulose pyrolysis deeply is important.Thermogravimetric analysis (TGA) has been frequently used to predict the pyrolysis behavior and develop kinetic models of cellulose pyrolysis. Several related kinetic models have been established and developed under various experimental conditions, but no actual consensus was obtained. The main dispute is that the primary formation of intermediate species (often called “active cellulose”) accompanied phase change phenomena.7 Recently, the intermediate liquid phase has been observed by high-speed photography technology at the beginning of cellulose pyrolysis.8,9 However, it is difficult to record this phase change phenomenon during the conventional pyrolysis process and in the amplification test. The present study indicated that the intermediate species were obtained under strict conditions which included an extremely high heating rate and the effect of heat and mass transfer can be ignored.8–10 For the kinetic model study, it has tended to focus on the global chemical process of cellulose pyrolysis behavior, rather than the detailed decomposition pathways and resulting chemical speciation. Meanwhile, it was also hard to evaluate the apparent morphology and chemical structure evolution of cellulose pyrolysis by TG analysis conducted using the thermogravimetric analyzer.
Beside the kinetic model study, the mechanisms of cellulose pyrolysis have been widely researched. The three different schools of thought about the cellulose pyrolysis products are whether they are formed via a free radical mechanism,11 a concerted mechanism,12 or an ionic mechanism.3,13 Most reaction pathways were inferred based on the final liquid products and gas products.14 The research on the relationship among the solid, liquid, and gaseous pyrolysis products during the cellulose pyrolysis process has not comprehensively discussed yet. The intermediate species generated from the cellulose pyrolysis process was not fully investigated. Many scientific questions on the chemical reaction mechanism in the cellulose pyrolysis process still need to be answered.
The aim of this study was to comprehensively understand the slow cellulose pyrolysis focusing on the solid, liquid, and gaseous pyrolysis products' co-evolution process. TG-FTIR was carried out to track the structural evolution of volatile products and the gaseous product releasing properties in real-time during the slow cellulose pyrolysis process. To clarify the cleavage mechanism of the key chemical bonds and the main functional group evolution, a specific tubular reactor was designed to observe the cellulose appearance alteration corresponding to the chemical structure evolution in various pyrolysis stages. Their evolution properties were analyzed via X-ray diffraction (XRD), FTIR, 13C CP/MAS NMR, electron paramagnetic resonance (EPR), and elemental analysis simultaneously. The liquid products obtained in different pyrolysis stages were discussed in depth. It is valuable for the regulation of high quality bio-oil generation and the development of advanced chemical preparation technology.
2. Experimental section
2.1 Materials
Cellulose (CAS: 9004-34-6, C6288) was purchased from Sigma-Aldrich. Methanol (HPLC grade, >99.99%) was purchased from Aladdin Industrial Inc. The stable free-radical 2,2-diphenyl-1-picryl-hydrazyl-hydrate (DPPH) was obtained from Tokyo chemicals Ind.2.2 TG-FTIR
To gain insight into the evolution of volatile products released from the cellulose pyrolysis, a real time TG-FTIR experiment was carried out to track the alteration of functional groups during the decomposition process. A STA449C F3 thermo analyzer (NETZSCH, Germany) coupled with a TENSOR 27 Fourier transformation infrared spectrometer (Bruker, Germany) was used in this study. The transfer line and gas cell were set 180 °C to minimize the change of evolved gas. High-purity nitrogen (99.999%) was used as the carrier gas for both the TGA and spectrometer with a flow rate of 20 mL min−1. The spectrometer used a mercury tin telluride (MCT) detector. To reduce the level of baseline noise, liquid nitrogen was used for cooling the detector. For a typical run approximately 20 mg cellulose was used. The trial under nitrogen was carried out from 40 °C to 500 °C with a heating rate of 20 °C min−1 and finally holding for 30 min at 500 °C. The number of scans per spectrum was set as 50 times per min, and the spectral region was set as 4000–650 cm−1.2.3 Pyrolysis in a tubular reactor
For the purpose of better tracking the cellulose structure evolution especially the solid phase product (char) alteration, the thermal degradation of cellulose was investigated in a specific self-designed tubular reactor. The slow pyrolysis experiment was carried out ranging from ambient temperature to 500 °C at atmospheric pressure, typically in a N2 regime. The whole pyrolysis process lasted about 130 min. The gas flow rate of 0.02 m3 h−1 was designed to transfer the volatile products derived from cellulose pyrolysis to the condensed product collection unit. The schematic of the self-designed pyrolysis device is depicted in ESI Fig. 1.† The diameter of the quartz tube is 38 mm. Initially, a series of quartz baskets with a diameter and a height of 16 mm were hung in the centre of the reactor. About 150 mg sample was loaded into each quartz basket prior to the pyrolysis experiment. In the slow pyrolysis process, when the reactor reached the desired temperature (150, 200, 250, 300, 325, 350, 400, and 500 °C), one of the quartz baskets was rapidly lifted away from the central reaction zone. These solid products obtained at various temperatures stayed at the top of the quartz tube firstly during the pyrolysis process. The top of the quartz tube was at the periphery of the reactor and the highest temperature was below 100 °C in the whole pyrolysis process. Moreover, the samples were under the N2 atmosphere, which could prevent the samples from being oxidized and further reaction. At the end of the experiment, the solid products were collected and kept in a dryer for further analysis. The mass loss of the solid product was recorded. The composition and characteristic alteration of these solid products were investigated by elemental analysis, XRD, FTIR, 13C CP/MAS NMR, and EPR comprehensively. Simultaneously, the collected condensable volatile products in various pyrolysis temperature zones (30–300 °C, 300–325 °C, 325–350 °C, 350–400 °C, and 400–500 °C) were detected to clarify the releasing rule of the molecular products. The condensable volatile products were absorbed by methanol, set at a constant volume of 25 mL and finally identified by gas chromatography/mass spectrometry (GC/MS).2.4 Analytical methods
The elemental analysis was performed on an elemental analyzer (Vario EL, Elementar, Germany) in CHNS mode. The content of O was calculated by subtraction. The formula was as follows:| O% = 100% − C% − H% − N% − S% − ash% |
The semi-quantitative analysis of FTIR was carried out on a Nicolet iS50 spectrometer equipped with a DTGS detector (Thermo Nicolet Corporation). The solid products obtained at various temperatures were mixed with KBr with a 1/50 mass ratio. The mixture was ground, then 0.1 g of sample was weighed to press into a lamellar form for analysis. The spectra were collected at a spectral resolution of 4 cm−1 ranging from 4000 to 400 cm−1. The method of 13C CP/MAS NMR for the solid product (char) analysis was reported in our previous work.15 The crystallinity of solid products was determined by X-ray diffraction using a Bruker D8-ADVANCE (Germany) with Cu radiation (k = 0.15418 nm) and Ni-filtered. The scattering angle was from 4–50° in steps of 0.04°/2θ at time intervals of 0.2 s. The crystalline index (CrI) was calculated with the following equation proposed by Segal et al.,16
I 002 denotes the scattered intensity at the main peak around 22.5°. Iam denotes the intensity of diffraction in the same units at 2θ = 18°.
EPR is a spectroscopic technique used to detect species having one or more unpaired electrons.17 The solid samples were conducted on a Bruker EA 200 EPR spectrometer operating at approximately 9.4 GHz (X-band). Sixty mg of the solid sample was loaded into the NMR sample tube. The typical parameters were: sweep width of 200 G, EPR micro-wave power of about 9.7 mW, modulation amplitude of 1 G, time constant of 5.12 ms, conversion time of 20.00 ms, sweep time of 20.48 s, signal gain of 100, and scan number of 1. The DPPH was used as a standard for the quantitative analysis of the free radical concentration of biochar, which was calculated as the double-integrated intensity of the EPR spectrum.
The identification of condensable volatile products was carried out by GC/MS. The temperature of the GC/MS interface was 240 °C. A column HP-INNOWAX Polyethylene glycol (30 m × 0.25 mm, i.e., film thickness 0.25 μm) was used. The flow rate of carrier gas (He) was 1.00 mL min−1 and the split ratio was 1![[thin space (1/6-em)]](https://www.rsc.org/images/entities/char_2009.gif) :
:![[thin space (1/6-em)]](https://www.rsc.org/images/entities/char_2009.gif) 1. The temperature programming was typically: 50 °C initial temperature; held for 1 min → heating rate of 10 °C min−1 → 62 °C; heating rate of 4 °C min−1 → 120 °C intermediate temperature; heating rate of 8 °C min−1 → 240 °C, with a final hold time of 30 min. The mass range of m/z 20–500 was scanned. The products were identified using the NIST Library.
1. The temperature programming was typically: 50 °C initial temperature; held for 1 min → heating rate of 10 °C min−1 → 62 °C; heating rate of 4 °C min−1 → 120 °C intermediate temperature; heating rate of 8 °C min−1 → 240 °C, with a final hold time of 30 min. The mass range of m/z 20–500 was scanned. The products were identified using the NIST Library.
3. Results and discussion
3.1 The thermogravimetric characteristics of cellulose and its appearance alteration during the slow pyrolysis process
The thermogravimetric characteristics of cellulose were investigated by TG-FTIR and using a specific self-designed tubular reactor, respectively. As Fig. 1 depicts, the thermogravimetric (TG) curves of cellulose pyrolysis obtained from the thermogravimetric analyzer and tubular reactor matched well, although their heating rates were different. Below 300 °C, dehydration process of cellulose pyrolysis occurred, and the mass of cellulose decreased slightly. In this stage, the appearance of cellulose changed significantly as the pyrolysis temperature increased. The color of cellulose deepened gradually, from white (raw material) to faint yellow (250 °C) to light brown (300 °C) powder. This alteration indicated that the structure of cellulose was changed and the degree of crystallinity was decreased. The XRD spectra of cellulose discussed later confirmed this result. Both the thermogravimetric analyzer and tubular reactor experiments showed that cellulose began to decompose at around 300 °C. The color of the sample was further deepened and about 7.3 wt% weight loss was recorded at 300–325 °C. The active pyrolysis stage of cellulose occurred at 325–350 °C. The weight loss improved with the increasing pyrolysis temperature. The maximum weight loss rate (2.82 wt% °C−1) was attained at 340 °C. A large amount of volatile products were released rapidly and the weight loss of cellulose reached 63 wt% at 350 °C. In addition, the color of the sample became dark brown. After that, the weight loss rate of cellulose decreased and the cellulose pyrolysis reached the carbonation stage. The solid products decomposed and carbonized continuously in the high temperature zone, and finally the black and consolidated char was formed. When the temperature reached 500 °C, 76 wt% weight loss of cellulose pyrolysis in a tubular reactor was recorded. Compared with the cellulose pyrolysis using a thermogravimetric analyzer (heating rate of 20 °C min−1), the yield of solid residues obtained from the tubular reactor was higher due to the lower heating rate during the pyrolysis process. The cellulose pyrolysis in the tubular reactor suggested that the apparent alteration of cellulose in the pyrolysis process was accompanied with its structure and composition changes. These changes provided a new perspective for further study on the mechanism of cellulose pyrolysis.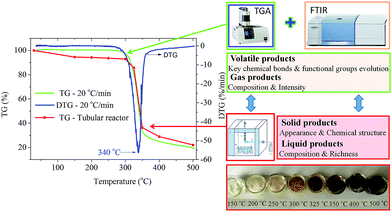 | ||
| Fig. 1 The thermogravimetric characteristics of cellulose and its appearance alteration during the slow pyrolysis process. | ||
3.2 The real-time structural evolution of volatile products
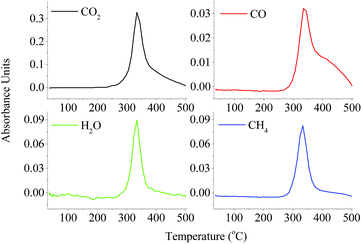
The structural evolution of volatile products derived from slow cellulose pyrolysis was real-time recorded by TG-FTIR. Typical stack plots of IR spectra with respect to the functional groups and typical gas products released during the cellulose pyrolysis process are depicted in ESI Fig. 2† and Fig. 2, respectively. The releasing of volatile products ranged from 300 to 400 °C, which was corresponding well with the tendency of cellulose weight loss. The composition of the volatile products from cellulose pyrolysis can be identified by the characteristic bands. The species functional groups are listed as the following: O–H (3400–3200 cm−1), C–H (3062–2628 cm−1), C![[double bond, length as m-dash]](https://www.rsc.org/images/entities/char_e001.gif) O (1870–1620 cm−1), C–O–C (1270 cm−1), and C–C (1230–1147 cm−1). These representative functional groups were corresponding to the release of volatile products including H2O, anhydrosugars, acids, aldehydes (C
O (1870–1620 cm−1), C–O–C (1270 cm−1), and C–C (1230–1147 cm−1). These representative functional groups were corresponding to the release of volatile products including H2O, anhydrosugars, acids, aldehydes (C![[double bond, length as m-dash]](https://www.rsc.org/images/entities/char_e001.gif) O), alkanes (C–C), and ethers (C–O–C) via a dehydration reaction, β-1,4-glycosidic bond cleavage, decarboxylation reaction, decarbonylation reaction, etc. The intensity of C
O), alkanes (C–C), and ethers (C–O–C) via a dehydration reaction, β-1,4-glycosidic bond cleavage, decarboxylation reaction, decarbonylation reaction, etc. The intensity of C![[double bond, length as m-dash]](https://www.rsc.org/images/entities/char_e001.gif) O (1870–1620 cm−1) was the highest, possibly attributed to the highest yield of LG released, the cracking of pyran during the pyrolysis process and the formation of acids at 350–400 °C. The release profiles of gaseous products (CO2, CO, CH4 and H2O) are also presented in Fig. 5. The CO2 (2357 cm−1) was mainly formed by the cracking and reforming of C
O (1870–1620 cm−1) was the highest, possibly attributed to the highest yield of LG released, the cracking of pyran during the pyrolysis process and the formation of acids at 350–400 °C. The release profiles of gaseous products (CO2, CO, CH4 and H2O) are also presented in Fig. 5. The CO2 (2357 cm−1) was mainly formed by the cracking and reforming of C![[double bond, length as m-dash]](https://www.rsc.org/images/entities/char_e001.gif) O and COOH started at 300 °C. With regard to CO (2180 cm−1), it was mainly attributed to the cracking of functional groups of C
O and COOH started at 300 °C. With regard to CO (2180 cm−1), it was mainly attributed to the cracking of functional groups of C![[double bond, length as m-dash]](https://www.rsc.org/images/entities/char_e001.gif) O and C–O–C. Similar to the case of CO2 evolution, CO evolved from cellulose pyrolysis at around 300 °C. The obvious signal of CO could be observed after 400 °C, indicating that the decarboxylation reaction occurred at the carbonization stage continuously and the reaction between CO2 and solid products. This result was consistent with the evolution of biochar. The CH4 (2896 cm−1) was also recorded by FTIR due to the cracking of methoxy groups (O–CH3). The absorbance intensities of CO and CH4 were much lower than that of CO2, consistent with the research studies by Yang et al.11,18 A strong FTIR signal caused by absorption of H2O evolved during the cellulose pyrolysis process, attributed to the dehydration reaction and the rich O–H content in cellulose. Besides, small amounts of H2, C2H4, and C2H6 were also generated during the cellulose pyrolysis process according to previous literature.18
O and C–O–C. Similar to the case of CO2 evolution, CO evolved from cellulose pyrolysis at around 300 °C. The obvious signal of CO could be observed after 400 °C, indicating that the decarboxylation reaction occurred at the carbonization stage continuously and the reaction between CO2 and solid products. This result was consistent with the evolution of biochar. The CH4 (2896 cm−1) was also recorded by FTIR due to the cracking of methoxy groups (O–CH3). The absorbance intensities of CO and CH4 were much lower than that of CO2, consistent with the research studies by Yang et al.11,18 A strong FTIR signal caused by absorption of H2O evolved during the cellulose pyrolysis process, attributed to the dehydration reaction and the rich O–H content in cellulose. Besides, small amounts of H2, C2H4, and C2H6 were also generated during the cellulose pyrolysis process according to previous literature.18
3.3 Multi-perspective analysis of the evolved solid products in the slow cellulose pyrolysis process
![[thin space (1/6-em)]](https://www.rsc.org/images/entities/char_2009.gif) :
:![[thin space (1/6-em)]](https://www.rsc.org/images/entities/char_2009.gif) 2 (O
2 (O![[thin space (1/6-em)]](https://www.rsc.org/images/entities/char_2009.gif) :
:![[thin space (1/6-em)]](https://www.rsc.org/images/entities/char_2009.gif) H). This suggested that water was mainly generated from OH groups in the cellulose structure, and the FTIR results also confirmed it. In the carbonization stage (>350 °C), the weak bonds of biochar (e.g. C
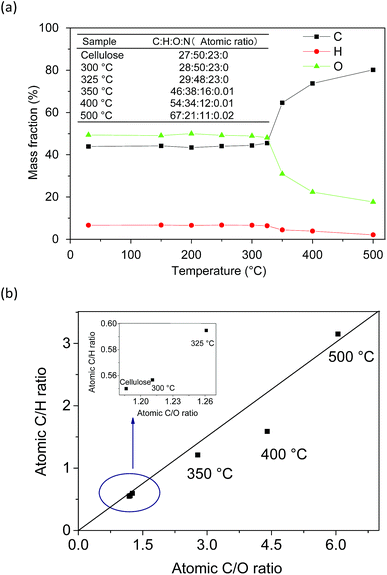
H). This suggested that water was mainly generated from OH groups in the cellulose structure, and the FTIR results also confirmed it. In the carbonization stage (>350 °C), the weak bonds of biochar (e.g. C![[double bond, length as m-dash]](https://www.rsc.org/images/entities/char_e001.gif) O, C–H) further cleaved and cracked with the increasing pyrolysis temperature. The C content in the biochar increased consistently, whereas the H and O contents decreased. This result indicated that the degree of carbonization was accelerated with the evolution of the cellulose pyrolysis process. The C/H and C/O ratios in biochar could reflect its degree of aromaticity and maturation.19 The C/H ratio increased faster than the C/O ratio at 400–500 °C. It was probably due to the fact that dehydrogenation and demethylation reactions occurred at this stage, which accelerated the removal rate of H. The atomic ratio of C
O, C–H) further cleaved and cracked with the increasing pyrolysis temperature. The C content in the biochar increased consistently, whereas the H and O contents decreased. This result indicated that the degree of carbonization was accelerated with the evolution of the cellulose pyrolysis process. The C/H and C/O ratios in biochar could reflect its degree of aromaticity and maturation.19 The C/H ratio increased faster than the C/O ratio at 400–500 °C. It was probably due to the fact that dehydrogenation and demethylation reactions occurred at this stage, which accelerated the removal rate of H. The atomic ratio of C![[thin space (1/6-em)]](https://www.rsc.org/images/entities/char_2009.gif) :
:![[thin space (1/6-em)]](https://www.rsc.org/images/entities/char_2009.gif) H
H![[thin space (1/6-em)]](https://www.rsc.org/images/entities/char_2009.gif) :
:![[thin space (1/6-em)]](https://www.rsc.org/images/entities/char_2009.gif) O in 100 atoms was about 67
O in 100 atoms was about 67![[thin space (1/6-em)]](https://www.rsc.org/images/entities/char_2009.gif) :
:![[thin space (1/6-em)]](https://www.rsc.org/images/entities/char_2009.gif) 21
21![[thin space (1/6-em)]](https://www.rsc.org/images/entities/char_2009.gif) :
:![[thin space (1/6-em)]](https://www.rsc.org/images/entities/char_2009.gif) 11 and the C/H and C/O ratios were 3.15 and 6.05, respectively. According to the distribution of the atomic ratio and the rule of atomic combination, the biochar exhibited a carbon atom sharing phenomenon during the carbonation stage and engendered paramagnetic properties. A previous study showed that the EPR signal of biochar prepared using lignocellulose biomass with a C/H ratio of 0.84 and a C/O ratio of 3.31 could be observed.20 Moreover, the following EPR analysis also confirmed the paramagnetic properties of biochar. Furthermore, the element N (0.02 wt%) was detected in solid residues after 350 °C. This may be due to a tiny amount of N participating in the cellulose carbonation reaction under high temperature conditions.21
11 and the C/H and C/O ratios were 3.15 and 6.05, respectively. According to the distribution of the atomic ratio and the rule of atomic combination, the biochar exhibited a carbon atom sharing phenomenon during the carbonation stage and engendered paramagnetic properties. A previous study showed that the EPR signal of biochar prepared using lignocellulose biomass with a C/H ratio of 0.84 and a C/O ratio of 3.31 could be observed.20 Moreover, the following EPR analysis also confirmed the paramagnetic properties of biochar. Furthermore, the element N (0.02 wt%) was detected in solid residues after 350 °C. This may be due to a tiny amount of N participating in the cellulose carbonation reaction under high temperature conditions.21
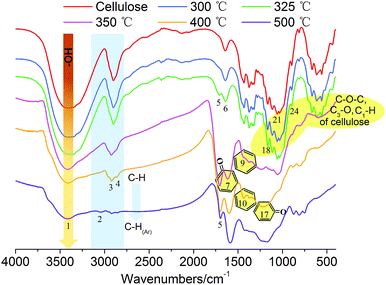
![[double bond, length as m-dash]](https://www.rsc.org/images/entities/char_e001.gif) O (at C-3 stretching), and C–H deformation in cellulose remained as they were below 300 °C. At the same time, the signals corresponding to the cellulose unit between C1 to C6 were observed without obvious alteration from room temperature to 300 °C.28 Both the FTIR and NMR analyses indicated that the main functional groups and linkage bonds of cellulose did not change significantly below 300 °C although the white powder cellulose transformed to light brown powder corresponding to the increasing temperature. This stage was mainly the dehydration process. Cellulose began to degrade at 300 °C and 7.3 wt% cellulose weight loss occurred in this early thermal decomposition stage (300–325 °C). A new absorbance (Peak 5) at 1705 cm−1 attributed to C
O (at C-3 stretching), and C–H deformation in cellulose remained as they were below 300 °C. At the same time, the signals corresponding to the cellulose unit between C1 to C6 were observed without obvious alteration from room temperature to 300 °C.28 Both the FTIR and NMR analyses indicated that the main functional groups and linkage bonds of cellulose did not change significantly below 300 °C although the white powder cellulose transformed to light brown powder corresponding to the increasing temperature. This stage was mainly the dehydration process. Cellulose began to degrade at 300 °C and 7.3 wt% cellulose weight loss occurred in this early thermal decomposition stage (300–325 °C). A new absorbance (Peak 5) at 1705 cm−1 attributed to C![[double bond, length as m-dash]](https://www.rsc.org/images/entities/char_e001.gif) O stretching vibration appeared. A previous study implied that dehydration of the pinacol reaction of cellulose occurred in this pyrolysis stage.29 The FTIR intensities of typical peaks attributed to cellulose (1165 cm−1, 1058 cm−1 and 896 cm−1) decreased gradually corresponding to the NMR intensity of C6 at 64.6 ppm and 62.5 ppm decline. This indicated that the β-1,4-glycosidic bonds of cellulose began to break, the polymerization degree of cellulose decreased, and the reaction activity of cellulose enhanced.
O stretching vibration appeared. A previous study implied that dehydration of the pinacol reaction of cellulose occurred in this pyrolysis stage.29 The FTIR intensities of typical peaks attributed to cellulose (1165 cm−1, 1058 cm−1 and 896 cm−1) decreased gradually corresponding to the NMR intensity of C6 at 64.6 ppm and 62.5 ppm decline. This indicated that the β-1,4-glycosidic bonds of cellulose began to break, the polymerization degree of cellulose decreased, and the reaction activity of cellulose enhanced.
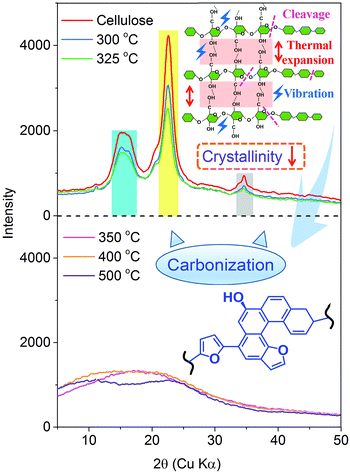
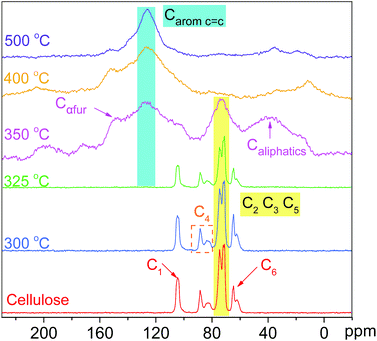
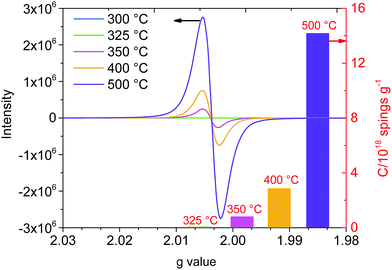
The active pyrolysis stage as well as the intermediate state formation and its dynamic evolution zone was at 325–350 °C. The main features of the intermediate state were (I) the degree of polymerization of cellulose further decreased with the β-1,4-glycosidic bond cleavage; (II) the crystallinity of cellulose decreased gradually and tended to transform to an amorphous state and crystalline order destruction occurred finally accompanied with the anisotropic thermal expansion and the hydrogen bond breaking; (III) the solid product began to form an aromatic structure and engender paramagnetic properties (see Section 3.3.4); (IV) a large amount of volatile products were released via a series of dehydration, decarboxylation, and decarbonylation reactions (see Section 3.4). After this stage (325–350 °C), the typical signals of cellulose in the FTIR and NMR spectra disappeared completely. The absorbances at 1165 cm−1, 1058 cm−1 and 896 cm−1 in the FTIR spectra disappeared. The blue shift of the FTIR spectra was recorded when the pyrolysis temperature was up to 350 °C. The hydrogen bonds between the hydroxyl groups were absolutely broken, leading to the widening of O–H stretching vibration bands. The dehydration reaction caused a large amount of water release. The intensity of O–H stretching vibration bands (Peak 1) decreased obviously. 13C chemical shifts attributed to aliphatic CHx (less than 90 ppm), unsaturated carbon structure (sp2, C![[double bond, length as m-dash]](https://www.rsc.org/images/entities/char_e001.gif) C, 90–200 ppm), C
C, 90–200 ppm), C![[double bond, length as m-dash]](https://www.rsc.org/images/entities/char_e001.gif) O bond (higher than 200 ppm), β-C (149 ppm), and α-C (108 ppm) were observed after the active pyrolysis. These serious changes of cellulose were due to β-1,4-glycosidic bond cleavage, C
O bond (higher than 200 ppm), β-C (149 ppm), and α-C (108 ppm) were observed after the active pyrolysis. These serious changes of cellulose were due to β-1,4-glycosidic bond cleavage, C![[double bond, length as m-dash]](https://www.rsc.org/images/entities/char_e001.gif) C formation by dehydration reaction, furan ring structure formation derived from sugar unit isomerization, and a large amount of molecular product release via dehydrogenation, deoxygenation and decarboxylation, etc. In the carbonization stage (350–500 °C), the aromatic characteristic of char residues became more evident. The absorbances at 1600 cm−1, 1421–1433 cm−1 and 1170–1236 cm−1 were the characteristic bands of aromatic rings. They were typical stretching vibration bands of the aromatic C
C formation by dehydration reaction, furan ring structure formation derived from sugar unit isomerization, and a large amount of molecular product release via dehydrogenation, deoxygenation and decarboxylation, etc. In the carbonization stage (350–500 °C), the aromatic characteristic of char residues became more evident. The absorbances at 1600 cm−1, 1421–1433 cm−1 and 1170–1236 cm−1 were the characteristic bands of aromatic rings. They were typical stretching vibration bands of the aromatic C![[double bond, length as m-dash]](https://www.rsc.org/images/entities/char_e001.gif) O, C
O, C![[double bond, length as m-dash]](https://www.rsc.org/images/entities/char_e001.gif) C conjugated system and their intensities increased gradually. The C
C conjugated system and their intensities increased gradually. The C![[double bond, length as m-dash]](https://www.rsc.org/images/entities/char_e001.gif) O bond from the char residue continued to break down in the way of a decarboxylation reaction. At 500 °C, the aliphatic CHx stretching vibration (Peak 3 and 4) disappeared while the signal of aromatic C–H at 3040 cm−1 (Peak 2) appeared. The signal of the aromatic ring derived from the char residue at around 126 ppm was observed. The char residue showed an obvious aromatic ring characteristic. Simultaneously, the peaks at 33 ppm and 17 ppm are attributed to aliphatic CHx. And the shoulder at 152 ppm corresponded to C1 and C4 of the furan ring. These chemical structures of the char residue analyzed by FTIR were well consistent with the 13C CP/MAS NMR analysis.
O bond from the char residue continued to break down in the way of a decarboxylation reaction. At 500 °C, the aliphatic CHx stretching vibration (Peak 3 and 4) disappeared while the signal of aromatic C–H at 3040 cm−1 (Peak 2) appeared. The signal of the aromatic ring derived from the char residue at around 126 ppm was observed. The char residue showed an obvious aromatic ring characteristic. Simultaneously, the peaks at 33 ppm and 17 ppm are attributed to aliphatic CHx. And the shoulder at 152 ppm corresponded to C1 and C4 of the furan ring. These chemical structures of the char residue analyzed by FTIR were well consistent with the 13C CP/MAS NMR analysis.
3.4 Molecular products of cellulose pyrolysis in various thermal-decomposition stages
The molecular products of cellulose pyrolysis identified by GC/MS in various thermal-decomposition stages are shown in ESI Table 3.† Below 300 °C, pyrolysis products derived from cellulose were not detected. This result further illustrated that this stage mainly was the dehydration process. As cellulose depolymerized at 300–325 °C, the β-1,4-glycosidic bond broke up corresponding to the dehydration reaction, which led the high formation of anhydrosugars. Levoglucosan (LG) was the main primary product of cellulose depolymerization reactions and its relative content reached 54.54% in this stage. The dehydration of levoglucosan (LG) further led to the formation of levoglucosenone (LGO) and 1,4:3,6-dianhydro-glucopyranose.31,32 The yields of LGO and DGP were 10.41% and 7.22%, respectively. Furans (e.g. furfural 9.14%, β-methoxy-(S)-2-furanethanol, 8.77%, and 5-hydroxymethylfurfural, 1.12%) were also detected in this stage. The yields of small molecular compounds (acids, aldehydes, and ketones) original from fragmentation reactions were much lower than those of anhydrosugars and furans. These results were consistent with work performed by other researchers, indicating that during the initial stage of cellulose depolymerization the β-1,4-glycosidic bond cleavage and dehydration reaction mainly occurred.28 In the active pyrolysis stage (325–350 °C), most of the cellulose was decomposed into the volatile product bio-oil. The anhydrosugars of LG, LGO, and DGP were the main pyrolysis products in this stage, and their total relative content was up to 69.13%. Compared with the initial cellulose pyrolysis stage, the percentage of LG in the bio-oil was decreased 4.5% while the percentages of LGO and DGP were increased slightly. This may be due to the dehydration reaction of LG with the increase of temperature. What's more, the extent of the secondary reaction was increased and the composition of the bio-oil became more complex, leading to the formation of various kinds of ketones and the yields of acids reaching 2.48%. After the active pyrolysis stage, the secondary reactions were dominant during the cellulose pyrolysis at 350–400 °C. The yields of the three kinds of anhydrosugars (LG, LGO, and DGP) were decreased to 30%. The substance underwent dehydroxylation, decarboxylation, and decarbonylation reactions, producing large amounts of ketones, furans, and acids. The percentage of acetic acid achieved a maxima (16.18%) in this pyrolysis stage. Two pathways may lead to acetic acid production (i) the secondary reactions of primary volatile products, and (ii) rearrangement reactions of solid products. At the carbonization stage (400–500 °C), approximately 6.5% aromatic hydrocarbons (benzenes and 3-methylindene) were recorded. It is interesting to note that the percentage of LG was as high as 59.33% at this stage. Although, the viscous compounds in the condensable bio-oil were not measurable by GC/MS due to its technology limitation. This phenomenon may be due to the oligomers generated from the initial depolymerization stage and active pyrolysis stage condensing on the tube wall of the reactor, and then decomposing again at high temperature. Although the oligomers in the condensable bio-oil could not be measured due to GC/MS technology limitation, these findings gave an insight into the utilization of oligomers in bio-oil.4. Conclusion
At the initial slow pyrolysis stage, the appearance of cellulose changed from white powder to light brown powder corresponding to its crystal lattice thermal expansion and the degree of crystallinity decrease. Cellulose began to deconstruct at 300 °C accompanied with the dehydration of the pinacol reaction and primary product levoglucosan generation. 325–350 °C was the critical pyrolysis stage for cellulose, leading to an intermediate species formation. Lots of volatile products including anhydrosugars, CO and CO2 were released via β-1,4-glycosidic bond cleavage, decarboxylation, and decarbonylation reactions. The increasing C/H and C/O ratios in the carbonation stage enhanced the aromaticity of biochar, which tended to form stable carbon-centered radicals.Conflicts of interest
There are no conflicts to declare.Acknowledgements
The financial support of support of the Science and Technology Project of Guangzhou City (No. 201607020025) and the National Key R&D Program of China (No. 2017YFB0307901).Notes and references
- M. S. Mettler, D. G. Vlachos and P. J. Dauenhauer, Energy Environ. Sci., 2012, 57797–57809 Search PubMed.
- C. Ho Lam, S. Das, N. C. Erickson, C. D. Hyzer, M. Garedew, J. E. Anderson, T. J. Wallington, M. A. Tamor, J. E. Jacksonae and C. M. Saffron, Sustainable Energy Fuels, 2017, 1, 258–266 RSC.
- R. Vinu and L. J. Broadbelt, Energy Environ. Sci., 2012, 5, 9808–9826 RSC.
- Z. Jiang, J. Fan, V. L. Budarin, D. J. Macquarrie, Y. Gao, T. Li, C. Hu and J. H. Clark, Sustainable Energy Fuels, 2018, 2, 936–940 RSC.
- A. V. Bridgwater, Biomass Bioenerg., 2012, 38, 68–94 CrossRef.
- M. S. Mettler, S. H. Mushrif, A. D. Paulsen, A. D. Javadekar, D. G. Vlachos and P. J. Dauenhauer, Energy Environ. Sci., 2012, 5, 5414–5424 RSC.
- J. Lédé, J. Anal. Appl. Pyrolysis, 2012, 94, 17–32 CrossRef.
- P. J. Dauenhauer, J. L. Colby, C. M. Balonek, W. J. Suszynski and L. D. Schmidt, Green Chem., 2009, 11, 1555–1561 RSC.
- A. R. Teixeira, K. G. Mooney, J. S. Kruger, C. Luke Williams, W. J. Suszynski, L. D. Schmidt, D. P. Schmidt and P. J. Dauenhauer, Energy Environ. Sci., 2011, 4, 4306–4321 RSC.
- O. Boutin, M. Ferrer and J. Lédé, J. Anal. Appl. Pyrolysis, 1998, 47, 13–31 CrossRef.
- D. K. Shen and S. Gu, Bioresour. Technol., 2009, 100, 6496–6504 CrossRef PubMed.
- J. B. Paine, Y. B. Pithawalla and J. D. Naworal, J. Anal. Appl. Pyrolysis, 2008, 82, 10–41 CrossRef.
- G. R. Ponder and G. N. Richards, Carbohydr. Res., 1993, 244, 27–47 CrossRef.
- H. Kawamoto, Curr. Org. Chem., 2016, 20, 2444–2457 CrossRef.
- J. Chen, J. Liang and S. Wu, Bioresour. Technol., 2016, 218, 402–409 CrossRef PubMed.
- L. Segal, J. J. Creely, A. E. Martin and C. M. Conrad Jr, Text. Res. J., 1959, 29, 786–794 CrossRef.
- J. Kibet, L. Khachatryan and B. Dellinger, Environ. Sci. Technol., 2012, 46, 12994–13001 CrossRef PubMed.
- H. Yang, R. Yan, H. Chen, D. H. Lee and C. Zheng, Fuel, 2007, 86, 1781–1788 CrossRef.
- E. S. Krull, J. A. Baldock, J.O. Skjemstad and R. J. Smernik, Adelaide Research and Scholarship, Characteristics of biochar: organo-chemical properties, Earthscan, 2009 Search PubMed.
- G. Fang, C. Zhu, D. D. Dionysiouc, J. Gao and D. Zhou, Bioresour. Technol., 2015, 176, 210–217 CrossRef PubMed.
- X. Wang, Y. Zhang, C. Zhi, X. Wang, D. Tang, Y. Xu, Q. Weng, X. Jiang, M. Mitome, D. Golberg and Y. Bando, Nat. Commun., 2013, 4, 2905 CrossRef PubMed.
- R. Hori and M. Wada, Cellulose, 2005, 12, 479–484 CrossRef.
- G. A. Zicklera, W. Wagermaiera, S. S. Funarib, M. Burghammerc and O. Paris, J. Anal. Appl. Pyrolysis, 2007, 80, 134–140 CrossRef.
- D.-Y. Kim, Y. Nishiyama, M. Wada, S. Kuga and T. Okano, Holzforschung, 2001, 55, 521–524 Search PubMed.
- O. Paris, C. Zollfrank and G. A. Zickler, Carbon, 2005, 43, 53–66 CrossRef.
- V. Tserki, N. E. Zafeiropoulos, F. Simon and C. Panayiotou, Composites, Part A, 2005, 36, 1110–1118 CrossRef.
- K. Ho Kim, J.-Y. Kim, T.-S. Cho and J. W. Choi, Bioresour. Technol., 2012, 118, 158–162 CrossRef PubMed.
- J. B. Wooten, J. I. Seeman and M. R. Hajaligol, Energy Fuels, 2004, 18, 1–15 CrossRef.
- M. Zhang, Z. Geng, Z. Geng and Y. Yu, Energy Fuels, 2011, 25, 2664–2670 CrossRef.
- A. L. N. dela Cruz, R. L. Cook, S. M. Lomnicki and B. Dellinger, Environ. Sci. Technol., 2012, 46, 5971–5978 CrossRef PubMed.
- P. M. Molton and T. F. Demmitt, Reaction mechanisms in cellulose pyrolysis: a literature review, United States: N. p., 1977 Search PubMed.
- Z. Wang, A. G. McDonald, R. J. M. Westerhof, S. R. A. Kersten, C. M. Cuba-Torres, S. Ha, B. Pecha and M. Garcia-Perez, J. Anal. Appl. Pyrolysis, 2013, 100, 56–66 CrossRef.
Footnote |
| † Electronic supplementary information (ESI) available. See DOI: 10.1039/c8se00166a |
| This journal is © The Royal Society of Chemistry 2018 |


