Multi-phase real-time monitoring of oxygen evolution enables in operando water oxidation catalysis studies†
Fabian L.
Huber‡
 a,
Sebastian
Amthor‡
a,
Benjamin
Schwarz
a,
Boris
Mizaikoff
a,
Sebastian
Amthor‡
a,
Benjamin
Schwarz
a,
Boris
Mizaikoff
 b,
Carsten
Streb
 *a and
Sven
Rau
*a
aInstitute of Inorganic Chemistry I, Ulm University, Albert-Einstein-Allee 11, 89081 Ulm, Germany. E-mail: carsten.streb@uni-ulm.de; sven.rau@uni-ulm.de
bInstitute of Analytical and Bioanalytical Chemistry, Ulm University, Albert-Einstein-Allee 11, 89081 Ulm, Germany
First published on 13th July 2018
Abstract
Understanding the reactivity of water oxidation catalysts (WOCs) is critical for designing advanced materials for sustainable energy technologies. Here, we show how optical oxygen sensors based on fluorescence quenching enable the simultaneous real-time in operando monitoring of O2 evolution in solution and in the gas phase, thereby opening new avenues for advanced mechanistic studies under true operating conditions. The advantages of the system are demonstrated by rationalizing and overcoming reactivity limitations of two prototype molecular WOCs.
The splitting of water into oxygen and hydrogen is a key reaction for sustainable energy technologies.1–3 In particular the oxidation of water to molecular oxygen (eqn (1)) is challenging,3,4 as it involves four proton-coupled electron transfers, the formation of an O–O bond and leads to highly reactive oxygen species.5,6
| 2H2O → O2 + 4H+ + 4e− | (1) |
The development of water oxidation catalysts (WOCs) capable of performing this process is therefore at the forefront of modern energy conversion and storage research and has led to homogeneous and heterogeneous systems where WOC is performed under electrochemical, photochemical or photo-electrochemical conditions.6 However, catalyst development has outpaced fundamental mechanistic studies so that, currently, there is only limited understanding of the processes that govern catalyst reactivity and deactivation. For many WOCs, knowledge-based materials design is not possible, as detailed insights into the underlying reaction mechanisms are not available. One main reason is the difficult, tedious and often unreliable quantification of the oxygen evolution, which forms the basis of many mechanistic studies and is the foundation for homogeneous WOC activity comparison, where turnover number (TON) and turnover frequency (TOF) are used as performance indicators (eqn (2) and (3)).
| TON = mole O2 formed/mole catalyst | (2) |
| TOF = TON/reaction time | (3) |
Currently, several analytical approaches are used to quantify oxygen evolution, including gas chromatography, electrochemical (i.e. Clark-type) probes, pressure transducers and volumetric methods.7 However, these methods have significant drawbacks, as they can often not be used in operando, require sampling of only one reaction phase (i.e. liquid or gas phase), consume O2 during the measurement and are invasive, so that O2 leakage from/into the reaction vessel are sources of experimental error. In consequence, advanced mechanistic studies requiring accurate kinetic information on the O2 evolution are limited by classical O2 quantification techniques. More recently, optical fluorescent oxygen sensors have been used to monitor homogeneous WOC catalysis.7,8
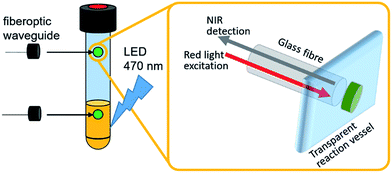
These systems typically use a fiber-optic setup, where a fiber-optic waveguide featuring a fluorescent dye immobilized in a porous membrane at the fiber tip is introduced into the reaction vessel (Fig. 1).7 The dye is photoexcited with visible light and emits in the near infrared region. Sensing is based on emission quenching in the presence of molecular oxygen, so that ratiometric oxygen quantification is enabled by determining the amount of quenching via the intensity change or – more advanced – the decay of the luminescence lifetime as a function of oxygen concentration. This measurement principle applies to both the solution and the gas phase, so that the detection of dissolved and gaseous O2 is possible. Typically, this allows continuous O2 quantification with a time resolution of <1s, accuracies ±0.2% and detection limits <0.1% O2.7 The sensor spots used in this study are stable under harsh chemical conditions, operate between pH 1–14 and can be employed under oxidizing conditions and at high temperatures (up to 120 °C) without degradation (see ESI† for details).
 | ||
| Fig. 1 Illustration of the experimental setup utilizing individual oxygen-sensitive sensor spots for in operando O2 detection in the gas- and liquid-phase. | ||
While typically the optical sensor is introduced in the reaction vessel through a septum or similar device, advanced sensor designs enable the simultaneous in operando quantification of dissolved and gaseous O2 using non-invasive optical sensing. Thus, the entire WOC reaction can be carried out and monitored in hermetically sealed reaction vials. Thereby, comprehensive O2 evolution data for the entire reaction is immediately available, and kinetic data, changes in catalytic rates or experimental defects (e.g. electrical faults during electrocatalytic WOC or changes in light intensity during photochemical WOC) are readily detected. In addition, parallelization of WOC studies may accelerate catalyst development and mechanistic studies, so that in future, WOC research directly benefits from streamlined O2 quantification.
Herein we demonstrate the use of optical fluorescent O2 detector systems, where sensing and detection modules are physically decoupled, so that sensor spots can be attached to the inside of a sealed, transparent reaction vessel (i.e. Schlenk tube, pressure reactor, etc.), while the optical detection system non-invasively addresses the sensor spots via fiberoptic waveguides attached to the outside of the vessel, see Fig. 1. This technique has been applied to a variety of geochemical, biological, and biomedical oxygen sensing scenarios7,9–12 but is not commonly used in WOC studies. We describe that the integration of this system into photochemical, electrochemical or photo-electrochemical water splitting studies is in principle possible, so that in operando quantification of O2 evolution is enabled. When two sensor spots are used simultaneously, solution- and gas-phase O2 concentrations are determined and correlated in real-time, so that comprehensive data for the entire catalytic process is obtained.
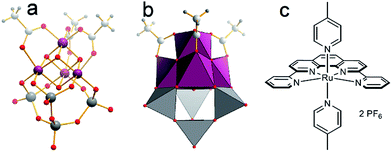
In this study, we show that this in operando multi-phase detection strategy provides unprecedented understanding of the catalytic performance of model WOCs and leads to new reactivity insights which have thus far not been possible. As prototype WOCs, two compound classes have been selected to illustrate the versatility of the detection system (Fig. 2).
 | ||
| Fig. 2 Structure of the WOC models used: (a and b) [Mn4V4O17(OAc)3]3− (= {Mn4V4}, Mn purple, V grey, O red, C grey, H small grey). (c) [Ru(dpp)(pic)2](PF6)2 (=Ru-WOC). | ||
As single-site catalyst, we use the established Thummel complex [Ru(dpp)(pic)2](PF6)2 (=Ru-WOC, dpp = 2,9-di(pyridine-2′-yl)-1,10-phenanthroline, pic = 4-picoline, Fig. 2).13,14 For Ru-WOC, photochemical homogeneous WOC activity was reported in combination with the photosensitizer [Ru(bpy)3]2+ (bpy = 2,2′-bipyridine) and the electron acceptor peroxodisulfate, leading to maximum TONs of ca. 7.5 after 10 min irradiation.15 As polyoxometalate (POM) model WOC, we used the manganese vanadium oxide cluster [Mn4V4O17(OAc)3]3− (={Mn4V4}) reported by Streb et al., which gave solution-based TONs of ca. 1150 and TOFs of ca. 1.75 s−1 under homogeneous photochemical conditions when combined with the photosensitizer [Ru(bpy)3]2+ and the electron acceptor peroxodisulfate (Fig. 2).8,16
First we investigated the three component system reported by Thummel et al., consisting of the Ru-WOC (2.6 μM), the photosensitizer [Ru(bpy)3]Cl2 (0.3 mM), and Na2S2O8 (10 mM) in aqueous Na2SiF6/NaHCO3 buffer (5 mL, 10 mM Na2SiF6 containing 70 μL MeCN to improve solubility).15 We were interested in exploring the effect of the photosensitizer counter-anion on the catalyst reactivity based on earlier literature reports which showed that molecular WOCs can be significantly affected by simple anions.17 We therefore compared Ru-WOC performance using the original chloride anion, and in addition we explored the weakly coordinating PF6− as photosensitizer counter-ion. The reactions were carried out in sealed glass vials equipped with two sensor spots (to monitor gas phase and solution phase, Fig. 1) using LED irradiation (λmax = 470 nm, ca. 50 mW cm−2). First, we explored the catalyst performance using PF6− as photosensitizer counter-ion. As shown in Fig. 3, both sensors provide real-time data of the oxygen evolution: after an induction period of ca., 85 s and an initial consumption of the residual oxygen,18 the O2 concentration rose rapidly and reached a plateau after ca. 11 min. We observe total TONs (solution + gas phase) of ∼32 and maximum TOFs of ∼3.3 min−1, indicating higher reactivity (TON increase ∼4×) compared to the original study.13,14 Interestingly, during the catalytic experiment (approx. 20 min), most of the O2 evolved remains dissolved in solution, and diffusion of O2 into the gas phase occurs in a linear fashion at a rate of ca. 3 nmol min−1.
The study shows, that gas phase O2 measurements, e.g. by gas chromatography, would give readings that are significantly too low, and in addition, the O2 concentration detected in the gas phase would be dependent on the precise sampling time. The obtained results would therefore be prone to errors, may not represent true values, and are potentially irreproducible. In contrast, the detection strategy presented here provides a comprehensive real-time view of the O2 evolution in solution and in the gas phase.
As a comparison, the reaction was carried out under literature-known conditions, i.e. using [Ru(bpy)3]Cl2 as photosensitizer, instead of the PF6− salt. Here, striking differences in O2 evolution are observed: O2 evolution in solution is significantly slower compared to the initial experiments (TOFmax ∼ 1 min−1), O2 evolution continues for longer periods compared to the initial experiment (plateau reached after ∼22 min) and O2 diffusion into the gas phase follows a sigmoidal curve compared with a linear behaviour in the first study. The maximum TONs (∼11, Fig. 3) are in line with the original publication and indicate a pronounced effect of the counter-ions present on WOC activity. We suggest, that the observed reactivity differences are due to the different coordinating behaviour of Cl−vs. PF6−. Thus, chloride can compete with water binding during the catalytic cycle (see Fig. S7†),17,19 leading to a loss of WOC activity. Identification of this catalyst poisoning mechanism therefore has direct implications on future catalyst development.20,21 Additionally chloride can in principle rapidly react with sulfate radical anions, which are formed as intermediate during catalysis. Thereby chloride could act as competing substrate and thus lower the O2-yields observed.22
We hypothesized that using an optimized photosensitizer with higher oxidation potential could lead to further WOC activity enhancement. To this end, we employed the modified Ru-photosensitizer [Ru(dceb)2(bpy)](PF6)2 (dceb = diethyl[2,2′-bipyridine]-4,4′-dicarboxylate) which features a higher redox potential (E(RuII/RuIII) = 1.54 V vs. NHE) compared with the prototype [Ru(bpy)3]2+ (E(RuII/RuIII) = 1.26 V vs. NHE).23 Here, we observed high O2 evolution reactivity leading to maximum TONs of ∼290 and TOFmax ∼ 27 min−1. In detail, the O2 evolution starts after a brief induction period (∼50 s), and follows a sigmoidal increase until reaching a plateau after ∼15 min. A linear increase of the gas-phase O2 concentration is observed (O2 diffusion rate ca. 23 nmol min−1). Changing the photosensitizer therefore leads to a significantly increased reactivity (TON increase ∼25×) compared to the original system.
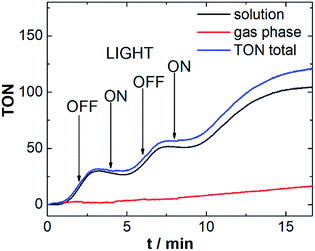
To investigate the responsiveness of the sensor spots, and to demonstrate that the measurements are not affected by external irradiation, we performed the above reaction (using Ru-WOC as catalyst and [Ru(dceb)2(bpy)](PF6)2 as photosensitizer) while turning the LED on and off at intervals of 2 min. As shown in Fig. 4, after switching off the irradiation source, the O2 evolution continues for a short period of time (40–60 s) before ceasing. This behavior could be due to continued WOC activity based on the presence of an excess of oxidized photosensitizer (photosensitizer![[thin space (1/6-em)]](https://www.rsc.org/images/entities/char_2009.gif) :
:![[thin space (1/6-em)]](https://www.rsc.org/images/entities/char_2009.gif) catalyst molar ratio = 115
catalyst molar ratio = 115![[thin space (1/6-em)]](https://www.rsc.org/images/entities/char_2009.gif) :
:![[thin space (1/6-em)]](https://www.rsc.org/images/entities/char_2009.gif) 1). In addition, diffusion processes in solution could also be contributing to the observed sensor response. When irradiation is switched on again, similar delays are observed, suggesting that O2 transport processes may indeed be involved in the response behavior. Note that the response time of the sensor spots used (∼1 s) does not allow quantification of very fast O2 evolution reactions. However Vickers et al. recently reported a continuous flow technique, suitable for the investigation of such rapid reactions with resolution in the 1–3 s range.24
1). In addition, diffusion processes in solution could also be contributing to the observed sensor response. When irradiation is switched on again, similar delays are observed, suggesting that O2 transport processes may indeed be involved in the response behavior. Note that the response time of the sensor spots used (∼1 s) does not allow quantification of very fast O2 evolution reactions. However Vickers et al. recently reported a continuous flow technique, suitable for the investigation of such rapid reactions with resolution in the 1–3 s range.24
To demonstrate that O2 detection is not limited to aqueous systems, we explored the O2 evolution by the manganese vanadate WOC {Mn4V4}, which operates in mixed MeCN/H2O solvent. The reaction was performed under the conditions reported in the original publication,8 where solution-based TONs ∼ 1150 and TOFmax ∼ 1.75 min−1 were reported. Here, {Mn4V4} (0.3 μM) was reacted with the photosensitizer [Ru(bpy)3](PF6)2 (1 mM) and the electron acceptor Na2S2O8 (10 mM) in MeCN![[thin space (1/6-em)]](https://www.rsc.org/images/entities/char_2009.gif) :
:![[thin space (1/6-em)]](https://www.rsc.org/images/entities/char_2009.gif) H2O (9
H2O (9![[thin space (1/6-em)]](https://www.rsc.org/images/entities/char_2009.gif) :
:![[thin space (1/6-em)]](https://www.rsc.org/images/entities/char_2009.gif) 1, v/v). The reaction mixture was kept in a sealed reaction vial containing two sensor spots (solution, gas-phase, Fig. 1). The sample was irradiated by LEDs (λmax = 470 nm, ca. 50 mW cm−2).
1, v/v). The reaction mixture was kept in a sealed reaction vial containing two sensor spots (solution, gas-phase, Fig. 1). The sample was irradiated by LEDs (λmax = 470 nm, ca. 50 mW cm−2).
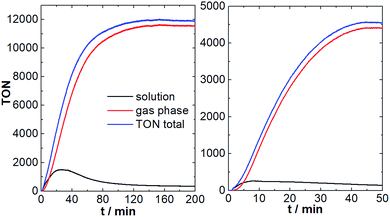
As shown in Fig. 5, after a brief induction period, O2 evolution in the solution and the gas phase increase in a sigmoidal fashion. Oxygen evolution in solution reaches a plateau after ∼20 min, leading to a maximum TON of ∼1200. This is in line with the original literature report.8 Notably, under the given conditions, O2 diffusion into the gas phase is significantly faster compared to the aqueous system (maximum diffusion rate ca. 150 nmol min−1). This is most likely due to the higher solubility and higher diffusion coefficients of O2 in ACN compared with H2O.25 In consequence, most of the O2 formed by {Mn4V4} is detected in the gas phase (TONgas-phase ∼ 10![[thin space (1/6-em)]](https://www.rsc.org/images/entities/char_2009.gif) 000; final gas phase O2 concentration: 6.8 vol%), leading to maximum combined (solution + gas-phase) TONs of ∼12
000; final gas phase O2 concentration: 6.8 vol%), leading to maximum combined (solution + gas-phase) TONs of ∼12![[thin space (1/6-em)]](https://www.rsc.org/images/entities/char_2009.gif) 000 and a combined TOFmax of ∼216 min−1. In the initial report, O2 detection was only performed in the solution phase, so that the performance of {Mn4V4} was significantly under-estimated.8
000 and a combined TOFmax of ∼216 min−1. In the initial report, O2 detection was only performed in the solution phase, so that the performance of {Mn4V4} was significantly under-estimated.8
Further, we explored whether chloride poisoning is also critical for {Mn4V4}. To this end, we performed the reaction described above using [Ru(bpy)3]Cl2 as photosensitizer under otherwise identical conditions. As shown in Fig. 5, significantly lower O2 evolution is observed in solution and in the gas-phase, and the maximum total TON (solution + gas-phase) is ∼4![[thin space (1/6-em)]](https://www.rsc.org/images/entities/char_2009.gif) 500, highlighting that chloride ions indeed affect the {Mn4V4} reactivity.
500, highlighting that chloride ions indeed affect the {Mn4V4} reactivity.
Finally, we explored whether stirring of the solution affects O2 detection, as both, O2 transport in the solution (e.g. between solution and sensor spot) as well as O2 diffusion from solution to the gas phase could be affected by stirring. To this end, we performed the standard water oxidation reaction by {Mn4V4} (using [Ru(bpy)3](PF6)2 as photosensitizer, see above) with and without stirring under otherwise identical conditions. We note that the overall TON of the system is independent of solution stirring; however, faster diffusion of O2 from solution to the gas phase is observed, indicating that faster equilibration between both phases is enabled by stirring (see Fig. S12†).
Conclusions
In conclusion, we report a simultaneous solution- and gas-phase detection strategy to collect quantitative kinetic information on the oxygen evolution by homogeneous water oxidation catalysts. Our initial studies show that detailed mechanistic insights into catalyst reactivity and deactivation become directly accessible. Consequently, systematic and accelerated catalyst optimization become feasible. This is demonstrated by exploring a Ru-WOC, where two optimization steps lead to an approx. 25× increase in oxygen evolution. In addition, we show that correlated yet independent monitoring of solution and gas-phase oxygen concentrations provides a comprehensive view of the true WOC reactivity. Further, exploration of the reactivity of a molecular manganese vanadium oxide WOC by solution and gas-phase monitoring reveals, that the turnover numbers are ten-fold higher than initially reported. In summary, the present study therefore provides a straightforward, facile and reliable approach for the in operando characterization of WOC catalysts. Future studies will expand this approach towards heterogeneous catalysts and electrochemical/photo-electrochemical reaction conditions and demonstrate the system performance for other oxygen-dependent reactions such as aerobic oxidations, oxygen reduction reactions etc. The reported O2 detection system will be used as a component for the design of a standardized light-driven water oxidation catalysis reactor setup.Experimental section
Experimental procedures, information regarding the used measurement setup and additional data for the performed experiments are available in the ESI.†Conflicts of interest
There are no conflicts to declare.Acknowledgements
Financial support by Ulm University, the Deutsche Forschungsgemeinschaft (Transregio-SFB TRR234 “CataLight”, Graduate School GRK 1626, STR1164/4) and EU COST Actions CM1202 (PerspectH2O) and CM1203 (PoCheMoN) is gratefully acknowledged.Notes and references
- N. S. Lewis and D. G. Nocera, Proc. Natl. Acad. Sci. U. S. A., 2006, 103, 15729–15735 CrossRef PubMed.
- R. Schlögl, Angew. Chem., Int. Ed., 2011, 50, 6424–6426 CrossRef PubMed.
- I. Roger, M. A. Shipman and M. D. Symes, Nat. Rev. Chem., 2017, 1, 00003 CrossRef.
- T. J. Meyer, Nature, 2008, 451, 778–779 CrossRef PubMed.
- V. Artero, M. Chavarot-Kerlidou and M. Fontecave, Angew. Chem., Int. Ed., 2011, 50, 7238–7266 CrossRef PubMed.
- H. Dau, C. Limberg, T. Reier, M. Risch, S. Roggan and P. Strasser, ChemCatChem, 2010, 2, 724–761 CrossRef.
- O. S. Wolfbeis, BioEssays, 2015, 37, 921–928 CrossRef PubMed.
- B. Schwarz, J. Forster, M. K. Goetz, D. Yücel, C. Berger, T. Jacob and C. Streb, Angew. Chem., Int. Ed., 2016, 55, 6329–6333 CrossRef PubMed.
- F. Seichter, J. Vogt, P. Radermacher and B. Mizaikoff, Anal. Chim. Acta, 2017, 951, 32–45 CrossRef PubMed.
- F. Seichter, J. Vogt, P. Radermacher and B. Mizaikoff, Anal. Chim. Acta, 2017, 972, 16–27 CrossRef PubMed.
- B. Tamburic, S. Guruprasad, D. T. Radford, M. Szabó, R. M. C. Lilley, A. W. D. Larkum, J. B. Franklin, D. M. Kramer, S. I. Blackburn, J. A. Raven, M. Schliep and P. J. Ralph, PLoS One, 2014, 9, e86047 CrossRef PubMed.
- M. Quaranta, E. Nugroho Prasetyo, K. Koren, G. S. Nyanhongo, M. Murkovic, I. Klimant and G. M. Guebitz, Anal. Bioanal. Chem., 2013, 405, 2371–2377 CrossRef PubMed.
- R. Zong and R. P. Thummel, J. Am. Chem. Soc., 2004, 126, 10800–10801 CrossRef PubMed.
- G. Zhang, R. Zong, H. W. Tseng and R. P. Thummel, Inorg. Chem., 2008, 47, 990–998 CrossRef PubMed.
- L. Tong, R. Zong, R. Zhou, N. Kaveevivitchai, G. Zhang and R. P. Thummel, Faraday Discuss., 2015, 185, 87–104 RSC.
- B. Schwarz, J. Forster, M. H. Anjass, S. Daboss, C. Kranz and C. Streb, Chem. Commun., 2017, 53, 11576–11579 RSC.
- S. Masaoka and K. Sakai, Chem. Lett., 2009, 38, 182–183 CrossRef.
- S. Rau, M. Schwalbe, S. Losse, H. Görls, C. McAlister, F. M. MacDonnell and J. G. Vos, Eur. J. Inorg. Chem., 2008, 1031–1034 CrossRef.
- J. T. Muckerman, M. Kowalczyk, Y. M. Badiei, D. E. Polyansky, J. J. Concepcion, R. Zong, R. P. Thummel and E. Fujita, Inorg. Chem., 2014, 53, 6904–6913 CrossRef PubMed.
- L. Yan, R. Zong and Y. Pushkar, J. Catal., 2015, 330, 255–260 CrossRef.
- D. Moonshiram, Y. Pineda-Galvan, D. Erdman, M. Palenik, R. Zong, R. Thummel and Y. Pushkar, J. Am. Chem. Soc., 2016, 138, 15605–15616 CrossRef PubMed.
- P. Neta, R. E. Huie and A. B. Ross, J. Phys. Chem. Ref. Data, 1988, 17, 1027–1284 CrossRef.
- M. D. Kärkäs, O. Verho, E. V Johnston and B. Åkermark, Chem. Rev., 2014, 114, 11863–12001 CrossRef PubMed.
- J. W. Vickers, J. M. Sumliner, H. Lv, M. Morris, Y. V. Geletii and C. L. Hill, Phys. Chem. Chem. Phys., 2014, 11942–11949 RSC.
- M. Tsushima, K. Tokuda and T. Ohsaka, Anal. Chem., 1994, 66, 4551–4556 CrossRef.
Footnotes |
| † Electronic supplementary information (ESI) available: Synthetic, analytical and catalytic details are provided. See DOI: 10.1039/c8se00328a |
| ‡ These authors contributed equally to this work. |
| This journal is © The Royal Society of Chemistry 2018 |


