 Open Access Article
Deswelling behaviour of ionic microgel particles from low to ultra-high densities†
Sofi
Nöjd
a,
Peter
Holmqvist
a,
Niels
Boon
 *a,
Marc
Obiols-Rabasa‡
 a,
Priti S.
Mohanty
 ab,
Ralf
Schweins
 c and
Peter
Schurtenberger
 *a
*a
aDivision of Physical Chemistry, Department of Chemistry, Lund University, SE-22100 Lund, Sweden. E-mail: njhboon@gmail.com; Peter.Schurtenberger@fkem1.lu.se
bSchool of Chemical Technology, Kalinga Institute of Industrial Technology (KIIT), Bhubaneswar, India
cLarge Scale Structures Group, Institut Laue-Langevin, Grenoble, 38042, France
First published on 2nd May 2018
Abstract
The swelling of ionic microgel particles is investigated at a wide range of concentrations using a combination of light, X-ray and neutron scattering techniques. We employ a zero-average contrast approach for small-angle neutron scattering experiments, which enables a direct determination of the form factor at high concentrations. The observed particle size initially decreases strongly with the particle concentration in the dilute regime but approaches a constant value at intermediate concentrations. This is followed by a further deswelling at high concentrations above particle overlap. Theory and experiments point at a pivotal contribution of dangling polymer ends to the strong variation in size of ionic microgels, which presents itself mainly through the hydrodynamics properties of the system.
Introduction
Colloids are a popular model system to study various phenomena in condensed matter physics1–6 as length and time scales are significantly larger than for atomic systems. The latter provides access to a variety of structural and dynamic properties using methods such as neutron, X-ray and light scattering together with different optical microscopy techniques. The phase behaviour of spherical colloids has been extensively investigated with respect to number density, charge and external fields.1–3,7–9 While research mainly focused on (charged) hard sphere particles historically, soft colloidal particles have demonstrated a surprisingly rich and intriguing phase behaviour. Thus, both the theoretical and experimental focus has increasingly shifted towards soft repulsive colloids such as neutral poly(N-isopropylacrylamide), PNIPAM, microgels.10–13PNIPAM microgels are spherically-shaped polymeric networks with a radially inhomogeneous mass distribution. The particle softness can be controlled by varying the amount of added crosslinker during synthesis. Moreover, several properties of these particles can also easily be adjusted in situ, which originates from the multi-responsive nature of the polymer network towards different external stimuli. The most prominent one is the temperature; the initial hydrophobicity of the polymers vanishes below 32 °C and yields a swift transition from dense colloidal spheres to swollen microscopic hydrogels. Furthermore, the intrinsic soft interactions between the swollen particles enable packings to effective volume fractions, ϕeff, far above hard sphere close packing, ϕcp, where the centre-to-centre distance, as, can be smaller than the particle diameter. This has significant consequences for the resulting structural and dynamic properties of the system. Interesting equilibrium and non-equilibrium phases have been observed in theoretical as well as experimental studies of these systems.11,14,15
Ionic microgels contain charged groups which can be used to control inter-particle forces by means of pH or salt concentration. The interplay between the electrostatics and the soft-repulsive potential arising from the elasticity of the backbone could result in a very rich and complex phase behaviour.16,17 Attempts have been made to directly measure the (pH-dependent) pair potential in charged microgel systems,18 and it has been suggested that ionic microgels at low concentrations interact via an effective pair potential that crosses over from Yukawa-like, at large separation distances, to a soft-core interaction at shorter distances.19–23 A recent theoretical study on ionic microgels close to infinite dilution shows a significantly stronger repulsion upon deswelling at increased temperatures,24 which can be explained by the expulsion of counterions from the core upon deswelling.
Experiments on dilute ionic microgel suspensions have shown that the temperature-induced swelling behaviour is highly dependent on the ionic strength of the solvent.25 Specifically, in deionized systems the collapse temperature of the particles can shift several degrees Celcius.26 It has also been shown that ionic microgels shrink at higher particle concentrations,27 which is believed to be due to a decreasing ion-osmotic pressure gradient between the inside and the outside of the particles. The latter effect is absent in neutral PNIPAM colloids, for which a reduction in size is only observed at concentrations above overlap.28 To understand the complex interactions between particles in charged systems, a detailed understanding of the concentration-induced deswelling behaviour is pivotal. Attempts have been made by Romeo et al. to determine the deswelling of charged microgels upon raising the particle concentrations.29 In contrast to Holmqvist et al.27 these authors, however, reported on the absence of counter-ion induced deswelling at effective volume fractions below one.
To elucidate some of these seemingly contradictory findings, we have resorted to a combined experimental and theoretical study of the deswelling behaviour of ionic PNIPAM particles from very low concentrations to concentrations far above particle overlap. The experimental studies have been performed using a combination of light, neutron and X-ray scattering techniques. At high concentrations, small-angle neutron scattering (SANS), in combination with the zero average contrast (ZAC) approach, enables us to study single-particle properties, such as size and shape, regardless of their interactions. At concentrations that are too low for SANS, we rely on an analysis of static and dynamic structure factors from light and X-ray scattering. This combined analysis indicates a non-trivial relation between particle size and particle concentration. The experimental data can be analysed using traditional microgel models such as the fuzzy-sphere model, yet we also include a bottom-up approach that accounts for the heterogeneous crosslinker distribution in the microgel core as well as simulations of the dangling polymer ends. The observed deswelling behaviour observed with different experimental techniques may be explained by large differences between the static and hydrodynamic size of ionic microgels.
Experimental
Material
Ionic hydrogenated, Hm, and deuterated, Dm, PNIPAM particles were synthesised by precipitation polymerisation in the presence of surfactant in order to control the final size of the particles. Particles were synthesised in 85 g of water using N-isopropylacrylamide (NIPAM, Acros Organics) or d7-N-isopropylacrylamide (dNIPAM, Polymer Source) as the monomeric unit. N,N-Methylenebis(acrylamide) (BIS, Sigma-Aldrich) was used as a crosslinker and sodium dodecyl sulfate (SDS, Duchefa Biochemie) as a surfactant. In order to incorporate internal titratable charges, acrylic acid or deuterated acrylic acid (AA or dAA, Acros or Polymer Source) diluted in 10 g of water was added to the reaction mixture. Potassium persulfate (0.05 g dissolved in 5 g water, Sigma Aldrich) was used as initiator. Except for NIPAM, that was re-crystallised in hexane prior to use, all chemicals were used as received. The exact amount of the chemicals used can be looked up in Table 1. When deuterated particles were synthesised, the monomeric unit and the acrylic acid used were deuterated. The reactions were carried out in a three-necked round bottom flask under a constant flow of argon in combination with constant magnetic stirring at 250 rpm. The temperature was stabilised at 70 °C before the injection of initiator took place. The suspensions were left to react for 4 h at 70 °C and thereafter left to cool down over night in room temperature under constant stirring. The suspensions were filtered and then dialysed for 2 weeks against deionised water until the conductivity was found to be below 1 μS cm−1. The suspensions were thereafter freeze-dried in order to prepare samples with well-controlled weight fractions.| Particle name | NIPAM (g) | BIS (g) | AA (g) | SDS (g) | R h (nm, 20 °C) |
|---|---|---|---|---|---|
| Hm | 1.43 | 0.112 | 0.079 | 0.065 | 102 |
| Dm | 1.52 | 0.112 | 0.083 | 0.062 | 115 |
Methods
To achieve the lowest possible ionic strength, the samples were kept on ion-exchanging resins (Amberlite IRN 150, Fluka), except for the highly concentrated samples due to their high viscosity. The hydrodynamic radius, Rh, close to infinite dilution, as a function of temperature was obtained by means of dynamic light scattering using a modulated 3D light scattering instrument (LS instruments GmbH, Switzerland), implementing a laser with a wavelength of 660 nm. For these measurements the pH was lowered to 3.2, which renders the particles uncharged and prevents concentration induced deswelling effects. The data were obtained over an angular range of 40° ≤ θ ≤ 60° with a step size of 10° and analysed by a first-order cumulant analysis. Using static light scattering, and for both the Hm and Dm particle batches separately, we correlated the weight fraction with the number density by following the evolution of the structure peak with increasing particle concentration. This was performed in an angular range of 30° ≤ θ ≤ 130° and enabled us to make equal number density mixtures of Hm and Dm for the neutron scattering experiments from samples with known weight concentrations.Small-angle neutron scattering experiments were performed at D11 at Institut Laue-Langevin, ILL, France. The zero-average contrast (ZAC) solvent, e.g. the solvent in which Hm and Dm contribute to the scattered intensity equally, was evaluated by a contrast-variation study. The used amounts of H2O and D2O were varied for a fixed low number density of Hm and Dm particles, respectively. Due to the strong electrostatic repulsion between particles even in the dilute regime, the structure peaks were cancelled, as confirmed by static light scattering, by addition of 5 mM potassium chloride (KCl). The details of the determination of the ZAC solvent to be at 48 vol% of H2O in D2O can be found in the ESI† (Fig. S.1). A concentration series of equal density mixtures of Hm and Dm particles, was thereafter measured in the obtained ZAC solvent, without added salt, covering a wide span of concentrations at 20 °C in the fully deionised state. Small-angle X-ray scattering (SAXS) experiments were performed on the same samples as measured by SANS at the cSAXS beam line at Paul Scherrer institute, PSI, Switzerland. In the low-concentration regime, static and dynamic structure factors were obtained using the light-scattering instrument mentioned above over an angular range of 30° ≤ θ ≤ 150° using a step size of 2°.
Results
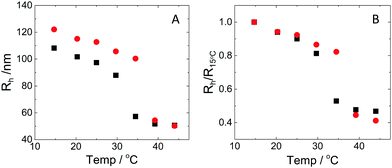
The hydrodynamic radius as a function of temperature was measured for both sets of uncharged particles at lowered pH (3.2) close to infinite dilution. The similarities in size can be seen in Fig. 1. Furthermore, the characteristic volume phase transition, VPT, at around 32 °C is captured for Hm particles while the VPT temperature for Dm particles is shifted up by approximately 5 °C due to the isotope effect. The absence of a structure factor peak in the SANS results in Fig. 2A demonstrates that the structure factors were adequately cancelled over a broad range of concentrations at 20 °C when the samples were prepared in the ZAC solvent.30 This enables us to proceed and determine the change in size and shape of individual particles. To cover the required q-range two instrumental settings were used, while the data from the two settings can be fitted simultaneously to form factors for microgel particles. We consider the fuzzy-sphere model | (1) |
 | (2) |
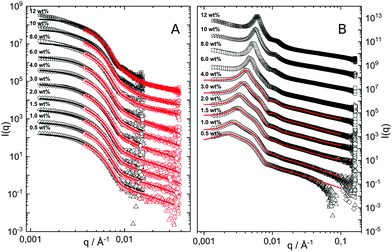 | ||
| Fig. 2 (A) SANS data obtained as a function of concentration, bottom to top. Solid lines are fits to the data using the fuzzy sphere model.10 The curves have been offset along the ordinate for clarity. (B) SAXS data obtained using the same samples as in A. The solid lines are fits to the data based on input information from A. The curves are offset along the ordinate for clarity. | ||
For consistency with previous experimental work, we initially based the fitting of the data on the fuzzy-sphere model. We require an additional Lorentzian function to account for polymer network fluctuations,
 | (3) |
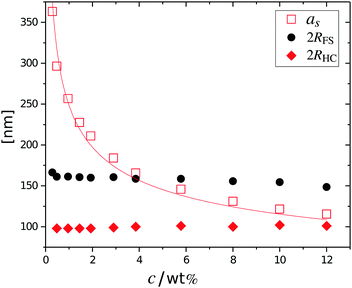
The cancelled structure peaks in the ZAC approach reappear again in the SAXS analysis shown in Fig. 2B. The size information from SANS were used as input parameters for the fitting procedures performed on the SAXS data. Here, we follow the same fitting procedure for the SAXS data as described by Westermeier et al.,32 for all concentrations up to 4 wt%, see solid lines in Fig. 2B. The q-dependent intensity, I(q), of the SAXS data can be described by I(q) ∝ P(q)S(q), where P(q) and S(q) are the form and structure factor, respectively. The S(q) was calculated using the modified penetrating background-corrected rescaled mean sphere approximation (MPB-RMSA) scheme used in previous publications.27,33 The input for the MPB-RMSA calculation is the number density, np, the particle charge, Zeff, salinity, csalt, and the total size of the particles, R. Since the primary peak position, qmax, of highly repulsive particles scales as qmax ∝ as−1 ∝ np−1/3, see the curve in Fig. 3, we can, from the determination of qmax of the SAXS data at different concentrations determine np. From this we deduce a relation between np and wt% to be np = 5.5 × 10⁻⁸ wt% for both the Hm and Dm particles, which allows us to determine np for every experimental weight concentration.34 It also enables an estimation of the molecular weight of the microgels, which is 1.14 × 10⁸ g mol−1, similar to reported molecular weights in work by Senff and Richtering.35 For comparison with the latter reference, the molar fraction of crosslinkers in the current work can be estimated at 5% with the values given in Table 1. By means of titration, we have determined the number of acid groups per particle to be Nacid = 1.1 × 10⁵ for both species, which corresponds well with estimates based on the molar fraction of acrylic acid during synthesis, which yields Nacid ≈ 8 × 10⁴.
The polydispersity for the SAXS data fits is reduced to 8% which is close to the value one gets from approximating the two particle size distributions with a single Gaussian distribution. The only other fitting parameter is Zeff, which is an effective charge that accounts for charge renormalization,19 giving a value of around 90e, where e refers to the elementary charge. Note, however, that for concentrations above 4 wt% the MPB-RMSA model can no longer reproduce the experimental S(q). This failure is most likely due to its use of a ‘hard’ core potential instead of a softer core interaction, which becomes particularly important at significant volume fractions. A more in-depth investigation of the influence of the core contribution is not covered by this paper.
The results from the form factor fits of the ZAC measurements are summarized in Fig. 3, diamonds, together with the center-to-center distances extracted from SAXS measurements.
While the fitted center-to-center distance as is changing with the expected ∝np−1/3 relation, the SANS and SAXS-data analysis indicates no change in size except for the largest concentrations. Specifically, the size of the particles seems not to be affected by the concentration until the center-to-center distance approaches the fitted fuzzy-sphere hard-core diameter 2RHC (red squares). At these larger concentrations, the fitted fuzzy-sphere particle size 2RFS is substantially smaller than the measured hydrodynamic radius close to infinite dilution (see Fig. 1). To bridge this gap with results at lower concentrations we therefore need additional analysis.
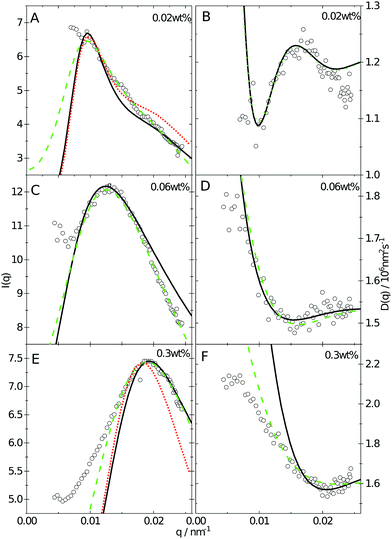
Since the flux of neutrons is insufficient to yield data with adequate statistics at low concentrations we turned to light-scattering methods instead. Here the static and dynamic structure factor peaks were fitted simultaneously in order to decouple the size and shape of the particles and their spatial arrangement. Specifically, we performed static (SLS) and dynamic (DLS) light scattering on concentrations below 0.6 wt%, where the primary peak of the structure factor, Sm(q), appears in the q-range of the light scattering measurements. The intensity auto-correlation function, g2(q,t) − 1, was measured throughout the whole light scattering q-range. To investigate the swelling behaviour at low particle concentrations we extract from theses measurements both the diffusive function, D(q), and the scattering intensity, I(q), from the light scattering measurements at concentrations between 0.5 and 0.005 wt%. The I(q) and D(q) for 0.3, 0.06 and 0.02 wt% are shown in Fig. 4 where the peak position of Sm(q), qmax, and the minima in D(q), D(qmax), can be clearly seen. This shows that there are still strong interactions at these low concentrations.
Even though the shape of both I(q) and D(q) looks as expected with respect to earlier SAXS measurements and previous investigations of microgels at low densities,27 the low-q part, q < qmax, indicates a substantial increase in I(q) as well as slower dynamics, as can be observed from D(q). We will use the δγ-approximation as used in ref. 36 and 37 to fit SLS data, I(q), and the DLS data, D(q), simultaneously by calculating D(q) through the hydrodynamic function, H(q), in the same way as in ref. 27. This approach, however, cannot capture our data at low q values while using the polydispersity determined from SAXS and SANS. As can be seen in Fig. 4, full black lines, the fitting deviates at low q values. This deviation is more pronounced with increasing concentrations, A to C to E in Fig. 4, and less pronounced for the dynamic measurements, see B, D and F in Fig. 4. The low-q deviation of the experimental data in both the static as well as the dynamic experiments can be largely captured through the addition of a phenomenological Ornstein–Zernike type contribution to the structure factor. Further investigation of this phenomenon could be of interest but is not the scope of this paper. This approach is, therefore, included in the ESI† (Fig. S.3). By ignoring the low-q-range and fitting the I(q) and D(q) data simultaneously for q ≥ qmax we recover the swelling trend as found in previous studies of charged microgels in low salinity.27 This suggests that, as the concentration is lowered below 0.5 wt%, the particles are getting increasingly larger.
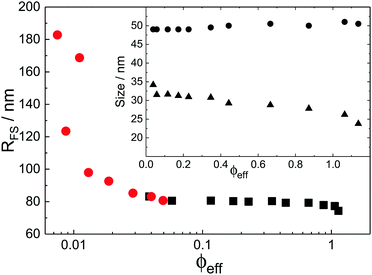
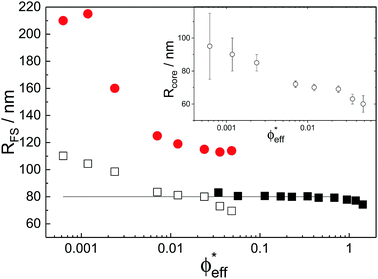
With the additional light-scattering data the extracted fuzzy-sphere sizes, RFS, throughout the full concentration regime can be plotted. This is shown in Fig. 5, where the inset shows the fitted parameters to the data. At low concentrations a strong decrease of particle size with increasing concentration is found. Yet, the size levels out at concentrations where light scattering and neutron data coincide and remains constant in the SANS regime. At the same time, the polydispersity does not increase with concentration, but rather slightly decreases. This is an indication that no anisotropic particle deformation takes place in the investigated concentration regime. The pH, which is a measure of the osmotic pressure generated by the counterions outside the particles, is found to decrease monotonically with increasing concentration, in line with the decrease of the ion-osmotic pressure difference between the particle interior and its exterior (included as Fig. S.2 in the ESI†). In this analysis, the radii from the light scattering are normalised by dividing by a factor of 1.21, and reflects the frequently reported discrepancy in measured size of fuzzy particles using either dynamic or static methods.10 Note that a difference in polydispersity-induced discrepancies between weighted averages, as is the case for SANS data, and z-averages, which applies to the DLS data, seems to be insufficient here. We investigated the electrostatic component of this discrepancy in more detail by adding salt to the system. The static size obtained from SANS and static light scattering showed no significant change in particle size whereas the dynamic size significantly decreased, and even coincided with the static size at the highest salt concentration. We refer to Fig. S.4 of the ESI† for these findings.
Theory and modeling
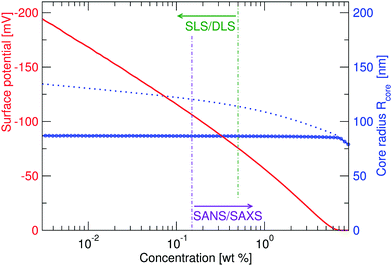
While a neutral microgel particle swells as a result of steric repulsions within the polymer backbone, the introduction of charged groups into the network can induce even larger swelling ratios. This additional swelling may be understood from the osmotic pressure, which should be the same inside and outside the network. Inside the microgel, this pressure has an ionic component resulting from the counterions that accompany the charged groups,38Πion, as well as a contribution from the net osmotic pressure generated by the hydrogel backbone itself, Πgel. Since the ion concentration outside the microgel is much smaller than inside, the increased ion-osmotic pressure inside should thus be accompanied by a negative contribution from the hydrogel backbone, which is accomplished by additional swelling of the microgel. This effect is more pronounced at low concentrations of microgels, as well as low salinities, as this renders the counterion concentration outside the gel small, and the gradient in ion-osmotic pressure, therefore, large. Generally, swelling a hydrogel (far) beyond its uncharged volume requires the ion-osmotic pressure to be of the same magnitude as the hydrogel bulk modulus K, which has been measured to be approximately 70 kPa for NIPAM hydrogels.39–41 The acidic groups, however, do not deprotonate much further once the pH reaches below the pK, which is ≈4.2 for acrylic acid. This yields a counterion pressure of approximately 4 kPa inside the particles, for which we use the estimated number of 1.1 × 10⁵ of acid groups per particle. Under normal circumstances the counterions would not be able to swell the hydrogel core beyond its ‘uncharged’ volume. Although that would explain the appearance of a plateau in particle size at intermediate densities, it would not explain the continued swelling at very low densities.It is tempting to assume that the re-entrant swelling at low concentrations could be a result of the heterogeneous crosslinking of the hydrogel core, as this produces a network that is more loosely crosslinked on the outside. In previous work the associated core-density profile ϕ(r) for neutral particles was derived from first principles,
 | (4) |
While the theoretical model above considers the swelling of the crosslinked core of the particle, the presence of dangling polymer ends has been ignored so far. In previous work we estimated the number of dangling ends in the corona of PNIPAM microgels to be of the order of thousands per particle.31 Although these chains constitute a minority of the total polymer mass, we have found indications that their ‘dangling’ nature may have a strong effect on the diffusive behaviour of the microgels. To separate this dynamics property from the ‘static’ information (i.e. form factor) we turn back to the light scattering data and re-fit the static data (SLS) only using the form factor from the heterogeneously-crosslinked core model described in eqn (2). The shape of this form factor is fully determined by the core size only which facilitates fitting in the limited q-range that was available. The SLS data are now refitted using the PBRMSA scheme. The experimentally determined number density is used when only fitting the SLS and the size of the particles in the PBRMSA scheme is kept the same as the radius in eqn (2). The only input from the D(q) is to super impose the minima. The latter approach improves on the earlier fit with the fuzzy-sphere model, as is demonstrated by the green and the black curves in Fig. 4A, C and E, corresponding to the heterogeneous-core fit and the fuzzy-sphere fit respectively. The open circles in the inset of Fig. 7 show this refitted core radius throughout the light-scattering regime. For convenience, we use the effective volume fraction ϕeff* here, which results from a ‘plateau’ radius of 80 nm (as shown by the solid line). To compare these sizes with the SANS results we re-fit the resulting core-density profiles with a fuzzy-sphere model, as indicated by the open squares in the main plot. This shows an extension of the plateau towards much lower concentrations and dramatically reduces the increase in size at the lowest concentrations. Note that a small increase in core size remains to be the best fit to the experimental data at these very low concentrations and one cannot rule out a minor core swelling beyond what is predicted by the network model. Specifically, the dotted curve in Fig. 4A and E shows the effect of forcing a constant core size of Rcore = 70 nm, while the dashed curves demonstrate the optimal fit within the q-range. Investigations on other charged microgels in this concentration regime may elucidate this further.
With the model and the new interpretation of the data suggesting that the crosslinked core largely resists additional swelling induced by the acrylic acid, we shift our focus to the behaviour of the dangling polymer chains. Due to the sharp decrease in crosslinker density towards ‘completion’ of the particle during synthesis, it may be estimated31 that there are a few tens of dangling chains with a very long contour length (>150 nm), while there may be hundreds of shorter chains (e.g. with a contour length >30 nm). To investigate whether the electric field generated by the core is strong enough to induce significant stretching of these dangling ends we perform Monte-Carlo simulations. Here, the dangling polymers are modeled as simple bead chains grafted on a single solid gel core. The bead–bead interactions were included through a standard hard-core interaction of monomers with a diameter of 0.26 nm, as our results did not seem to rely strongly on the choice of a more physical bead–bead potential such as a Lennard-Jones. The chain stiffness, i.e. the Kuhn length of PNIPAM,46 is included through a rotational-dependent bond energy given by kθ(1 − cos![[thin space (1/6-em)]](https://www.rsc.org/images/entities/char_2009.gif) θi) as in ref. 47, in which we set kθ = 7.5kT as the rigidity parameter. Here, cos
θi) as in ref. 47, in which we set kθ = 7.5kT as the rigidity parameter. Here, cos![[thin space (1/6-em)]](https://www.rsc.org/images/entities/char_2009.gif) θi = āi·āi−1, where āi is the unit vector in the direction of bond i. Note that the acrylic acid is also incorporated in the dangling polymer ends, which induces a repulsive interaction with the core. Following the standard Langmuir adsorbtion model48 one finds the cation-density dependent free energy of an acidic group f(r)/kT = log(1 + K/ρ+(r)), where ρ+(r) is the local counterion concentration that we obtain from cell model calculations. Note that f(r) reduces to the electrostatic energy of charged (uncharged) groups for high (low) values of K, when the Boltzmann relation ρ+(r) ∼ exp(−eΨ(r)/kT) is used. Note that the beads in simulations may extend beyond the maximum radius in the cell calculations of f(r). We therefore set f(r) = f(Rcell) for r > Rcell In simulations, the radius-dependent free energy of the beads was chosen proportional to f(r) to take account for the fact that the acidic groups constitute 9% of the monomers in the chain here. Cation profiles from the cell-model calculations were used to calculate the f(r) locally. In this way, the different microgel concentrations can be simulated independently using their associated profiles of f(r) that result from cell-model calculations at each concentration.
θi = āi·āi−1, where āi is the unit vector in the direction of bond i. Note that the acrylic acid is also incorporated in the dangling polymer ends, which induces a repulsive interaction with the core. Following the standard Langmuir adsorbtion model48 one finds the cation-density dependent free energy of an acidic group f(r)/kT = log(1 + K/ρ+(r)), where ρ+(r) is the local counterion concentration that we obtain from cell model calculations. Note that f(r) reduces to the electrostatic energy of charged (uncharged) groups for high (low) values of K, when the Boltzmann relation ρ+(r) ∼ exp(−eΨ(r)/kT) is used. Note that the beads in simulations may extend beyond the maximum radius in the cell calculations of f(r). We therefore set f(r) = f(Rcell) for r > Rcell In simulations, the radius-dependent free energy of the beads was chosen proportional to f(r) to take account for the fact that the acidic groups constitute 9% of the monomers in the chain here. Cation profiles from the cell-model calculations were used to calculate the f(r) locally. In this way, the different microgel concentrations can be simulated independently using their associated profiles of f(r) that result from cell-model calculations at each concentration.
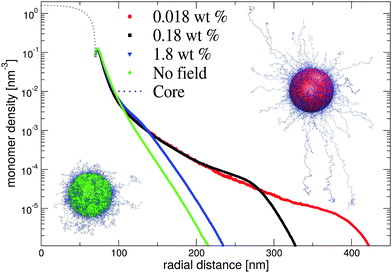
In Fig. 8, we show resulting dangling-end density profiles from simulations. The results of this approach indicate that the polymer density profile close to the core remains unaffected by variations of the microgel concentration. At the same time, the low-density tail of the profile demonstrates a strong response on changing their concentration. Interestingly, at intermediate and low microgel concentrations the longer chains seem to favour a porcupine-like configuration, indicated by a nonzero polymer density profile that extends over much longer distances than in the neutral case. On the other hand, for the larger weight fraction c ≈ 1 wt% the profile displays the same characteristics as without electric fields. This observed behaviour is confirmed by snapshots of the simulations, which clearly shows the porcupine-like configuration at lower weight fractions. We conclude that the latter state, which minimizes the electrostatic-energy configuration of the dangling ends, can be reached in experiments despite the associated entropic penalty of chain stretching. The strong deionization may be pivotal for the occurrence of the porcupine state as this permits the electric field to extend relatively far from the core before being screened.
Configurational changes in the dangling ends will unlikely be visible in static (light) scattering data due to their minor contribution to the total scattered intensity of the microgels. The dangling-end density profiles may, however, set the diffusive behaviour of the particles. We thus turn back to the extracted diffusion coefficients as shown in Fig. 4B, D, and F. Contrary to our earlier approach, this time we enable the dynamic radius to vary from the SLS radius. Specifically, the parameter d0 is fitted independently of other fit parameters in order to superimpose the calculated D(q). Releasing the restriction of matching the static and the hydrodynamic size, we now also choose to not correct the latter by scaling with a factor of 1.21 as before. Following this approach, a very large discrepancy between the hydrodynamic size and the static size emerges, as the filled circles in Fig. 7 indicate. We conclude that the charge-induced swelling at low density predominantly expresses itself as a hydrodynamic effect, which likely results from a configurational change in the dangling ends induced by an increased electrostatic repulsion from the core. Note that this hydrodynamic size does not correspond to a microscopic property of the particle that can be measured directly in a static scattering or microscopy experiment, yet it enables interpreting the hydrodynamic friction coefficient as an effective sphere size. However, we currently lack a full quantitative model that would allow us to calculate the additional contribution to the overall friction coefficient of the microgels that results from the extended configuration of the dangling polymer chains, and thus a quantitative calculation of the hydrodynamic radius remains rather difficult for now. Although Fig. 8 shows that significant stretching of the longest chains sets in at intermediate volume fractions, the exact relation between hydrodynamic size and concentration will require a more detailed approach towards the hydrodynamic effect of the dangling ends. From the experimental side it would be interesting to probe the properties of the dangling ends in situ to elucidate their effect on hydrodynamic properties of the microgel in both its neutral and charged state.
Conclusion
The deswelling behaviour of soft microgel particles is an extensively discussed topic in the soft-matter community. The intrinsic particle softness and the responsive nature of the polymer network towards external stimuli rises questions about whether the particles interpenetrate or compress upon increasing the number density. Here we report our results on the deswelling behaviour of ionic PNIPAM particles spanning a large concentration regime. For this purpose we use a combination of the analysis of static and dynamic structure factors obtained with static and dynamic light scattering and small-angle X-ray scattering, and the zero average contrast approach in small-angle neutron scattering. The ZAC experiments enable us to cancel the structure factor contribution to the total scattering intensity, giving direct access to the form factors. The structure factors are later recovered by means of small-angle X-ray scattering. We demonstrate that a significantly increased apparent size of the particles at very low concentrations can be attributed to the presence of charge in the polymer backbone. At intermediate concentrations the size remains, however, constant up to the point were particles are significantly overlapping. Then, at concentrations above shell overlap the particle size is again found to decrease without any sign of particle deformation. The plateau in the particle size as observed with SANS at intermediate concentrations could not be explained by modelling the swelling of the heterogeneously crosslinked hydrogel core. Instead, we have found that the dangling ends may be pivotal for the observed increase in size. Specifically, the charge-induced configurational changes of those polymers in favour of a ‘porcupine’ state may increase the hydrodynamic size while leaving the static scattering profiles largely unaffected. The latter is also consistent with discrepancies between SANS and DLS measurements, indicating a large discrepancy between the static size and the hydrodynamic size of ionic microgels. There remain, however, a few open questions. We currently lack a model to explain the additional low-q scattering contribution that we observe at very low concentrations. While some of the observed features still need further work to explain them quantitatively, a comparison between the characteristic inter-particle distance at high effective volume fractions and the measured particle radii clearly indicate that significant particle interpenetration must occur to explain these data. This raises questions about previous interpretations of rheological data, and further studies are needed on systems comparable to the one studied here.Conflicts of interest
There are no conflicts to declare.Acknowledgements
This work was financed through the Knut and Alice Wallenberg Foundation (project grant KAW 2014.0052), the Swedish Research Council (Project 2014-4037) and the European Research Council (ERC-339678-COMPASS). SANS experiments were conducted at the instrument D11 at the Institute Laue Langevin, and the SAXS experiments were performed at the cSAXS beam line of the Swiss Light Source SLS at Paul Scherrer Institute. We gratefully acknowledge the help of the local contacts J. Han and I. Rajkovic at cSAXS. The authors acknowledge financial support from the European Commission under the Seventh Framework Program by mean of the grant agreement for the Integrated Infrastructure Initiative No. 262348, European Soft Matter Infrastructure (ESMI).References
- P. N. Pusey and W. V. Megen, Nature, 1986, 320, 340 CrossRef CAS.
- E. B. Sirota, H. D. Ou-Yang, S. K. Sinha, P. M. Chaikin, J. D. Axe and Y. Fujii, Phys. Rev. Lett., 1989, 62, 1524 CrossRef CAS PubMed.
- Y. Monovoukas and A. P. Gast, J. Colloid Interface Sci., 1989, 128, 533 CrossRef CAS.
- A. van Blaaderen and P. Wiltzius, Science, 1995, 270, 1177 CAS.
- E. R. Weeks, J. C. Crocker, A. C. Levitt, A. Schofield and D. A. Weitz, Science, 2000, 287, 627 CrossRef CAS PubMed.
- E. Zaccarelli, C. Valeriani, E. Sanz, W. C. K. Poon, M. E. Cates and P. N. Pusey, Phys. Rev. Lett., 2009, 103, 135704 CrossRef CAS PubMed.
- U. Dassanayake, S. Fraden and A. van Blaaderen, J. Chem. Phys., 2000, 112, 3851 CrossRef CAS.
- A. Yethiraj and A. van Blaaderen, Nature, 2003, 421, 513 CrossRef CAS PubMed.
- A.-P. Hynninen and M. Dijkstra, Phys. Rev. E: Stat., Nonlinear, Soft Matter Phys., 2005, 72, 051402 CrossRef PubMed.
- M. Stieger, W. Richtering, J. S. Pedersen and P. Lindner, J. Chem. Phys., 2004, 120, 6197 CrossRef CAS PubMed.
- J. C. Pámies, A. Cacciuto and D. Frenkel, J. Chem. Phys., 2009, 131, 44514 CrossRef PubMed.
- D. M. Heyes and A. C. Branka, Soft Matter, 2009, 5, 2681 RSC.
- L. Berthier, A. J. Moreno and G. Szamel, Phys. Rev. E: Stat., Nonlinear, Soft Matter Phys., 2010, 82, 060501 CrossRef PubMed.
- H. Senff and W. Richtering, J. Chem. Phys., 1999, 111, 1705 CrossRef CAS.
- D. Paloli, P. S. Mohanty, J. J. Crassous, E. Zaccarelli and P. Schurtenberger, Soft Matter, 2012, 9, 3000 RSC.
- D. Gottwald, C. N. Likos, G. Kahl and H. Löwen, Phys. Rev. Lett., 2004, 92, 068301 CrossRef CAS PubMed.
- P. S. Mohanty and W. Richtering, J. Phys. Chem. B, 2008, 112, 14692 CrossRef CAS PubMed.
- J. K. Cho, Z. Meng, L. A. Lyon and V. Breedveld, Soft Matter, 2009, 5, 3599 RSC.
- A. R. Denton, Phys. Rev. E: Stat., Nonlinear, Soft Matter Phys., 2003, 67, 011804 CrossRef CAS PubMed.
- T. Eckert and W. Richtering, J. Chem. Phys., 2008, 129, 124902 CrossRef PubMed.
- J. Crassous, M. Siebenbürger, M. Ballauff, M. Drechsler, O. Henrich and M. Fuchs, J. Chem. Phys., 2006, 125, 204906 CrossRef CAS PubMed.
- Z. Meng, J. K. Cho, S. Debord, V. Breedveld and L. A. Lyon, J. Phys. Chem. B, 2007, 111, 6992–6997 CrossRef CAS PubMed.
- J. Riest, P. Mohanty, P. Schurtenberger and C. N. Likos, Z. Phys. Chem., 2012, 226, 711 CrossRef CAS.
- A. Moncho-Jorda, J. Chem. Phys., 2013, 139, 064906 CrossRef CAS PubMed.
- D. Caprilse-Gonzalez, B. Sierra-Martin, A. Fernandez-Nieves and A. Fernandez-Barbero, J. Phys. Chem. B, 2008, 112, 12195 CrossRef PubMed.
- K. Kratz, T. Hellweg and W. Eimer, Colloids Surf., A, 2000, 170, 137 CrossRef CAS.
- P. Holmqvist, P. S. Mohanty, G. Nägele, P. Schurtenberger and M. Heinen, Phys. Rev. Lett., 2012, 109, 048302 CrossRef CAS PubMed.
- P. S. Mohanty, S. Nöjd, K. van Gruijthuijsen, J. J. Crassous, M. Obiols-Rabasa, R. Schweins, A. Stradner and P. Schurtenberger, Sci. Rep., 2017, 7, 1487 CrossRef PubMed.
- G. Romeo, L. Imperiali, J. W. Kim and A. Fernandez-Nieves, J. Chem. Phys., 2012, 136, 124905 CrossRef PubMed.
- L. Willner, O. Jucknischke, D. Richter, J. Roovers, L.-L. Zhou, P. M. Toporowski, L. J. Fetters, J. S. Huang, M. Y. Lin and N. Hadjichristidis, Macromolecules, 1994, 27, 3821 CrossRef CAS.
- N. Boon and P. Schurtenberger, Phys. Chem. Chem. Phys., 2017, 19, 23740 RSC.
- F. Westermeier, B. Fischer, W. Roseker, G. Grübel, G. Nägele and M. Heinen, J. Chem. Phys., 2012, 137, 114504 CrossRef PubMed.
- M. Heinen, P. Holmqvist, A. J. Banchio and G. Nägele, J. Chem. Phys., 2011, 134, 044532 CrossRef PubMed.
- J. Liu, H.-J. Schöpe and T. Palberg, Part. Part. Syst. Charact., 2000, 17, 206 CrossRef CAS.
- H. Senff and W. Richtering, Colloid Polym. Sci., 2000, 278, 830–840 CAS.
- C. W. J. Beenakker and P. Mazur, Physica A, 1983, 120, 388 CrossRef.
- C. W. J. Beenakker, Physica A, 1984, 128, 48 CrossRef.
- M. M. Hedrick, J. K. Chung and A. R. Denton, J. Chem. Phys., 2015, 142, 034904 CrossRef PubMed.
- B. R. Saunders and B. Vincent, J. Chem. Soc., Faraday Trans., 1996, 92, 3385 RSC.
- P. A. L. Fernandes, S. Schmidt, M. Zeiser and T. Hellweg, Soft Matter, 2010, 6, 3457 Search PubMed.
- S. Schmidt, M. Zeiser, T. Hellweg, C. Duschl, A. Fery and H. Möhwald, Adv. Funct. Mater., 2010, 20, 3235 CrossRef CAS.
- T. L. Hill, Statistical Mechanics, Addison-Wesley, 1960 Search PubMed.
- H. Wennerström, B. Jönsson and P. Linse, J. Chem. Phys., 1982, 76, 4665 CrossRef.
- P. Das and S. Bhattacharjee, Langmuir, 2005, 21, 4755–4764 CrossRef CAS PubMed.
- A. R. Denton and Q. Tang, J. Chem. Phys., 2016, 145, 164901 CrossRef PubMed.
- K. Kubota, Polym. J., 1990, 22, 1051 CrossRef CAS.
- R. Auhl, R. Everaers, G. Grest, K. Kremer and S. Plimpton, J. Chem. Phys., 2003, 119, 12718–12728 CrossRef CAS.
- I. Langmuir, J. Am. Chem. Soc., 1918, 40, 1361–1403 CrossRef CAS.
Footnotes |
| † Electronic supplementary information (ESI) available: Determination of the ZAC solvent, information on the measured pH, as well as the effect of salt on particle size is included. Fits to the light-scattering data using an additional Ornstein–Zernike like contribution, as referred to in the main text, is included as well. See DOI: 10.1039/c8sm00390d |
| ‡ Current address: CR Competence AB, SE-22362 Lund, Sweden. |
| This journal is © The Royal Society of Chemistry 2018 |

