Co-precipitation synthesis and photoluminescence properties of BaTiF6:Mn4+: an efficient red phosphor for warm white LEDs†
Yong
Liu
a,
Guojun
Gao
 b,
Lin
Huang
a,
Yiwen
Zhu
a,
Xuejie
Zhang
a,
Jinbo
Yu
a,
Bryce S.
Richards
 bc,
Tongtong
Xuan
 a,
Zhengliang
Wang
 *d and
Jing
Wang
 *a
*a
aMinistry of Education Key Laboratory of Bioinorganic and Synthetic Chemistry, State Key Laboratory of Optoelectronic Materials and Technologies, School of Chemistry, School of Materials Science and Engineering, Sun Yat-Sen University, Guangzhou, 510275, P. R. China. E-mail: ceswj@mail.sysu.edu.cn
bInstitute of Microstructure Technology, Karlsruhe Institute of Technology (KIT), Hermann-von-Helmholtz-Platz 1, 76344 Eggenstein-Leopoldshafen, Germany
cLight Technology Institute, Karlsruhe Institute of Technology, Engesserstrasse 13, 76131 Karlsruhe, Germany
dKey Laboratory of Comprehensive Utilization of Mineral Resources in Ethnic Regions, Joint Research Centre for International Cross-border Ethnic Regions Biomass Clean Utilization in Yunnan, School of Chemistry & Environment, Yunnan Minzu University, Kunming, 650500, P. R. China. E-mail: wangzhengliang@foxmail.com
First published on 24th November 2017
Abstract
The investigation of efficient red phosphors is highly desired for the development of novel warm white light emitting diodes (WLEDs). In this paper, we report on an efficient red phosphor of Mn4+-activated BaTiF6 by a facile co-precipitation method as a promising candidate for warm white LEDs. BaTi1−xF6:xMn4+ phosphors show efficient pure red emission with a high quantum yield (QY) of 44.5% under 460 nm excitation. The BaTi1−xF6:xMn4+ phosphor exhibits a number of advantages. Firstly, the corresponding excitation/absorption profile matches the commercial blue LED chip well. Secondly, it also exhibits appropriate CIE coordinates (x = 0.694, y = 0.306) with an activation energy of 0.603 eV. The demonstration of a blue chip combined with a blend of yellow-emitting YAG:Ce3+ and newly developed BaTi0.97F6:0.03Mn4+ red phosphor greatly improved the colour rendering index (CRI) from 69.9 to 83.5, while significantly decreasing the correlated colour temperature (CCT) from 5088 to 4213 K, thus validating their application in warm white LEDs.
Introduction
Over the last few decades, WLEDs have been studied and widely applied in display backlighting, indoor and outdoor lighting, architectural lighting and indicator lights, due to their extraordinary luminous efficiency, low energy consumption, compactness, long operation lifetime and environmental friendliness.1–3 The combination of a blue-emitting LED chip with yellow YAG:Ce3+-based phosphors is commonly used to obtain white light.4–7 However, such WLEDs exhibit the disadvantages of low CRI, high CCT and chromaticity drifts due to the red deficiency of the white-light spectrum.8 To overcome these shortcomings, a red phosphor must be integrated into the packages of WLEDs, which will then enable the realisation of a warm white emission with high CRI (>80) and low CCT (<4000 K).9–11Currently, most commercial red-emitting phosphors are based on Eu2+ activated nitrides, such as CaAlSiN3:Eu2+ and Sr2Si5N8:Eu2+, which exhibit excellent thermal stability and efficient luminescence.12–14 Nevertheless, these nitride phosphors still have inherent disadvantages: (1) a significant portion of the broadband emission is beyond the long-wavelength sensitivity limit of the human eye, which decreases the luminous efficacy (LE) of radiation; (2) the synthesis method requires extremely rigorous conditions (high temperature and a reducing atmosphere). Moreover, many researchers worldwide have been devoted to developing red-emitting phosphors, which may be suitable for white LEDs, including oxides, sulfides, organic compounds, etc.15–22 Therefore, there is still an opportunity to develop a novel and robust red phosphor that demonstrates efficient and intense emission under blue excitation around 460 nm.
Fluorides are an ideal luminescence substrate because of their high thermal stability, structural diversity and low phonon energy.23–25 Recently, Mn4+-activated red fluoride phosphors have gained significant research interest because of their narrow band emission from 600 to 650 nm under blue light excitation.26,27 Various synthesis techniques have been developed to prepare Mn4+-doped alkaline/alkaline earth hexafluoride phosphors, such as A2XF6:Mn4+ and BaXF6:Mn4+ (A = K, Na, Cs, Rb or NH4; X = Si, Ge, Sn or Ti), including wet chemical etching routes, hydrothermal methods, chemical co-precipitation and cation exchange reactions.28–43 Adachi et al. prepared BaTiF6:Mn4+ by etching titanium sponge and BaF2 in HF/H2SiF6/KMnO4 solution for about 6 h, and studied its photo-luminescence (PL) properties.29 However, an impurity phase was discovered in the as-synthesised products, which is probably due to the use of H2SiF6. In addition, BaTiF6:Mn4+ was also obtained by a hydrothermal method at 120–180 °C for 5–20 h, which showed high emission efficiency.32–37 However, this method has problems in controlling the valence states of manganese in the host. More recently, Zhu et al. firstly reported a high-efficiency red phosphor, K2TiF6:Mn4+, synthesised via a cation exchange method of soaking K2TiF6 in a HF/K2MnF6 mixed solution at room temperature for 20 min.42 Liu et al. demonstrated a simple co-precipitation method to synthesize K2MF6:Mn4+ (M = Ge, Si) and Na2SiF6:Mn4+ with K2MnF6 as a manganese source.31,44 These strategies can obtain red phosphors with exceedingly high emission efficiency, high colour purity and admirable thermal stability. More importantly, the method is simple and has demonstrated good repeatability, low cost and high yield. However, to the best of our knowledge, there are few reports on Ba2TiF6:Mn4+ prepared by the co-precipitation method as a red phosphor for warm WLED applications.
Herein, we report an efficient co-precipitation method by using K2MnF6 as a manganese source for the preparation of a series of Mn4+-doped BaTiF6 phosphors. We study their crystal structure, luminescence properties, diffuse reflectance spectra, PL decay curves and thermal quenching behaviour. We also successfully obtained WLEDs via a blend of red-emitting BaTiF6:Mn4+ and yellow-emitting YAG:Ce3+ phosphors together with a blue LED chip, and investigated their optical properties. All the results demonstrate that the red-emitting BaTiF6:Mn4+ phosphor has great potential for applications in warm WLEDs.
Experimental
Materials
All the reagents including titanium dioxide (TiO2), Barium fluoride (BaF2), hydrofluoric acid (HF), potassium hydrogen fluoride (KHF2), potassium permanganate (KMnO4) and hydrogen peroxide (H2O2) are of analytical grade and commercially available.Synthesis of the K2MnF6 precursor and BaTiF6:Mn4+ phosphors
K2MnF6 was synthesized by the previously reported method.45 Specifically, 9 g of KHF2 and 0.45 g of KMnO4 were fully dissolved in 30 ml HF (40 wt%) solution. After 30 min of stirring, 0.3 ml of H2O2 (30 wt%) was slowly added to precipitate the K2MnF6 yellow powders. The obtained precipitate was filtered and washed with acetone and oven-dried at 80 °C for 2.0 h.Powder samples of BaTi1−xF6:xMn4+ (x = 0.005, 0.01, 0.02, 0.03, 0.04, 0.05, 0.06) were synthesised using the co-precipitation method at room temperature. Typically, 2.5 mmol of TiO2 was fully dissolved in 5 ml of 40% HF solution. Subsequently, 0.075 mmol of K2MnF6 was put into the above solution under vigorous stirring. Then, 2.5 mmol of BaF2 was gradually added into the mixed solution, which was kept for 30 min under continuous stirring. At last, the precipitate BaTi0.97F6:0.03Mn4+ was filtered, washed with methanol several times and dried at 80 °C for 2 hours. Additional samples with different Mn4+ concentrations were synthesized using similar procedures.
Fabrication of WLED devices
WLEDs were fabricated by integrating a mixture of transparent silicone resin and the phosphor blend of red-emitting BaTi0.97F6:0.03Mn4+ and yellow-emitting YAG:Ce3+ (the ratio of mass is 11![[thin space (1/6-em)]](https://www.rsc.org/images/entities/char_2009.gif) :
:![[thin space (1/6-em)]](https://www.rsc.org/images/entities/char_2009.gif) m
m![[thin space (1/6-em)]](https://www.rsc.org/images/entities/char_2009.gif) :
:![[thin space (1/6-em)]](https://www.rsc.org/images/entities/char_2009.gif) 1, m = 0 or 11) on a blue LED chip (450–460 nm, 3.0–3.4 V, 350 mA, Shenzhen VANO Technology Co., Ltd). After vacuum treatment to remove air bubbles, the mixture was coated on the lead frame and subsequently heated at 100 °C for 1 h and 150 °C for 3 h.
1, m = 0 or 11) on a blue LED chip (450–460 nm, 3.0–3.4 V, 350 mA, Shenzhen VANO Technology Co., Ltd). After vacuum treatment to remove air bubbles, the mixture was coated on the lead frame and subsequently heated at 100 °C for 1 h and 150 °C for 3 h.
Characterization
The phase purity of the as-prepared phosphors was measured by a Rigaku D/MAX-200 X-ray diffractometer operating at 40 kV, 26 mA with Cu Kα radiation (λ = 1.5405 Å). The morphology and elemental analysis measurements of the samples were analyzed via scanning electron microscopy (SEM, FEI Quanta 200 Thermal FE environmental scanning electron microscopy) equipped with an energy dispersive X-ray spectroscope (EDS). Diffuse reflection spectra of these samples were taken on an ultraviolet-visible–near-infrared (UV-vis-NIR) spectrophotometer (Varian Cary 5000). The photoluminescence excitation (PLE) and PL spectra within the temperature range 300–500 K together with the decay curves were measured using time-resolved and steady-state spectrometry (Edinburgh Instruments FSP920 equipped with a 450 W Xe lamp, a 60 W μF 900 μs flash lamp, TM300 excitation monochromator and double TM300 emission monochromators, and thermo-electric cooled red-sensitive PMT). For PL measurements above room temperature (RT), the sample was mounted in an Oxford OptistatDN2 nitrogen cryostat. The photoluminescence quantum yield (QY) of the sample was measured using a commercial spectrometer equipped with an integrating sphere of 3.3 inches in radius (Hamamatsu, C9920-02). The electroluminescence (EL) spectra and photoelectric properties including LE, CCT, CIE chromaticity coordinates and CRI of the fabricated WLEDs were evaluated using a Labsphere CDS2100 spectrometer and Labsphere LPS-100-0260 power supply.Results and discussion
Structure and morphology
The powder XRD patterns of the BaTiF6:Mn4+ phosphors are shown in Fig. 1a. The diffraction peaks of seven samples with different Mn4+ doping concentrations coincide well with the standard JCPDS card of rhombohedral BaTiF6 (No. 76-0269, space group of R![[3 with combining macron]](https://www.rsc.org/images/entities/char_0033_0304.gif) m) without any impurity phase, thus indicating their high phase purity. Additionally, doping Mn4+ ions in BaTiF6 did not cause any visible change of crystal structure evidencing the incorporation of Mn4+ in the BaTiF6 host. A schematic diagram of the BaTiF6 crystal structure is shown in Fig. 1b. The Ti4+ ions are located at the centre of the TiF6 octahedra and their connection with Ba2+ ions is through ionic bonding. According to the database of Shannon's ionic radii, the effective ionic radii of the Mn4+ ion and Ti4+ ion in an octahedral environment are 53 pm and 60.5 pm, respectively.46 Thus, due to their similar ionic radii and matching valency, the Mn4+ ion prefers to occupy the Ti4+ site to form the luminescence centre.
m) without any impurity phase, thus indicating their high phase purity. Additionally, doping Mn4+ ions in BaTiF6 did not cause any visible change of crystal structure evidencing the incorporation of Mn4+ in the BaTiF6 host. A schematic diagram of the BaTiF6 crystal structure is shown in Fig. 1b. The Ti4+ ions are located at the centre of the TiF6 octahedra and their connection with Ba2+ ions is through ionic bonding. According to the database of Shannon's ionic radii, the effective ionic radii of the Mn4+ ion and Ti4+ ion in an octahedral environment are 53 pm and 60.5 pm, respectively.46 Thus, due to their similar ionic radii and matching valency, the Mn4+ ion prefers to occupy the Ti4+ site to form the luminescence centre.
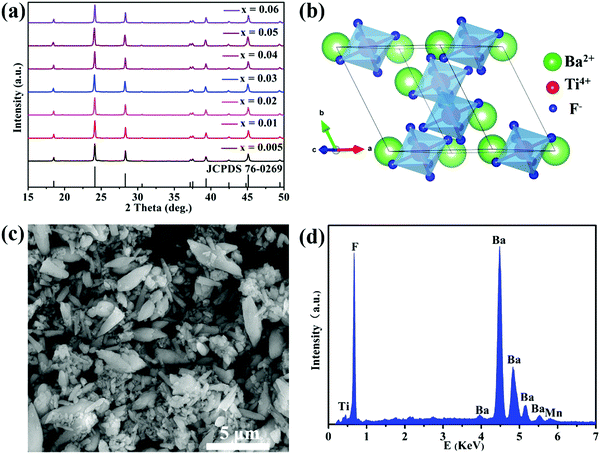 | ||
| Fig. 1 (a) XRD patterns of BaTi1−xF6:xMn4+ phosphors synthesized with different Mn4+ concentrations. (b) Crystal structure scheme of BaTiF6. (c) SEM image and (d) EDS spectrum of BaTi0.97F6:0.03Mn4+. | ||
The SEM image and EDS spectrum of BaTi0.97F6:0.03Mn4+ are shown in Fig. 1c and d. The SEM image exhibits irregularly-shaped micrometer-sized particles ranging from ∼1 to 5 μm. The corresponding EDS spectrum confirms that the main chemical elements present are Ba, Ti, F and Mn. The atomic percentages of Ba, Ti, and F are about 17%, 13%, and 69%, respectively, which is close to the BaTiF6 stoichiometric atom ratio of 1![[thin space (1/6-em)]](https://www.rsc.org/images/entities/char_2009.gif) :
:![[thin space (1/6-em)]](https://www.rsc.org/images/entities/char_2009.gif) 1
1![[thin space (1/6-em)]](https://www.rsc.org/images/entities/char_2009.gif) :
:![[thin space (1/6-em)]](https://www.rsc.org/images/entities/char_2009.gif) 6. These results further indicate that the Mn4+ ion-doped BaTiF6 products were successfully synthesized by the co-precipitation approach.
6. These results further indicate that the Mn4+ ion-doped BaTiF6 products were successfully synthesized by the co-precipitation approach.
Optical properties
The room temperature PLE and PL spectra of the BaTiF6:Mn4+ samples are given in Fig. 2a. By monitoring the characteristic emission of Mn4+ ions at 631 nm, the PLE spectrum is observed to span a very broad spectral region from 300 to 550 nm. The two maxima exhibited at 360 nm and 460 nm are assigned to the 4A2g → 4T1g and 4A2g → 4T2g transitions of Mn4+ ions, respectively. Under 460 nm excitation, the PL spectrum is composed of a series of sharp peaks around 600–650 nm due to the 2Eg → 4A2g transition of Mn4+, similar to that of BaTiF6:Mn4+ prepared via the hydrothermal method.33,37 Furthermore, the body colour of the phosphors is light orange under natural light in reflectance of the strong absorption of Mn4+ in the visible region (Fig. 2b and Fig. 4). Upon UV lamp illumination (365 nm), the phosphors exhibit brilliant red luminescence (Fig. 2c).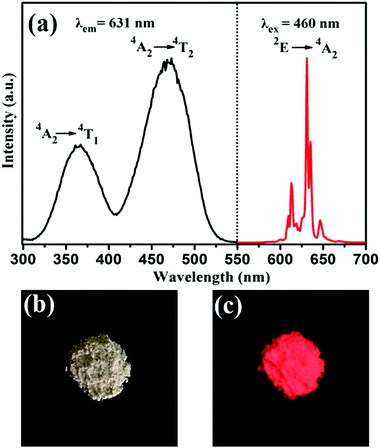 | ||
| Fig. 2 (a) PLE (λem = 631 nm) and PL (λex = 460 nm) spectra of the synthesized BaTiF6:Mn4+ phosphor. Photographs of BaTiF6:Mn4+ taken under illumination of (b) natural light and (c) 365 nm UV lamp. | ||
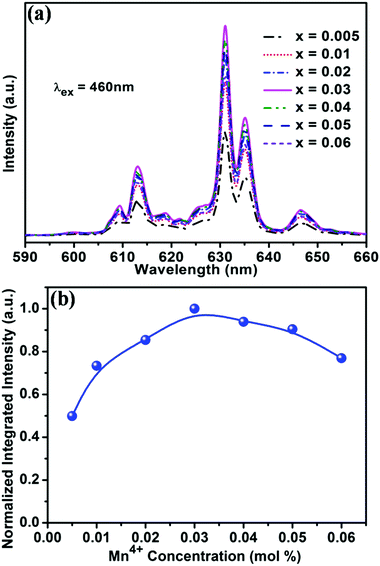
In order to optimise the doping concentration of Mn4+ ions, Fig. 3a shows the PL spectra of the BaTi1−xF6:xMn4+ (x = 0.005, 0.01, 0.02, 0.03, 0.04, 0.05, 0.06) samples excited at 460 nm, and the normalized integrated PL intensity of BaTi1−xF6:xMn4+ samples as a function of Mn4+ doping concentration are shown in Fig. 3b. With increasing Mn4+ content, the intensity of the emission peaks gradually increases and reaches the maximum at the Mn4+ concentration of x = 0.03, and then decreases with further increasing of the Mn4+ doping concentration due to the concentration quenching effect.47 The internal QY of the BaTi0.97F6:0.03Mn4+ sample was measured to be 44.5% under 460 nm light excitation (Fig. S2, ESI†). The CIE chromaticity coordinates of the emission from BaTi0.97F6:0.03Mn4+ were calculated to be (0.69, 0.31), which are very close to the NTSC standard values for red (x = 0.67, y = 0.33). Meanwhile, BaTi0.97F6:0.03Mn4+ red phosphors were synthesized using a hydrothermal method at 150 °C for 12 h (Fig. S1, ESI†). Comparatively, the PL intensity of the obtained BaTi0.97F6:0.03Mn4+ phosphor using the coprecipitation method is better than that using the hydrothermal method, almost 3.6 times higher (Fig. S1, ESI†).
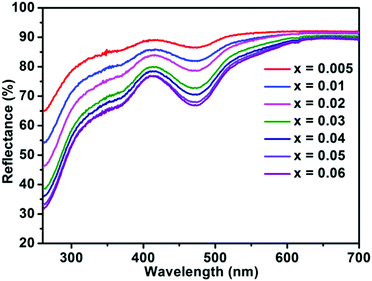
The diffuse reflectance spectra of BaTi1−xF6:xMn4+ with different concentrations of Mn4+ are presented in Fig. 4. The results are fully consistent with the PLE spectra of BaTiF6:Mn4+ in Fig. 2a, with two broad absorption bands in the spectral region of 300–410 nm and 410–550 nm with maxima at ∼360 and 460 nm observed, which are attributed to the 4A2g → 4T1g and 4A2g → 4T2g transitions of Mn4+, respectively. As expected, the absorption intensity of Mn4+ increased with increasing Mn4+ ion concentration.
Determining the PL lifetime is an important factor for phosphors, as it depends strongly on the activator concentration. The PL decay curves of the BaTi1−xF6:xMn4+ phosphors (x = 0.005, 0.01, 0.02, 0.03, 0.04, 0.05, 0.06) excited at 460 nm and monitored at 631 nm are plotted in Fig. 5. The PL decay curves were well fitted with a single-order exponential decay mode by the following equation:48
| It = I0 exp(−t/τ) | (1) |
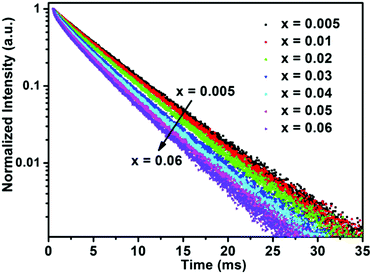 | ||
| Fig. 5 PL decay curves of BaTi1−xF6:xMn4+ phosphors with different Mn4+ concentrations upon monitoring at 631 nm with the excitation of 460 nm. | ||
Temperature quenching properties
It is well known that thermal stability is a vital factor of phosphors for LED applications. Fig. 6a shows the temperature dependent emission spectra of the BaTi0.97F6:0.03Mn4+ phosphor under excitation at 460 nm, and the relative emission intensity as a function of temperature is shown in the inset of Fig. 6a. It is noticeable that the phosphor exhibits similarly-shaped emission spectra, however there are obvious differences in the relative intensities of the peaks. When the temperature increases from 300 to 500 K, the PL intensity gradually decreases due to thermal quenching. Interestingly, compared to room temperature (300 K), the phosphor at 425 K retains 46% of its initial intensity. To better understand the thermal quenching behaviour, the Arrhenius equation was applied to calculate the activation energy as follows:49–52 | (2) |
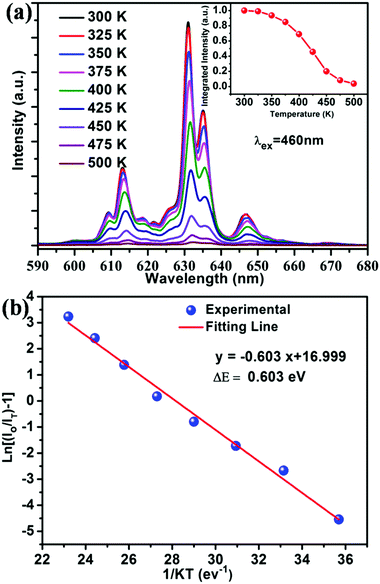 | ||
| Fig. 6 (a) PL spectra (λex = 460 nm) of the BaTi0.97F6:0.03Mn4+ phosphor measured within the temperature range of 300–500 K. The inset exhibits the normalized PL intensity as a function of temperature. (b) Monolog plot of ln[(I0/IT) − 1] versus 1/kT for the BaTi0.97F6:0.03Mn4+ phosphor. The red line represents the fitting result using eqn (2), its fitting error R2 is 0.990. | ||
EL spectra of WLEDs fabricated with BaTiF6:Mn4+
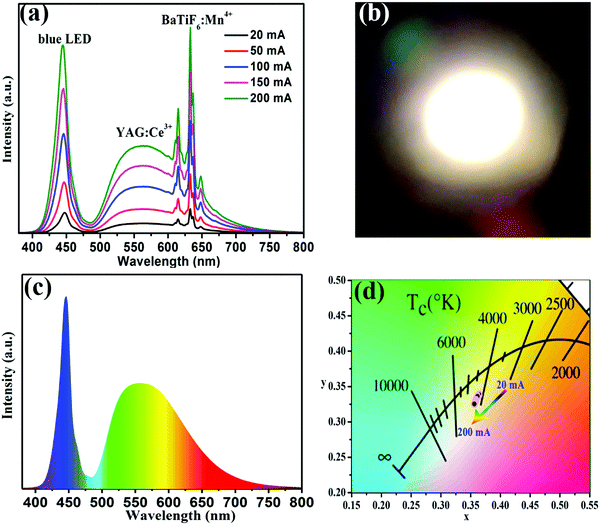
To further validate the potential application of the BaTiF6:Mn4+ phosphors, WLEDs were fabricated using a blue chip combined with a blend of yellow-emitting YAG:Ce3+ and the red-emitting optimized BaTi0.97F6:0.03Mn4+ phosphor operated under different driven currents. The EL spectra of the fabricated WLED under the current regulation from 20 to 200 mA are presented in Fig. 7a. The WLED spectrum is composed of three emission bands: at 445 nm due to the blue chip; at 560 nm from YAG:Ce3+; and at 631 nm from the BaTiF6:Mn4+ phosphor. When increasing the forward-bias current from 20 to 200 mA, the CIE chromaticity coordinates of the WLED only shift slightly from (0.364, 0.338) to (0.356, 0.340), as illustrated in Fig. 7d. Correspondingly, the CCT and CRI values also exhibit only a small change from 4213 to 4410 K and 83.5 to 82.2, respectively, as tabulated in Table 1. Unfortunately, the luminous efficacy gradually decreases from 115 to 90.9 lm W−1 with increasing forward-bias current, due to the monotonically decreasing external quantum efficiency of the blue InGaN chip.52 Moreover, it is obvious that the prototype device emits warm white light (Fig. 7b) under 20 mA forward-bias current (IF). Comparatively, the CIE color coordinates and CRI of the WLED with a blue chip in combination with a YAG:Ce3+ phosphor, whose spectrum is presented in Fig. 7c, are (0.344, 0.362) and 66.9, respectively, at a CCT of 5088 K. These results suggest that the incorporation of the BaTiF6:Mn4+ red phosphor can effectively improve the CCT and CRI values of the WLED and make it a promising candidate for indoor lighting.| Composition | IF (mA) | LE (lm W−1) | CCT (K) | CIE-x | CIE-y | CRI |
|---|---|---|---|---|---|---|
| Chip + YAG | 20 | 162 | 5088 | 0.344 | 0.362 | 66.9 |
| Chip + YAG + BaTiF6:Mn4+ | 20 | 115 | 4213 | 0.364 | 0.338 | 83.5 |
| 50 | 110 | 4260 | 0.362 | 0.335 | 83.1 | |
| 100 | 103 | 4322 | 0.359 | 0.330 | 82.7 | |
| 150 | 96.3 | 4369 | 0.357 | 0.327 | 82.4 | |
| 200 | 90.9 | 4410 | 0.356 | 0.324 | 82.2 |
Conclusions
In conclusion, a series of Mn4+ activated BaTiF6 red phosphors have been successfully synthesized by using a facile co-precipitation method and examined for their use in warm WLEDs. The excitation and reflectance spectra of the BaTiF6:Mn4+ phosphor exhibit strong broad absorption in the 300–550 nm region, which matches perfectly with the emission of the commercial blue chip. The emission intensity of the optimized BaTi1−xF6:xMn4+ (x = 0.03) under 460 nm excitation has appropriate CIE coordinates (x = 0.694, y = 0.306). Moreover, when partnering the red-emitting BaTiF6:Mn4+ phosphor together with a yellow-emitting YAG:Ce3+ phosphor to a blue LED chip, a WLED with a low CCT of 4213 K and a higher CRI of 83.5 is achieved. These results demonstrate that BaTiF6:Mn4+ phosphors have considerable potential for use in warm WLEDs.Conflicts of interest
There are no conflicts to declare.Acknowledgements
This work was financially supported by the National Natural Science Foundation of China (No. 51772336, 51572302, 21271191 and 21661033), the “973” programs (2014CB643801), the Joint Funds of the National Natural Science Foundation of China and Guangdong Province (U1301242), Teamwork Projects of the Guangdong Natural Science Foundation (S2013030012842), Guangzhou Science & Technology Project (2013B090800019, 2015B090926011 and 2017A050501008), and the Natural Science Foundation of the Guangdong Province (2014A030313114).Notes and references
- G. G. Li, Y. Tian, Y. Zhao and J. Lin, Chem. Soc. Rev., 2015, 44, 8688 RSC.
- E. F. Schubert and J. K. Kim, Science, 2005, 308, 1274 CrossRef CAS PubMed.
- J. H. Li, Z. H. Zhang, X. H. Li, Y. Q. Xu, Y. Y. Ai, J. Yan, J. X. Shi and M. M. Wu, J. Mater. Chem. C, 2017, 5, 6294 RSC.
- C. C. Lin and R. S. Liu, J. Phys. Chem. Lett., 2011, 2, 1268 CrossRef CAS PubMed.
- X. F. Liu and J. R. Qiu, Chem. Soc. Rev., 2015, 44, 8714 RSC.
- S. S. Liang, M. M. Shang, H. Z. Lian, K. Li, Y. Zhang and J. Lin, J. Mater. Chem. C, 2017, 5, 2927 RSC.
- Y. Gao, J. B. Qiu and D. C. Zhou, J. Am. Ceram. Soc., 2017, 100, 2901 CrossRef CAS.
- W. Lu, W. Z. Lv, Q. Zhao, M. M. Jiao, B. Q. Shao and H. P. You, Inorg. Chem., 2014, 53, 11985 CrossRef CAS PubMed.
- M. R. Krames, O. B. Shchekin, R. Mueller-Mach, G. O. Mueller, L. Zhou, G. Harbers and M. G. Craford, J. Disp. Technol., 2007, 3, 160 CrossRef CAS.
- C. C. Lin, A. Meijerink and R. S. Liu, J. Phys. Chem. Lett., 2016, 7, 495 CrossRef CAS PubMed.
- T. Pulli, T. Donsberg, T. Poikonen, F. Manoocheri, P. Karhaand and E. Ikonen, Light-Sci.Appl., 2015, 4, e322 CrossRef.
- S. E. Brinkley, N. Pfaff, K. A. Denault, Z. J. Zhang, H. T. Hintzen, R. Seshadri, S. Nakamura and S. P. DenBaars, Appl. Phys. Lett., 2011, 99, 241106 CrossRef.
- X. Q. Piao, K.i. Machida, T. Horikawa, H. Hanzawa, Y. Shimomura and N. Kijima, Chem. Mater., 2007, 19, 4592 CrossRef CAS.
- R. J. Xie, N. Hirosaki, T. Suehiro, F. F. Xu and M. Mitomo, Chem. Mater., 2006, 18, 5578 CrossRef CAS.
- M. Y. Peng, X. W. Yin, X. P. A. Tanner, M. G. Brik and P. F. Li, Chem. Mater., 2015, 27, 2938 CrossRef CAS.
- C. F. Guo, L. Luan, C. H. Chen, D. X. Huang and Q. Su, Mater. Lett., 2008, 62, 600 CrossRef CAS.
- K. L. Wong, G. L. Law, M. B. Murphy, P. A. Tanner, W. T. Wong, P. K. S. Lam and M. H. W. Lam, Inorg. Chem., 2008, 47, 5190 CrossRef CAS PubMed.
- T. R. Wang and H. R. Li, Chem. – Eur. J., 2016, 22, 12400 CrossRef CAS PubMed.
- Z. Q. Li, P. Li, Q. Q. Xu and H. R. Li, Chem. Commun., 2015, 51, 10644 RSC.
- F. W. Kang, X. B. Yang, M. Y. Peng, L. Wondraczek, Z. J. Ma and J. R. Qiu, J. Phys. Chem. C, 2014, 118, 7515 CAS.
- F. W. Kang, M. Y. Peng, X. B. Yang, G. P. Dong, G. C. Nie, W. J. Liang, S. H. Xu and J. R. Qiu, J. Mater. Chem. C, 2014, 2, 6068 RSC.
- F. W. Kang, H. S. Zhang, L. Wondraczek, X. B. Yang, Y. Zhang, D. Y. Lei and M. Y. Peng, Chem. Mater., 2016, 28, 2692 CrossRef CAS.
- Y. Gao, Y. B. Hu, D. C. Zhou and J. B. Qiu, J. Eur. Ceram. Soc., 2017, 37, 763 CrossRef CAS.
- Y. Gao, Y. B. Hu, D. C. Zhou and J. B. Qiu, J. Alloys Compd., 2017, 699, 303 CrossRef CAS.
- Z. C. Li, D. C. Zhou, Y. Yang, Y. P. Ren and J. B. Qiu, Sci. Rep., 2017, 7, 6518 CrossRef PubMed.
- E. H. Song, J. Q. Wang, J. H. Shi, T. T. Deng, S. Ye, M. Y. Peng, J. Wang, L. Wondraczek and Q. Y. Zhang, ACS Appl. Mater. Interfaces, 2017, 9, 8805 CAS.
- Z. L. Wang, Y. Liu, Y. Y. Zhou, Q. Zhou, H. Y. Tan, Q. H. Zhang and J. H. Peng, RSC Adv., 2015, 5, 58136 RSC.
- M. H. Fang, H. D. Nguyen, C. C. Lin and R. S. Liu, J. Mater. Chem. C, 2015, 3, 7277 RSC.
- D. Sekiguchi and S. Adachi, ECS J. Solid State Sci. Technol., 2014, 3, R60 CrossRef CAS.
- L. Huang, Y. W. Zhu, X. J. Zhang, R. Zou, F. J. Pan, J. Wang and M. M. Wu, Chem. Mater., 2016, 28, 1495 CrossRef CAS.
- H. D. Nguyen, C. C. Lin, M. H. Fang and R. S. Liu, J. Mater. Chem. C, 2014, 2, 10268 RSC.
- X. Y. Jiang, Z. Chen, S. M. Huang, J. G. Wang and Y. X. Pan, Dalton Trans., 2014, 43, 9414 RSC.
- X. L. Gao, Y. Song, G. X. Liu, X. T. Dong, J. X. Wang and W. S. Yu, CrystEngComm, 2016, 18, 5842 RSC.
- X. L. Gao, Y. Song, G. X. Liu, X. T. Dong, J. X. Wang and W. S. Yu, Dalton Trans., 2016, 45, 17886 RSC.
- G. L. Mo, W. P. Wang, K. L. Wang, G. H. Wen, M. H. Zhu and J. X. Wang, J. Mater. Sci.: Mater. Electron., 2017, 28, 8155 CrossRef CAS.
- Y. G. Wang, T. Wen, L. Y. Tang, L. X. Yang, W. G. Yang and Y. S. Zhao, Dalton Trans., 2015, 44, 7578 RSC.
- Y. Y. Zhou, Q. Zhou, Y. Liu, Z. L. Wang, H. Yang and Q. Wang, Mater. Res. Bull., 2016, 73, 14 CrossRef CAS.
- Q. Zhou, Y. Y. Zhou, Y. Liu, L. J. Luo, Z. L. Wang, J. H. Peng, J. Yan and M. M. Wu, J. Mater. Chem. C, 2015, 3, 3055 RSC.
- J. S. Liao, L. L. Nie, L. F. Zhong, Q. J. Gu and Q. Wang, Luminescence, 2016, 31, 802 CrossRef CAS PubMed.
- D. Sekiguchi, J.i. Nara and S. Adachi, J. Appl. Phys., 2013, 113, 183516 CrossRef.
- W. L. Wu, M. H. Fang, W. L. Zhou, T. Lesniewski, S. Mahlik, M. Grinberg, M. G. Brik, H. S. Sheu, B. M. Cheng, J. Wang and R. S. Liu, Chem. Mater., 2017, 29, 935 CrossRef CAS.
- H. M. Zhu, C. C. Lin, W. Q. Luo, S. T. Shu, Z. G. Liu, Y. S. Liu, J. T. Kong, E. Ma, Y. G. Cao, R. S. Liu and X. Y. Chen, Nat. Commun., 2014, 5, 4312 CAS.
- Y. W. Zhu, L. Huang, R. Zou, J. H. Zhang, J. B. Yu, M. M. Wu, J. Wang and Q. Su, J. Mater. Chem. C, 2016, 4, 5690 RSC.
- L. L. Wei, C. C. Lin, M. H. Fang, M. G. Brik, S. F. Hu, H. Jiao and R. S. Liu, J. Mater. Chem. C, 2015, 3, 1655 RSC.
- Q. Zhou, Y. Y. Zhou, Y. Liu, Z. L. Wang, G. Chen, J. H. Peng, J. Yan and M. M. Wu, J. Mater. Chem. C, 2015, 3, 9615 RSC.
- R. D. Shannon, Acta Crystallogr., 1976, 32, 751 CrossRef.
- D. Dexter and J. H. Schulman, J. Chem. Phys., 1954, 22, 1063 CrossRef CAS.
- R. Shi, J. Z. Xu, G. K. Liu, X. J. Zhang, W. J. Zhou, F. J. Pan, Y. Huang, Y. Tao and H. B. Liang, J. Phys. Chem. C, 2016, 120, 4529 CAS.
- X. J. Zhang, L. Huang, F. J. Pan, M. M. Wu, J. Wang, Y. Chen and Q. Su, ACS Appl. Mater. Interfaces, 2014, 6, 2709 CAS.
- Z. Yu, Z. G. Xia, M. Y. Chen, Q. C. Xiang and Q. L. Liu, J. Mater. Chem. C, 2017, 5, 3176 RSC.
- F. W. Kang, L. J. Li, J. Han, D. Y. Lei and M. Y. Peng, J. Mater. Chem. C, 2017, 5, 390 RSC.
- T. T. Deng, E. H. Song, J. Sun, L. Y. Wang, Y. Deng, S. Ye, J. Wang and Q. Y. Zhang, J. Mater. Chem. C, 2017, 5, 2910 RSC.
Footnote |
| † Electronic supplementary information (ESI) available. See DOI: 10.1039/c7tc04196a |
| This journal is © The Royal Society of Chemistry 2018 |

