 Open Access Article
Creative Commons Attribution 3.0 Unported Licence
Concentration-adjustable micromixers using droplet injection into a microchannel†
Ryosuke
Sakurai‡
a,
Ken
Yamamoto‡
 *ab and
Masahiro
Motosuke
 ab
ab
aDepartment of Mechanical Engineering, Tokyo University of Science, 6-3-1 Niijuku, Katsushika-ku, Tokyo 125-8585, Japan. E-mail: yam@rs.tus.ac.jp
bResearch Institute for Science and Technology, Tokyo University of Science, 6-3-1 Niijuku, Katsushika-ku, Tokyo 125-8585, Japan
First published on 27th February 2019
Abstract
A novel micromixing technique that exploits a thrust of droplets into the mixing interface is developed. The technique enhances the mixing by injecting immiscible droplets into a mixing channel and the methodology enables control of the mixing level simply by changing the droplet injection frequency. We experimentally characterize the mixing performance with various droplet injection frequencies, channel geometries, and diffusion coefficients. Consequently, it is revealed that the mixing level increases with the injection frequency, the droplet-diameter-to-channel-width ratio, and the diffusion coefficient. Moreover, the mixing level is found to be a linear function of the droplet volume fraction in the mixing section. The results suggest that the developed device can produce a large amount of sample solution whose concentration is arbitrary and precisely controllable with a simple and stable operation.
1. Introduction
Mixing of biological or chemical species is one of the essential processes in lab-on-a-chip and μTAS devices. Above all, the performance of the devices for processes such as the digital polymerase chain reaction (dPCR),1,2 single-molecule analysis,3 chemical synthesis,4 or crystallization5 is markedly dependent on the concentration-control accuracy and the solution homogeneity. To achieve effective, rapid, and complete mixing, various micromixers were developed to enhance the mixing in microscale that is typically dominated by diffusion.The enhancement of the mixing is accomplished by increasing the area of the mixing front. The micromixer is categorized into active and passive types by their mixing enhancement methods,6 and the active ones increase the mixing interface by generating disorder with the aid of the applied external energy. Electrokinetic flows such as the alternating-current electroosmosis (ACEO)7 and electrothermal (ET) flows,8 temperature rise to raise the diffusion coefficient,9,10 or surface acoustic waves (SAWs)11–13 are typical examples of the active mixer. Active mixing has an advantage in the on-demand controllability of the mixing characteristics by adjusting the applied external energy. On the other hand, the devices tend to be complicated because of extra equipments such as an external power supply. Passive micromixers create new interface14 by the design of the mixing channels which have complex and three-dimensional microstructures,15–19 or generate chaotic flows.20,21 Apart from the classical passive mixers, some devices introduce droplets or bubbles to generate disorder of the mixing interface in more dynamic manners.22–29 Although most of the passive mixers cannot modify the mixing characteristics, their packages can be relatively compact and simple as they do not require additional external sources.
Although the passive mixers generally have difficulty in on-demand concentration control as discussed above, they are considered to be prospective because of their cost-effective and simple character. To obtain a wide range of concentrations in a passive system, gradient generators,30–33 which generate serial chemical gradients by tree-like flow paths, and dilutors,34–36 which generate a concentration gradient in specific areas and extract the targeted solution, are often employed. However, they are relatively time-consuming due to slow diffusion in microscale and require precise chip fabrication and handling. Because these shortcomings arise from the diffusion-dominant and pressure-sensitive nature of the devices, we can expect a high-performance device by installing a convection-dominant mixing technique with fewer branches while keeping the whole system simple. Among various passive systems, multiphase-flow-type mixers can generate large disorder by introducing immiscible droplets or bubbles into the mixing channel.14,37 Although they require the addition of the immiscible fluid, they have numerous advantages in keeping the device design simple and thus in being integrated into a composite analysis system with a simple fabrication technique. Moreover, the technique has less influence on biological samples in comparison with the techniques using electrical or thermal effects.14 Garstecki et al.23 introduced bubbles into a series of branching (repeatedly split and recombined) microchannels and achieved effective mixing by fluctuating the pressure between the branches. Günther et al.24 utilized bubbles to form a slug (Taylor) flow in a curved microchannel to divide the sample flow into small segments in which the diffusion length can be shortened. Mao et al.25 implemented chambers in a microchannel downstream of a flow-focusing device where bubbles are generated and the mixing is enhanced by a chaotic flow induced by the random movement of the bubbles in the chambers.
In addition to the aforementioned mixers, which aim to obtain complete mixing (i.e., homogeneity of the solution), mixing inside the droplets is also exploited to control the concentration of the solution in such types of systems.34 They typically require sequential and repetitive procedures to obtain the demanded concentration and therefore the operation tends to be complicated and the resulting throughput is lowered. To achieve a higher throughput and controllability, a multiphase-flow type mixer, which controls the concentration outside the droplets, is developed in the present study. The device enhances mixing by generating disorder at the mixing interface and concentration adjustment is achieved by controlling the level of disorder. The disorder is generated by striking the solution–buffer interface with immiscible droplets, and the disorder level is adjusted by varying the droplet frequency (droplets per second). Furthermore, effects of the channel geometry and the diffusion coefficient of the sample are also investigated. The developed device successfully shows fine concentration controllability and high responsiveness with simple and stable operation.
2. Experimental setup and procedures
Device design and fabrication
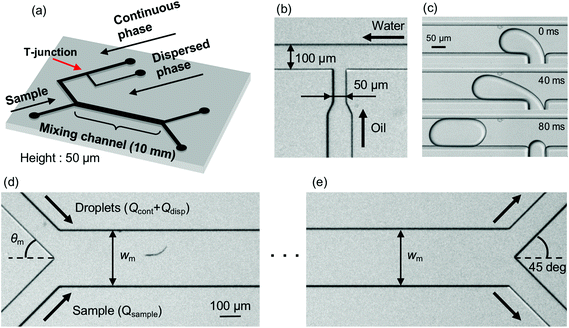
A schematic of the micromixing device, which effectively mixes solutions by means of droplet injection, is shown in Fig. 1(a). The channel height is set to 50 μm. The droplets are generated at a T-junction where a continuous-phase channel (100 μm wide) and a dispersed-phase channel (50 μm wide) merge [Fig. 1(b) and (c)]. In the downstream region, the continuous phase works as a buffer and is mixed with the sample solution in a mixing channel. The continuous-phase channel and the sample-solution channel (100 μm wide) merge with angle θm [Fig. 1(d)] and the buffer (including droplets) and the sample flow through the mixing channel whose width and length are Wm and 10 mm, respectively. At the confluence point, the sample–buffer interface is perturbed as the droplets carried by the continuous phase strike the interface, which results in enhancing the mixing efficiency. At the end of the mixing channel, the mixed sample is extracted from an upper-side bifurcation channel [100 μm wide, Fig. 1(e)].The PDMS (polydimethylsiloxane) micromixer is fabricated by the standard soft lithography technique.38 First, PDMS is mixed with a curing agent at a mixing rate of 10![[thin space (1/6-em)]](https://www.rsc.org/images/entities/char_2009.gif) :
:![[thin space (1/6-em)]](https://www.rsc.org/images/entities/char_2009.gif) 1 and the mixed solution is degassed. The degassed solution is then poured into a mold on a silicon wafer made of SU-8 and cured at 80 °C for 60 minutes. Cured PDMS is removed from the mold, holes are punched for the tubing, and Teflon tubes are connected to the holes. Finally, PDMS and a glass substrate are bonded after an oxygen plasma treatment for improving their hydrophilicity and bonding characteristics.
1 and the mixed solution is degassed. The degassed solution is then poured into a mold on a silicon wafer made of SU-8 and cured at 80 °C for 60 minutes. Cured PDMS is removed from the mold, holes are punched for the tubing, and Teflon tubes are connected to the holes. Finally, PDMS and a glass substrate are bonded after an oxygen plasma treatment for improving their hydrophilicity and bonding characteristics.
Experimental setup
The flow inside the device is recorded with 2000 fps from the downward direction using a high-speed camera attached on an optical microscope (see also Fig. S1 in the ESI†). We use two different types of lighting: a bright-field observation with white light emitted by an LED light is carried out for the measurement of the dye solution, whereas a dark-field observation with 505 nm incident light is carried out for the measurement of the fluorescent particle solution. DI water and oleic acid are chosen as the continuous phase and the dispersed phase, respectively. We use a dye solution (a mixture of the brilliant blue FCF and DI water) and a particle solution [a mixture of fluorescent polystyrene particles (1 μm in diameter) and DI water] as the sample solution.Experimental procedures
The working fluids are infused using syringe pumps at a constant flow rate of 420 μL h−1 for the sample flow (Qsample) and the continuous phase (including the droplets) flow (Qcont + Qdisp), and their mixtures are extracted from two outlets connected to an outlet reservoir. The frequency of droplet generation f is controlled by changing the flow-rate ratio of the dispersed phase to the continuous phase (ϕ = Qdisp/Qcont), while maintaining the sum of the flow rate of 420 μL h−1 (see also Fig. S2 in the ESI†). No surfactants are added in the buffer solution in the present study.3. Results and discussion
Mixing enhancement by disorder
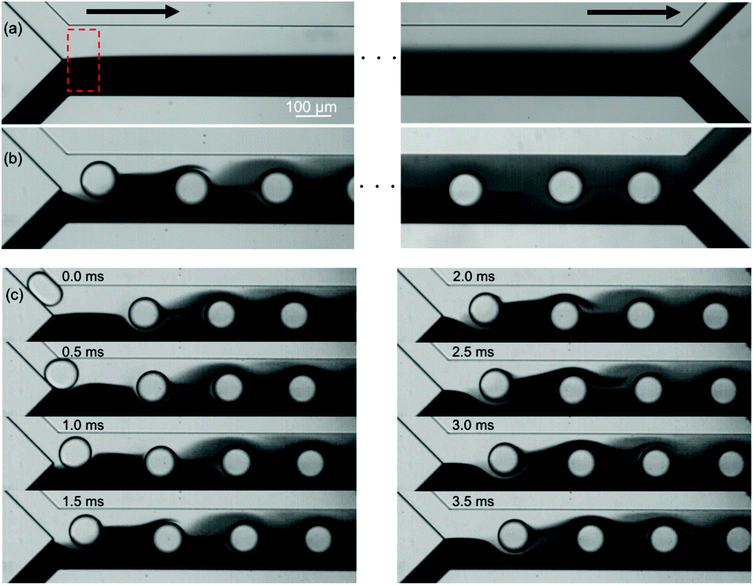
Fig. 2 shows the mixing of the dye solution and the buffer. In the case of the flow without the droplets (Qcont = 420 μL h−1, Qdisp = 0 μL h−1), diffusion is dominant in mixing as shown in Fig. 2(a). On the other hand, the dominant mechanism changes by introducing droplets [Fig. 2(b)]. In this case, the immiscible droplets perturb the mixing front and the mixing enhancement is clearly visible at the end of the mixing channel. Successive images of Fig. 2(c) indicate that the disorder of the interface is induced when the droplets are injected into the mixing channel. The striking motion of the droplets displaces a certain amount of the sample towards the buffer solution region. It implies that the mixing performance is adjustable by controlling the droplet injection. Moreover, the droplets also work as a homogenizer of the mixed (but not spatially homogenized) solution in the outlet channel by confining the channel in which solutions are rapidly homogenized due to the circulated flow inside the slugs.24 In the following sections, we investigate the effects of the droplet injection on mixing in detail by measuring the local mixing level of five cross sections (xm = 0, 2.5, 5.0, 7.5, and 10 mm downstream of the confluence point). The mixing level is quantitatively evaluated by calculating the RMI (relative mixing index)39 by substituting a standard deviation of the light intensity distribution in a specified region inside a channel [e.g., a red-dashed rectangle in Fig. 2(a)] into eqn (1). σ, Ii, I0i, Im, and N in eqn (1) denote the standard deviation of the intensity, the intensity of each image pixel, the intensity of an image pixel before mixing, and the average intensity of the analysis field, respectively. The RMI is exploited as an indicator of the mixing level, where RMI = 1 and RMI = 0 indicate complete separation and complete mixing of two phases, respectively. | (1) |
Effects of the diffusion coefficient and the confluence angle
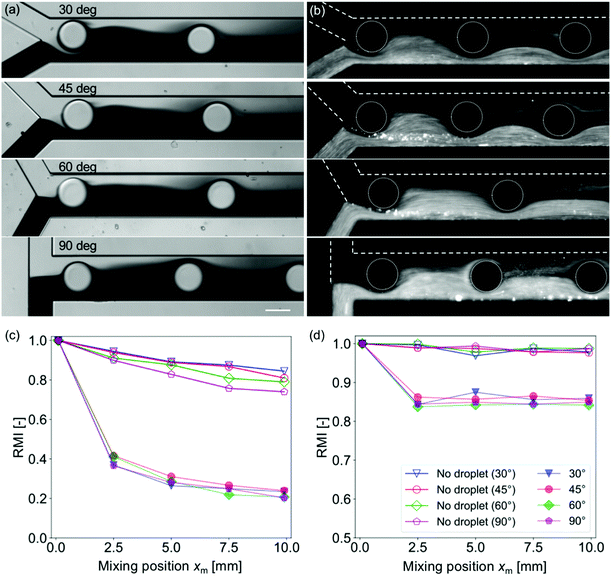
Effects of the diffusion coefficient and the confluence angle on the mixing characteristics are investigated with four different θm (30°, 45°, 60°, and 90°) and two different solutions (dye and fluorescent particle solutions). Fig. 3 shows mixing near the confluence point with different θm values while the width of the mixing channel Wm = 200 μm and the droplet injection frequency f = 15 Hz are kept constant. The images for the dye solutions are obtained under the bright-field conditions, whereas those for the particle solutions are obtained under the dark-field conditions. Fig. 3(a) and (b) reveal that the mixing is enhanced even with a relatively low diffusion coefficient sample (typical diffusion coefficients for the dye and 1 μm particles are 10–10 and 10–16 m2 s−1, respectively). However, the effects of the diffusion coefficient are not negligible for RMI evaluation. In general, the mixing level of the dye solution is higher than that of the particle solutions because the diffusion drives homogenization after the perturbation of the mixing front by the droplets. Moreover, Fig. 3(c) and (d) show that the decrease in the RMI at xm > 2.5 mm is observed only for the case of the dye solution. It suggests that the mixing enhancement by droplet injection is caused only in a region near the confluence point and the diffusion is dominant in the downstream region. The dominance of the diffusion in the downstream region is also suggested by the fact that the inclination of the RMI slopes at xm > 2.5 mm is similar to those for the “no droplet” cases. In addition, the RMI for the dye solution is lower than that for the particle solution (i.e., a higher mixing level) presumably because of the high mobility of the dye.The effect of the confluence angle on the mixing enhancement is observed for the “no droplet” case as the difference in the RMI at xm = 10 mm [Fig. 3(c)] in the dye solution. The diagram indicates that mixing is enhanced as xm increases. This may be due to an increase in the influence of the change of the momentum on the flow field.40,41 Conversely, the angle effect is suppressed in the cases of the particle solution and of the enhanced mixing by the droplets. These results suggest that the effect of droplet injection is significant and that of the confluence angle is negligible for low diffusion coefficient samples and for droplet injection mixing.
Effects of the droplet injection frequency
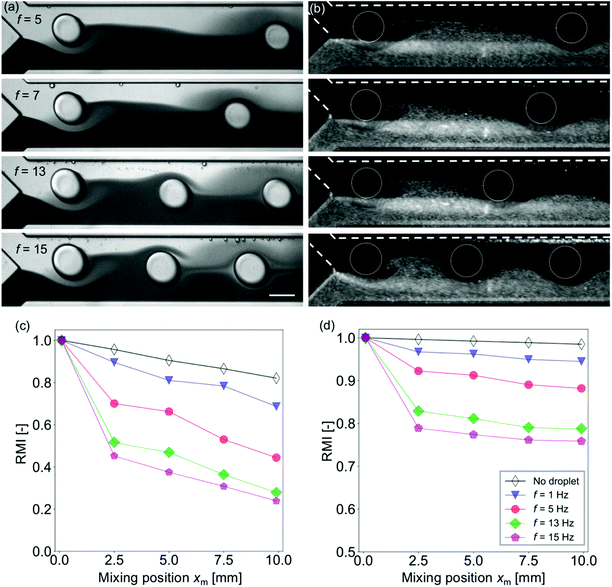
The effect of the frequency of the droplets injected into the mixing channel is investigated. In this experiment, Wm = 250 μm and Qsample = (Qcont + Qdisp) = 420 μL h−1 are treated as constants, while the injection frequency f is changed by controlling the flow rate ratio ϕ. The frequency range is limited by the chip design and the working fluids to f ≤ 15 Hz (see also Fig. S2 in the ESI†). For f > 15 Hz, the droplets are not generated and co-flows are generated.42Fig. 4(a) and (b) show that the distance between the neighboring droplets decreases as the frequency increases. As has been discussed in the previous section, the mixing enhancement by the droplet is the maximum near the confluence point. Fig. 4(c) and (d) indicate that the mixing is more enhanced for higher frequency, whereas the inclination of the RMI for xm > 2.5 mm is almost independent of f for both the dye and the particle solutions.Effects of the droplet size
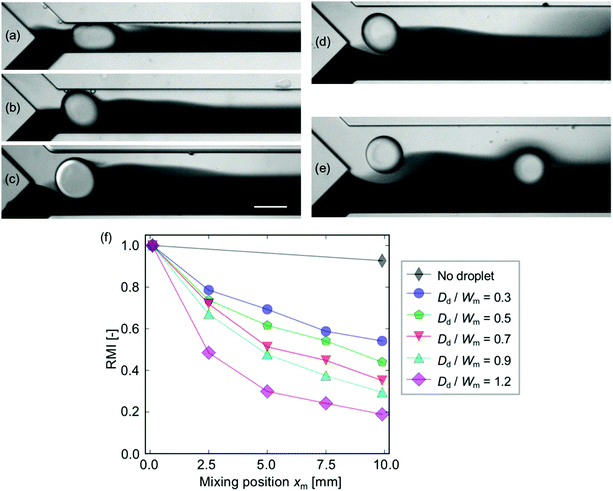
The effect of the droplet occupancy in the width of the mixing channel is investigated under constant mean velocity and droplet diameter Dd conditions. Note that the difference in the velocity does not affect the mixing characteristics except for the diffusion effect in the downstream region (see Fig. S3 in the ESI†). Note also that the droplet occupancy, defined as Dd/Wm, over unity (Dd/Wm > 1), indicates that the droplets are not spherical due to the confinement by the side walls. The experiment is carried out with five different Wm values ranging from 100 μm to 300 μm, in which the occupancy ranges from 0.3 to 1.2. Fig. 5(a)–(e) show the droplets injected into the mixing channel with different Wm values. The images show that the perturbation occurred within the distance of ∼Dd from the interface regardless of the channel geometry. The RMI curves [Fig. 5(f)] show that the mixing is highly enhance in more confined cases. It implies that high confinement is favorable for obtaining a high mixing level.Mass transfer mechanism
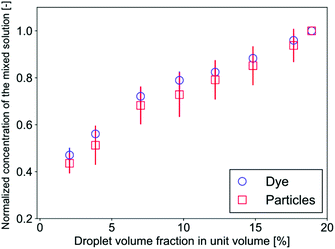
The mass transfer mechanism is discussed in the following part. The successive images in Fig. 2(c) show that the buffer phase overlaps with a droplet, which passes through the confluence point, through gaps between the droplet and the channel walls. As a result, the flow rate at both sides are Q/2 and 3Q/2, respectively, where Q denotes the total flow rate of the three phases. This separation generates a fluctuation of the mixing front because this separation of the flow occurs periodically. Furthermore, the droplet motion in the cross-sectional direction significantly enhances the mixing. In our system, the droplet Reynolds number Red ( = ρuDd/μ, where ρ, u, and μ denote the liquid density, mean velocity in the mixing channel, and liquid viscosity, respectively) ranges from 0.5 to 5: in this range, the inertial lift force is exerted on the droplets and they migrate in the cross-sectional direction towards the channel center.43,44 This migration generates a substantial spanwise mass transfer near the confluence point as can be seen at 1.5–3.5 ms in Fig. 2(c). Consequently, a certain amount (roughly estimated as a half volume of the droplet) of the sample is transferred toward the buffer phase and it flows in the upper side region as the droplets settle down at the center of the channel. It implies that the mixing level can be directly controlled by changing the volume of the droplets in a unit volume (a segmented volume which contains one droplet). This trend is indeed observed in Fig. 4(c) and (d) where the mixing level increases with the droplet frequency under the constant flow rate conditions. Fig. 6 shows the evolution of the sample concentration (normalized by the highest concentration in each case) as a function of the droplet volume fraction. It clearly indicates that the concentration is a linear function of the volume fraction for both the dye and the particle solutions.4. Conclusions
We developed a micromixing device that can control the mixing level (i.e., sample concentration) and demonstrated the mixing of the sample (either dye or particle solution) and buffer. A series of experiments revealed that the mixing is enhanced by droplet injection onto the sample–buffer interface whereby a certain amount of the sample is transferred to the buffer side and the area of the mixing front is increased. It was found that the resulting concentration is a linear function of the droplet volume fraction in a unit volume. The mixing enhancement effect is the maximum at the inlet of the mixing channel, and the diffusion dominates the mixing at the downstream region. The concentration of the mixed solution is then spatially homogenized after being extracted in the outlet channel due to the circulation flow generated in the Taylor flow. These results suggest that our device can produce a large amount of arbitrary-concentration-controlled sample solution with a simple operation.Conflicts of interest
There are no conflicts to declare.Acknowledgements
This work was financially supported by the JSPS KAKENHI Grant Number 16K18033.References
- P. R. Debski and P. Garstecki, Biomol. Detect. Quantif., 2016, 10, 24–30 CrossRef PubMed.
- B. J. Hindson, K. D. Ness, D. A. Masquelier, P. Belgrader, N. J. Heredia, A. J. Makarewicz, I. J. Bright, M. Y. Lucero, A. L. Hiddessen and T. C. Legler, et al. , Anal. Chem., 2011, 83, 8604–8610 CrossRef CAS PubMed.
- B. Schuler and H. Hofmann, Curr. Opin. Struct. Biol., 2013, 23, 36–47 CrossRef CAS.
- K. S. Elvira, X. Casadevall i Solvas, R. C. R. Wootton and A. J. deMello, Nat. Chem., 2013, 5, 905 CrossRef CAS PubMed.
- J. Leng and J.-B. Salmon, Lab Chip, 2009, 9, 24–34 RSC.
- L. Capretto, W. Cheng, M. Hill and X. Zhang, Microfluidics, Springer, 2011, pp. 27–68 Search PubMed.
- W. Y. Ng, S. Goh, Y. C. Lam, C. Yang and I. Rodríguez, Lab Chip, 2009, 9, 802–809 RSC.
- J. Cao, P. Cheng and F. Hong, Microfluid. Nanofluid., 2008, 5, 13–21 CrossRef CAS.
- S.-J. Kim, F. Wang, M. A. Burns and K. Kurabayashi, Anal. Chem., 2009, 81, 4510–4516 CrossRef CAS PubMed.
- G. Yesiloz, M. S. Boybay and C. L. Ren, Anal. Chem., 2017, 89, 1978–1984 CrossRef CAS PubMed.
- D. Ahmed, X. Mao, J. Shi, B. K. Juluri and T. J. Huang, Lab Chip, 2009, 9, 2738–2741 RSC.
- T. Frommelt, M. Kostur, M. Wenzel-Schäfer, P. Talkner, P. Hänggi and A. Wixforth, Phys. Rev. Lett., 2008, 100, 034502 CrossRef.
- T.-D. Luong, V.-N. Phan and N.-T. Nguyen, Microfluid. Nanofluid., 2011, 10, 619–625 CrossRef CAS.
- K. Ward and Z. H. Fan, J. Micromech. Microeng., 2011, 25, 094001 CrossRef.
- Y.-C. Lin, Y.-C. Chung and C.-Y. Wu, Biomed. Microdevices, 2007, 9, 215–221 CrossRef PubMed.
- T. J. Johnson, D. Ross and L. E. Locascio, Anal. Chem., 2002, 74, 45–51 CrossRef CAS PubMed.
- T. W. Lim, Y. Son, Y. J. Jeong, D.-Y. Yang, H.-J. Kong, K.-S. Lee and D.-P. Kim, Lab Chip, 2011, 11, 100–103 RSC.
- S.-S. Hsieh and Y.-C. Huang, J. Micromech. Microeng., 2008, 18, 065017 CrossRef.
- T. Zhou, Y. Xu, Z. Liu and S. W. Joo, J. Fluids Eng., 2015, 137, 091102 CrossRef.
- A. D. Stroock, S. K. Dertinger, A. Ajdari, I. Mezić, H. A. Stone and G. M. Whitesides, Science, 2002, 295, 647–651 CrossRef CAS.
- H. Suzuki, C.-M. Ho and N. Kasagi, J. Microelectromech. Syst., 2004, 13, 779–790 CrossRef.
- H. Dogan, S. Nas and M. Muradoglu, Int. J. Multiphase Flow, 2009, 35, 1149–1158 CrossRef CAS.
- P. Garstecki, M. J. Fuerstman, M. A. Fischbach, S. K. Sia and G. M. Whitesides, Lab Chip, 2006, 6, 207–212 RSC.
- A. Günther, M. Jhunjhunwala, M. Thalmann, M. A. Schmidt and K. F. Jensen, Langmuir, 2005, 21, 1547–1555 CrossRef.
- X. Mao, B. K. Juluri, M. I. Lapsley, Z. S. Stratton and T. J. Huang, Microfluid. Nanofluid., 2010, 8, 139 CrossRef CAS.
- J. D. Tice, H. Song, A. D. Lyon and R. F. Ismagilov, Langmuir, 2003, 19, 9127–9133 CrossRef CAS.
- M. R. Bringer, C. J. Gerdts, H. Song, J. D. Tice and R. F. Ismagilov, Philos. Trans. R. Soc., A, 2004, 362, 1087–1104 CrossRef CAS PubMed.
- J. Wang, J. Wang, L. Feng and T. Lin, RSC Adv., 2015, 5, 104138–104144 RSC.
- L. Yang, S. Li, J. Liu and J. Cheng, Electrophoresis, 2018, 39, 512–520 CrossRef CAS PubMed.
- G. M. Walker, J. Sai, A. Richmond, M. Stremler, C. Y. Chung and J. P. Wikswo, Lab Chip, 2005, 5, 611–618 RSC.
- C.-Y. Chen, A. M. Wo and D.-S. Jong, Lab Chip, 2012, 12, 794–801 RSC.
- G. Destgeer, S. Im, B. Hang Ha, J. Ho Jung, M. Ahmad Ansari and H. Jin Sung, Appl. Phys. Lett., 2014, 104, 023506 CrossRef.
- K. Lee, C. Kim, B. Ahn, R. Panchapakesan, A. R. Full, L. Nordee, J. Y. Kang and K. W. Oh, Lab Chip, 2009, 9, 709–717 RSC.
- W. Postek, T. Kaminski and P. Garstecki, Analyst, 2017, 142, 2901–2911 RSC.
- N. Zijlstra, F. Dingfelder, B. Wunderlich, F. Zosel, S. Benke, D. Nettels and B. Schuler, Angew. Chem., Int. Ed., 2017, 129, 7232–7235 CrossRef.
- J. Fan, B. Li, S. Xing and T. Pan, Lab Chip, 2015, 15, 2670–2679 RSC.
- S.-Y. Teh, R. Lin, L.-H. Hung and A. P. Lee, Lab Chip, 2008, 8, 198–220 RSC.
- Y. Xia and G. M. Whitesides, Angew. Chem., Int. Ed., 1998, 37, 550–575 CrossRef CAS PubMed.
- A. Hashmi and J. Xu, J. Lab. Autom., 2014, 19, 488–491 CrossRef PubMed.
- N. Aoki, T. Fukuda, N. Maeda and K. Mae, Chem. Eng. J., 2013, 227, 198–202 CrossRef CAS.
- J. B. You, Y. Choi and S. G. Im, Microfluid. Nanofluid., 2017, 21, 121 CrossRef.
- J. K. Nunes, S. S. H. Tsai, J. Wan and H. A. Stone, J. Phys. D, 2013, 46, 114002 CrossRef PubMed.
- D. Di Carlo, Lab Chip, 2009, 9, 3038–3046 RSC.
- D. Di Carlo, J. F. Edd, K. J. Humphry, H. A. Stone and M. Toner, Phys. Rev. Lett., 2009, 102, 094503 CrossRef PubMed.
Footnotes |
| † Electronic supplementary information (ESI) available. See DOI: 10.1039/C8AN02310G |
| ‡ These authors contributed equally. |
| This journal is © The Royal Society of Chemistry 2019 |

